======================================
MY Comment, by KEN GRAUER, MD (8/3/2025):
I’ve excerpted this page from the January 24, 2020 post in Dr. Smith’s ECG Blog — for the purpose of providing ready reference to a list of Causes of Low Voltage. For full details of this amazing case — See the above link to this 1/24/2020 post.
- In Figure-1 — I’ve reproduced the 3 serial tracings shown in this 1/24/2020 case.
- The case was complicated (ie, Recurrent VFib, application of ECMO, timely cardiac cath showing acute LAD occlusion — reperfused with PCI).
Figure-1: The 3 serial tracings in this January 24, 2020 post.
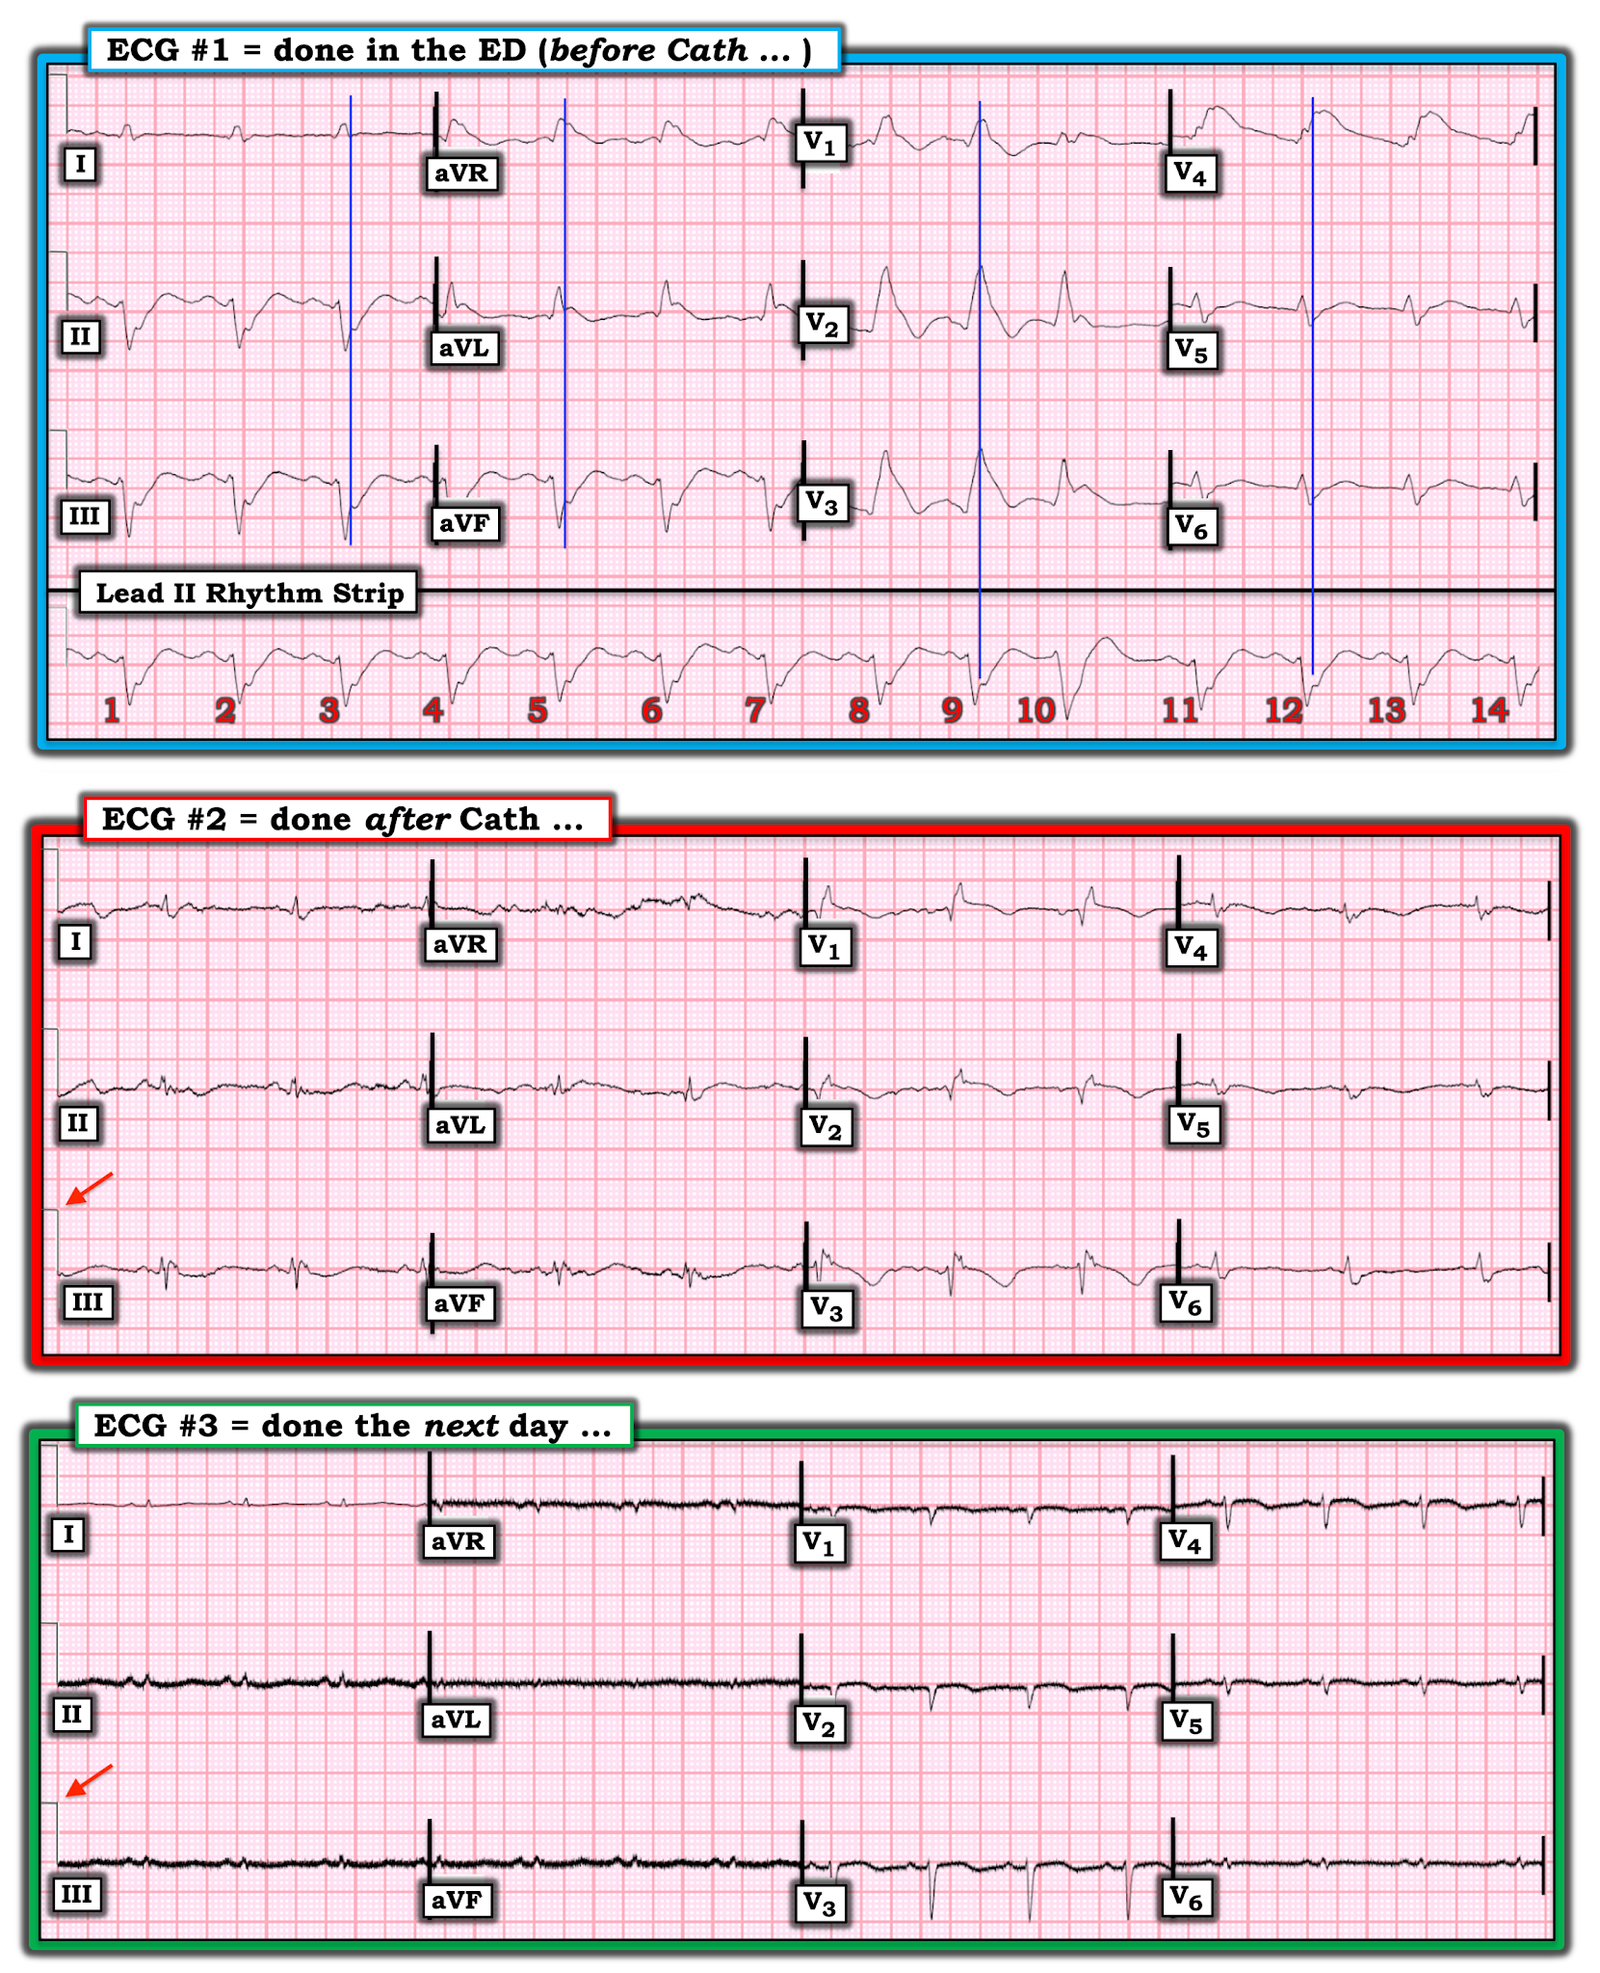
Clinical Points Regarding ECG #1:
ECG #1 — shows sinus rhythm with bifascicularblock (RBBB/LAHB). There is marked anterior ST elevation with equally marked inferior ST segment depression. I’d add the following points:
- The long lead rhythm strip shows a PAC (ie, beat #9 occurs early, with a different-looking P wave and a shorter PR interval) + a PVC in the following beat (ie, beat #10 which is wide, of different morphology, and not preceded by any P wave).
- There is a “Shark Fin”morphology to the ST segment elevation! (See My Comment in the 11/22/2019 post — as well as many others on Shark Fin morphology).
- Because the last portion of the QRS complex blends in almost imperceptibly with the beginning of the ST segment — assessment of both QRS width and the amount of ST segment deviation becomes challenging with “Shark Fin” morphology.
- To recite Dr. Meyers’ eloquent quote — “When the QRS is wide, the J-point will hide. So, your next move is to Trace it down, and Copy it over”. I have done this in ECG #1 — in which the vertical BLUE lines indicate the J-point in each of the 12-leads. This reveals no less than 10 mm of ST elevation in lead V2, and ~5 mm of reciprocal ST depression in each of the inferior leads.
- Note there is also considerable ST elevation in lead aVL. I always hone in on lead aVL — as the combination of marked anterior ST elevation + marked inferior lead reciprocal ST depression + significant ST elevation in lead aVL — is a reliable indicator of proximal LAD (if not LMain) occlusion.
- Small, but fairly wide Q waves have already formed in leads V1, V2 and V3.
- R wave amplitude looks small in virtually all of the lateral leads (which I initially attributed to loss of anterolateral forces from the large ongoing STEMI ).
= = =
What Has Happened After Cardiac Cath? (ie, in ECG #2):
- HINT: Did YOU look at the RED arrow in ECG #2?
= = =
ANSWER: The post-cath ECG ( = ECG #2) shows sinus rhythm at a somewhat slower rate than was seen in ECG #1.
- The RBBB persists in association with relatively large Q waves in leads V1, V2.
- LAHB has resolved.
- Although there remains some residual ST elevation in leads V1 and V2 — the amount of ST segment deviation (elevation and depression) has dramatically decreased since the “Shark Fin” pattern that we saw in ECG #1.
- The RED arrow in ECG #2 points to the standardization mark — which remains at 10 mm (0.1 mV/mm). But despite NO change in the standardization mark setting — QRS amplitude is dramatically reduced in virtually all 12 leads!
= = =
What Do You See in ECG #3?
- HINT: Did YOU look at the RED arrow in ECG #3?
= = =
= = =
ANSWER: The “good news” in ECG #3, is that the RBBB has now resolved. ST segment deviation is now no more than barely present.
- That said, despite no change in the standardization mark setting — QRS amplitude has further decreased !!!
Causes of Low Voltage:
- True Low Voltage is not a common ECG finding. I’ve adapted from the section in Life-In-The-Fast-Lane on this subject, adding from my personal experience — in which I list Causes to Consider when you see true Low Voltage on an ECG (Figure-2).
- Going through this list — we arrive at that last cause that I’ve listed = a large acute MI. Considering ongoing clinical events in this case — everything points to “myocardial stunning” as the cause of progressive reduction in QRS amplitude over the 3 serial ECGs that appear in Figure-1. Follow-up Echo the day following resuscitation revealed an estimated EF ~10-15% (presumably corresponding to about the time ECG #3 was obtained). But then — there was spontaneous recovery of contractility, with an EF that rapidly recovers to a normal value = 58%!
- Myocardial “Stunning” — has been described as a transient marked reduction in cardiac contractility, that occurs in response to a major acute insult. This phenomenon has been associated with cardiac arrest; after cardiac surgery; post-cardioversion following a sustained tachyarrhythmia; with certain types of acute cerebrovascular events (such as subarachnoid hemorrhage) — and, in association with large acute MI, which is almost certainly the clinical scenario in this case!
- P.S. — I would have LOVED to see one more follow-up ECG (done ~12-36 hours after recovery of normal contractility) — to see if QRS amplitude substantially increased!
= = =
Figure-2: Causes of Low Voltage on ECG (See text).

= = =
What is Voltage Discordance?
- On occasion there may be low voltage in the limb leads (ie, all QRS voltage in the limb leads ≤5 mm) — but normal QRS voltage in the chest leads. This is called, “Voltage Discordance” (Chinitz et al — J Electrocardiol 41(4):281-286, 2008).
- Low voltage isolated to the limb leads will be associated with the usual list of potential causes in only about 50% of cases. (This usual list shown above in Figure-2).
- In the remainder of cases of “Voltage Discordance” — the patient will have a dilated cardiomyopathy. Physiologic explanation for why this ECG phenomenon is seen is discussed in 7 sequential figures shown HERE (adapted from a PDF presentation by Ahmed ElBorae, MSc — 2022, from Cairo University).
= = = = = =

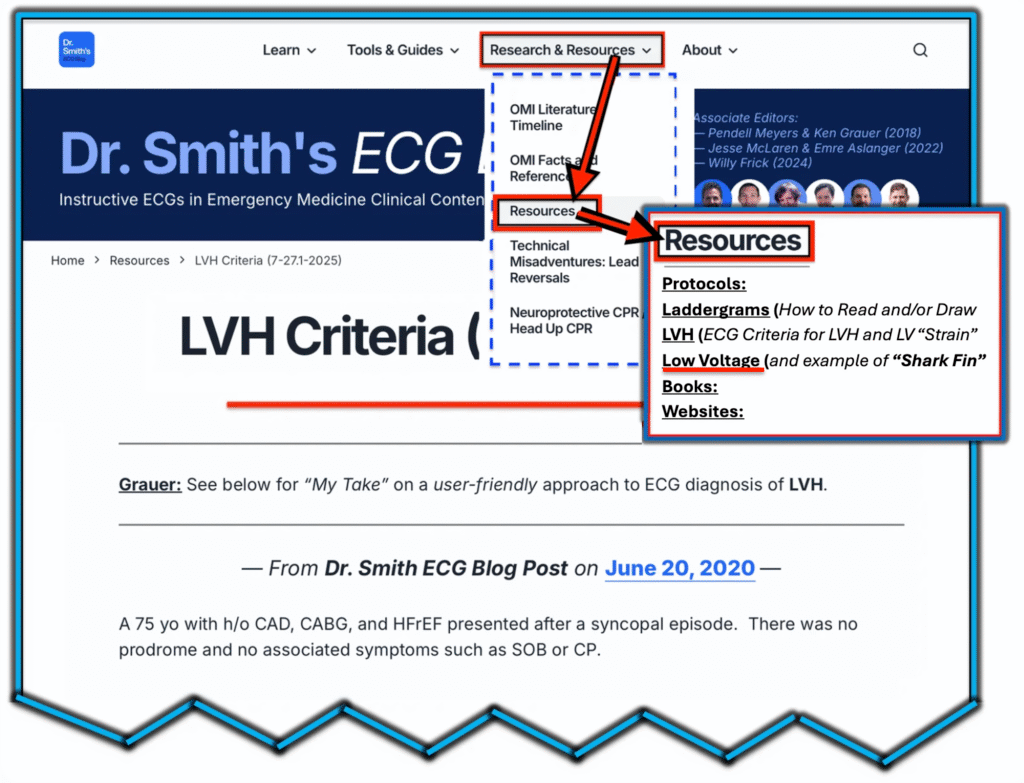
— Where to find the Low Voltage LINK in the Top Menu —
Go to Research & Resources — then Resources — then Low Voltage —