Online QTc Calculator for Normal and Wide QRS (as may be seen with LBBB, RBBB or IVCD )
There are 2 parts to this QTc Calculator. You should immediately see Part-1. You may need to scroll over to see Part-2 of this embedded Excel table.
- Part-1: Calculation of the QTc by the 5 most commonly used methods. Enter the Heart Rate and the QT interval that you measure (in msec.) — and after you click Return, you should see the 5 values!
- Part-2: Calculation of the modified QTc if the QRS is wide (ie, because of LBBB, RBBB, IVCD). Enter the Heart Rate — the QRS duration (in msec.) — and the QT interval that you measure (in msec.) — and the Rautaharju QTc (modified to account for QRS widening) should come up.
- The Bogossian value that comes up if for the QT has now been “modified” to account for the widened QRS. After getting this Bogossian QT value — Plug this QT value in to Part-1 to get the modified QTc.
- Smith: Clinically — “It is probably not a good idea to ‘correct’ for the QT interval when the heart rate is below 60/minute — because a slow rate puts the patient at higher risk of Torsades”. (See the July 12, 2025 post by Dr. Nossen for the post including this Smith quote — which reviews the fascinating case of a 70-something year old woman whose “Congenital” Long QT Syndrome was only discovered when she was in her 70s!). I would add that corrections for very slow heart rate tend to be less accurate — with relatively less “correction” below the QT measured at ~60/minute.
= = =
NOTE: This QT calculator has been created by Arron Pearce.
- The calculator is a work in progress — as we aim to continue optimizing making it. In the meantime — we welcome your feedback (Send to Ken Grauer, MD — ekgpress@mac.com).
- The calculator was created on an Excel file, that we have embedded in this blog post in Dr. Smith’s ECG Blog (Easy access available by clicking in the Menu Bar at the TOP of every page in Dr. Smith’s ECG Blog.)
- ATTENTION: Some users have reported that the Calculator is not working for them … For some — this appears to be browser specific (ie, whether using Safari – Foxglove – Chrome, etc.) — but for me, the Calculator is working on Mac computer, ipad & iphone in all 3 of the above browsers.
- — KEY: Sometimes the Calculator needs to be “woken up”. For example, on smart phone or tablet — You may need to tap twice, quickly and firmly over the box where you enter data — and then it works! Similarly, on computer — You may need to tap more than once — and then it works.
- Please — Let me know if you are unable to get the application to work (and if so — what kind of device and which browsers is it not working on. Thank you! ).
- P.S.: For step-by-step on how I embedded this QTc Calculator Excel file — CLICK HERE —
Grauer: The fact that you will see slightly different values in the above QTc calculator conveys the lack of universal agreement on QTc calculation at different heart rates. That said — 4 of the 5 methods are generally quite close to each other (You might mentally take an average of those readings for the value you select — or pick your “favorite” among the methods).
- In our experience — We find the Bazett method potentially problematic, in that it tends to overestimate the QTc for faster heart rates — and underestimate the QTc for slower heart rates.
- For QTc estimation when the rate is slow (ie, under 60/minute) — as per Dr. Smith above, caution is advised for QTc calculation at slower heart rates because: i) QT corrections for bradycardia are not optimally accurate; — and, ii) Regardless of the QTc that you determine — the bradycardia by itself automatically increases risk for Torsades. That said — of available options, the Fridericia formula appears to be the best for assessing the QTc with bradycardia (Indraratna et al — J Gen Intern Med 35(3):865-873, 2019).
- For QTc estimation when the QRS is wide — I find the Bogossian method to be problematic because the simplified formula that is used by the Bogossian method to calculate the modified QT = QT minus ~50% of QRS duration. But since all this entails is to subtract ~50% of QRS width (ie, for a widened QRS = 0.16 msec — 0.08 msec would be subtracted from the QT you measured) — there is no compensation for any change in heart rate (and since we know the QTc is altered by faster or slower heart rates — I believe the Bogossian method is fatally flawed).
= = =
ADDENDUM (7/12/2025):
Our goal for this QTc Calculator is to facilitate QTc estimation (for any tracing — regardless of whether the QRS is normal or wide).
- We’ve added a quick link to the QTc calculator in the Menu at the top of every page in Dr. Smith’s ECG Blog (Figure-1).
= = =
Figure-1: Quick link to the QTc Calculator in the Menu at the TOP of every page in Dr. Smith’s ECG Blog.

= = =
Add a quick link on your smart phone!
- Figures-2 and -3 below show how to easily do this on iphone.
- To find out how to do this for other brand smart phone — Simply do a Google Search for, “Can you add link to home screen of Android? (or other brand).
= = =
Figure-2: To add a quick link on iphone — GO TO the QTc Calculator page in Dr. Smith’s ECG Blog. Once there — Click in the bottom Menu on the icon within the BLUE rectangle (LEFT panel). This takes you to the page shown in the RIGHT panel — Scroll down that page until you get to, “Add to Home Screen”.

= = =
Figure-3: After the actions in Figure-2 — You’ll be taken to the page shown in the LEFT panel. You need to choose a short title in order to “fit” on your iphone screen. We suggest, “QTc Calculator”. Then click on “Add” — and you are done! You’ll find your quick link to the QTc Calculator on the home screen of your iphone (within the YELLOW rectangle, as shown in the RIGHT panel).

= = =
Please give us your feedback! (Ken Grauer, MD — ekgpress@mac.com )
= = =
NOTE: What follows below is My Comment found at the bottom of the page from the July 12, 2025 post — in which Dr. Nossen reviews the fascinating case of a patient with “Congenital” Long QT Syndrome that was not detected until this patient was in her 70s! (to illustrate use of the QTc Calculator when the QTc is very longi).
======================================
MY Comment, by KEN GRAUER, MD (7/12/2025 ):
Fascinating case by Dr. Nossen — of a “congenital” ECG abnormality that did not present for medical attention until today’s patient was in her 70s!
- I focus My Comment on a number of additional points to those brought out in Dr. Nossen’s excellent discussion above.
- For clarity in Figure-1 — I’ve labeled the KEY areas in today’s initial ECG that left me uncertain about what I was seeing.
= = =
How Long is the QTc in Today’s ECG?
Reminder: Accurate determination of the QTc ( = the QT interval corrected for heart rate) is essential for optimal management of a number of important clinical conditions. This is especially true for today’s case, in which the patient developed arrhythmic storm, with episodes of Torsadesde Pointes ( = a condition that depends on accurate determination of the QTc to distinguish it from polymorphic VT, in which the QTc is normal).
- To facilitate QTc determination at various heart rates — We’ve added a QTc Calculator that is readily accessible from the Menu found at the TOP of every page in Dr. Smith’s ECG Blog.
- Go to Tools & Guides in the TOP Menu. From the pull-down menu, click on QT Calculator. This will take you to THIS PAGE —
Dr. Nossen estimates the QTc in today’s initial ECG at ~630 msec.
- Dr. Nossen may be correct.
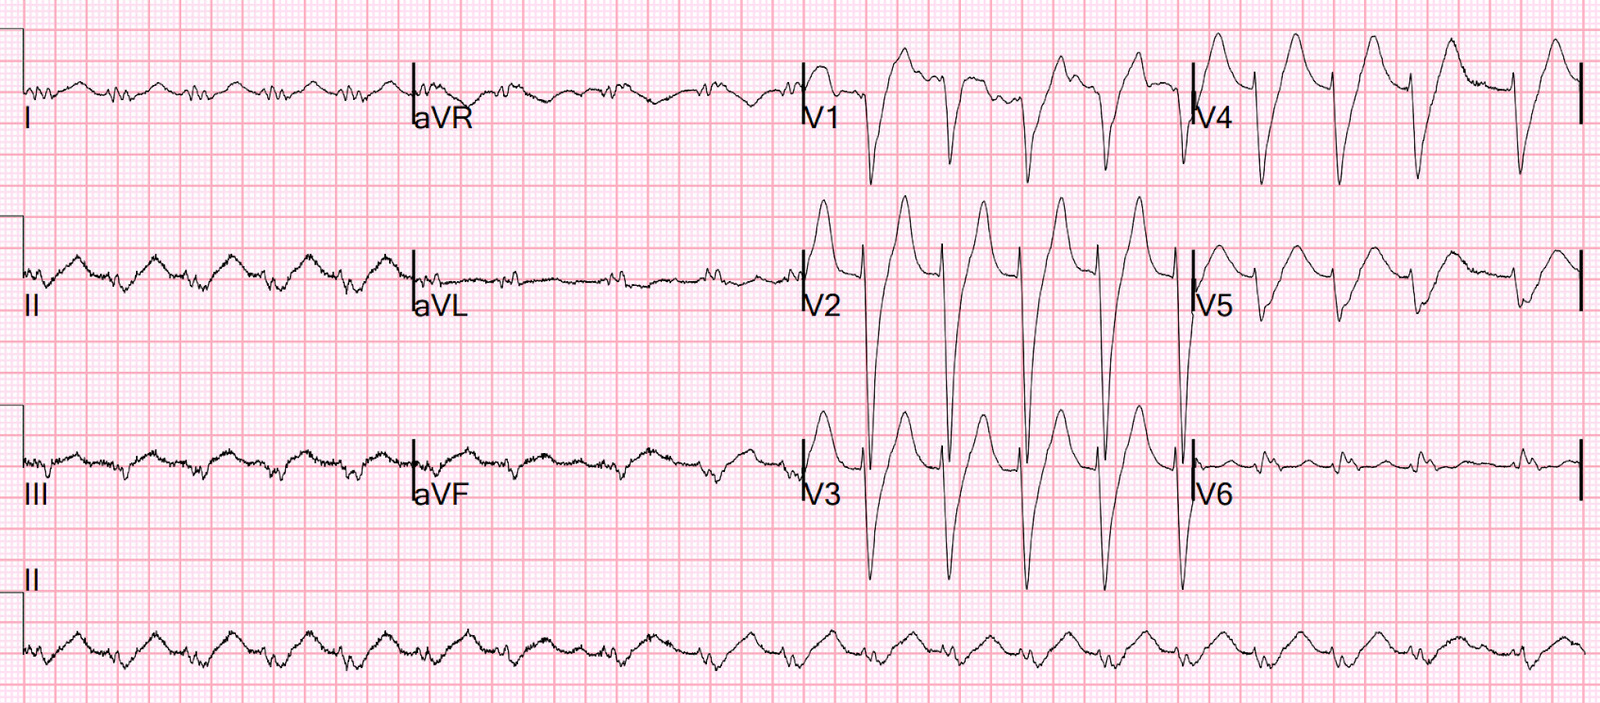
- My Thought — I do not know what the QTc is for today’s initial ECG (which for clarity, I’ve reproduced in Figure-1).
- The reason I do not know what the QTc is in ECG #1 — is that a form of electrical alternans is present, in which either the T wave or the U wave is changing in size and shape every-other-beat.
- I simply am not sure in Figure-1 — where the T wave ends (and where the U wave begins). Without being able to determine this — it’s not possible to be certain about the QTc interval.
= = =
Figure-1: I’ve labeled the initial ECG in today’s case. Where does the T wave end and the U wave begin? (Is there T wave or U wave alternans?).

= = =
Looking Closer at Today’s Initial ECG:
Why is it so difficult to assess the QTc interval in ECG #1? Does this make a difference in our management of today’s patient?
- The 1st challenge in assessing today’s tracing — is that we only have 5 beats to look at in Figure-1 (ie, The same 5 beats that are seen in the chest leads — are also seen in the limb leads). In addition — the R-R interval is not completely regular. Thus, we only have 5 beats in this sinus arrhythmia from which to determine the QTc.
- Next — some form of T wave or U wave alternans is present (See My Comment at the bottom of the page in the October 23, 2023 post in Dr. Smith’s ECG Blog for review about the various forms and clinical significance of Electrical Alternans). As per the above discussion by Dr. Nossen (and as was brought out in the above-cited October 23, 2023 case) — the presence of T wave (and presumably also U wave) alternans should serve to alert providers of a significantly increased the risk of Torsades — unless precipitating factors are promptly corrected, and especially serum electrolytes are normalized (often assisted by administration of supplemental IV Magnesium).
For example — Take Another LOOK at Figure-1:
- Note the alternating size and morphology that occurs after every-other QRS complex (Best seen in leads I,II — and in leads V1,V2).
- Doesn’t it look in leads I and V1 — that the T wave is dramatically changing (becoming much larger for the T wave of beats #1,3,5?).
- But what about leads II and V2? Doesn’t it look like it is the U wave (and not the T wave) that gets much larger with alternate beats? (with a giant negative U wave now seen in lead V2 for beats #1,3,5?).
- Or perhaps, rather than either the T wave or the U wave — fusion of these 2 ECG waves is responsible for the unusual change in morphology seen after alternate QRS complexes?
- NOTE: Most of the time — it is not difficult to distinguish between the end of the T wave and the beginning of the U wave. But today’s case illustrates one occasion in which I can not be confident doing so.
- Guidelines have been been cited for measuring the QT interval in cases in which prominent U waves are present (See below). But as for Panel D in my Figure-2 below — including a large U wave that looks to be fused with the preceding T wave in determination of the QT — risks overestimation of the QTc level when uncertainty prevails as to where the T wave ends.
- Riera et al (Cardiol J 15(5):408-421, 2008) suggests use of the term, “Q(T + U) interval” — when there is marked prolongation of this interval, in which an apparent huge U wave masks the T wave end point.
- Riera also cites the recommendation when debating the difference between a 2-peaked T wave vs a T wave and U wave — to measure the distance between the 2 peaks that are seen (as I schematically show in lead V5 of Figure-2). If the distance between these 2 peaks is <150 msec. ==> then Assume this is a dual-peaked T wave. But if the distance between peaks is >150 msec. ==> Assume there is both a T wave and a U wave. (ie, In Figure-2 — the distance between peaks = 1 large box on ECG paper = 200 msec., which if the above recommendation is accurate suggests that we are seeing a T wave and a U wave in Figure-2). However, given the discrepancy I cited earlier between what we see in leads I,II and V1,V2 in Figure-2 — I find it difficult to accept the between-peak distance recommendation.
= = =
BOTTOM Line:
I still have no idea as to where the T wave ends in Figure-1 (ie, at the point where the light BLUE vertical line crosses the baseline — or where the RED vertical line crosses the baseline?).
- Clinically — This distinction does not matter. Although my estimate of the QTc interval for ECG #1 in today’s case is less than the 630 msec. estimated by Dr. Nossen — both of us agree that the QTc is significantly prolonged!
- Both of us also agree that the unusual alternate beat morphology change (regardless of whether this is a change in T wave vs U wave vs some indiscernible fusion of the two) — indicates either T wave or U wave alternans, which serves as a high-risk warning for development of Torsades unless metabolic conditions (and especially serum K+ and Mg++ levels) are quickly optimized.
- Along the way — The cause of U waves on ECG remains uncertain. Among the hypotheses for the generation of U waves include repolarization of Purkinje fibers — delayed repolarization of papillary muscles — afterpotentials caused by mechanical forces in the ventricular wall — prolonged repolarization of mid-myocardial “M-cells”. But — No one really knows …
- PEARL #1: Regardless of its T wave or U wave etiology — the marked degree of apparent T-U wave merging seen in today’s initial ECG is typical of the LQTS, Type 1 that today’s patient was found to have.
- PEARL #2: I long ago developed the easy-to-remember but surprisingly useful LIST of 3 Causes to consider whenever you encounter a long QTc in a patient who does not have a wide QRS. Think of the following! — i) Drugs (as noted above in Dr. Nossen’s discussion); — ii) Lytes (especially low serum K+ and Mg++ — but also low Ca++); and, iii) CNS disturbances (ie, Stroke [as for the patient in today’s case] — CNS Bleed — Brain Tumor — Coma — Seizure — Head Trauma — as some of the most abnormal ECGs are seen in patients with some form of CNS emergency).
- In 2025 — I’ll amend the above LIST by adding, under the right clinical circumstances — iv) Takotsubo (Stress) Cardiomyopathy (with an unusual anatomic distribution of ST-T wave abnormalites on ECG, that occurs in association with a surprisingly long QTc interval — suggesting this entity in a patient with new CP, heart failure, severe stress, etc.).
= = =
How to Measure the QTc when U Waves are Present:
In Figure-2 — I’ve adapted the figure published by Rawshani in the first reference cited above by Dr. Nossen (Rawshani — Cardiovasc Med, 2025). I’ve consolidated below several helpful tips put forth by Rawshani:
- For optimal accuracy — Measure the QT manually, ideally using a series of consecutive beats — taken from more than a single lead — selecting the longest QT interval for which you can clearly see the onset and offset landmarks of the QT.
- The QT interval should be measured from the onset of QRS complex until the end of the T wave (ie, If no Q wave is present — begin measuring from the R wave).
- Leads with large U waves are ideally avoided. While recommended to include large U waves that are fused with the preceding T wave in your measurement — Realize that doing so may result in overestimation of the QT interval (with this being a significant problem in today’s case! ).
- Be sure to adjust the QT interval for heart rate! (See My Reminder above, near the beginning of My Comment).
= = =
= = =
Figure-2: How to measure the QTc when U waves are present (Figure adapted from Rawshani — Cardiovasc Med, 2025).

= = =
NOTE: What follows below is My Comment found at the bottom of the page from the September 2, 2019 post — in which Dr. Meyers presents the fascinating case of a patient with Short QT Syndrome (which illustrates use of the QTc Calculator when the rate is fast and the QT is short).
======================================
MY Comment, by KEN GRAUER, MD (9/2/2019 — updated for WordPress on 12/6/2025):
Great case by Dr. Meyers about an important ECG entity that is not commonly seen. As I suspect many of those reading this column did — I initially put hyperkalemia at the top of my differential diagnosis list.
- That said — these T waves would be among the tallest and “skinniest” I’ve ever seen, if the etiology of this T wave appearance turned out to be hyperkalemia …
Dr. Meyers highlights that an equally impressive finding as T wave appearance in this tracing is the shortened QTc interval. And, there’s another finding …
- For clarity in Figure-1 — I’ve numbered the beats in the long lead V1 rhythm strip.
= = =
QUESTION #1: What is the rhythm in Figure-1?
= = =
Figure-1: The ECG shown in this case. What is the rhythm?

= = =
ANSWER: What is the Rhythm in Figure-1?
The QRS complex is narrow. Although easy to overlook if not carefully measured — the R-R interval in the long lead V1 rhythm strip is not regular. Figure-2 shows the variation in R-R intervals (BLUE numbers indicating R-R interval duration in milliseconds).
- Upright P waves with a fixed PR interval precede beats #3,4,5 and 6 (RED arrows in the long lead V1 rhythm strip). Presumably, these are sinus P waves — albeit the P wave is extremely small in amplitude, and the PR interval looks to be relatively short.
- We only see 1 QRS complex for lead II. This is beat #1 — which is not preceded by any P wave at all.
- I believe the small-amplitude negative “dip” preceding beat #2 in the long lead V1 is artifact. I don’t believe any P wave precedes beat #2.
- Beat #7 is cut off — and, the RED question mark, followed by a drop in the PR interval indicates there is artifact. I don’t believe any conclusion can be made about atrial activity for beat #7.
- BOTTOM Line: The longest R-R interval in the long lead V1 is between beats #1 and 2 (Figure-2) — and neither of these 2 beats is preceded by any P wave. Therefore, beats #1 and 2 are junctional escape beats. The underlying rhythm in Figure-1 is marked sinus bradycardia with sinus arrhythmia — and when the sinus rate slows enough, junctional escape beats arise.
= = =
Figure-2: I’ve numbered and labeled key parts of Figure-1 (See text).

= = =
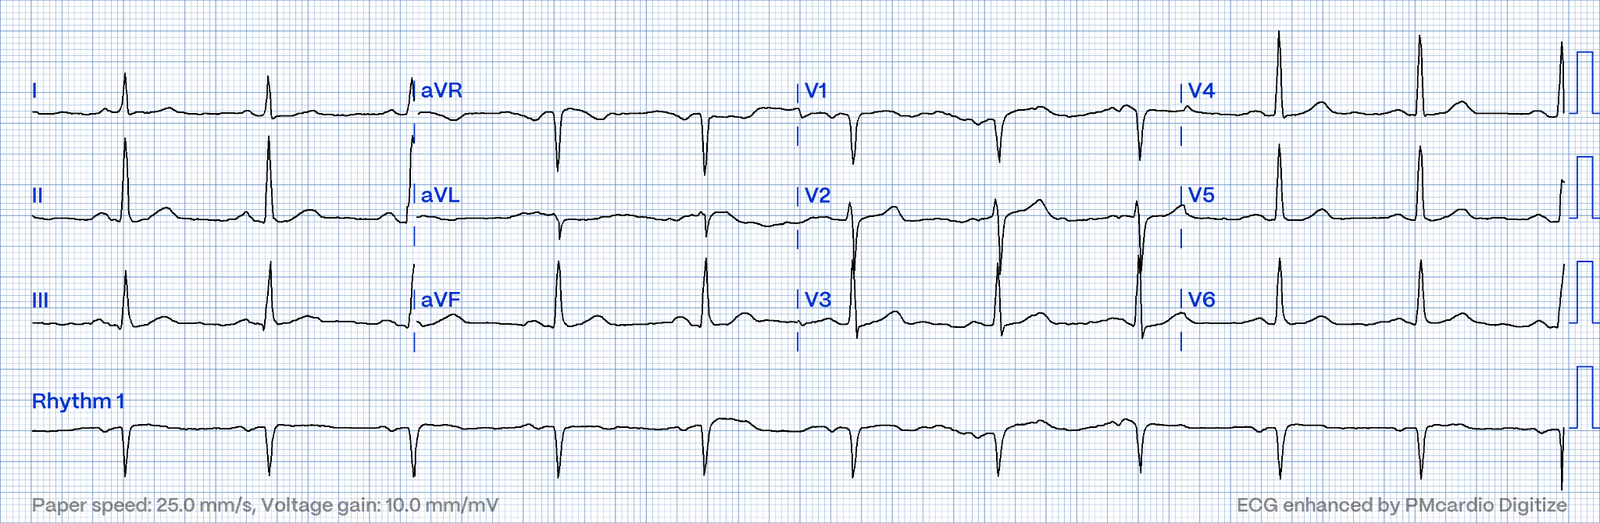
QUESTION #2: How short is the QTc?
= = =
= = =
ANSWER: The QTc is determined by taking the longest QT interval that you can confidently measure on the 12-lead ECG — and then correcting this QT interval for heart rate.
- With heart rates over 60/minute (if using the Bazett formula) — the QTc will be more than the QT interval that you measure.
- With slower heart rates (under 60/minute, if using the Bazett formula) — the QTc will be less than the QT interval that you measure.
Looking at the 12-lead tracing in Figure-2 — I thought the longest QT interval that I could clearly measure was in either lead V2 or V3. I measured 360 ms (thin vertical BLUE lines in V3 showing from where I measured). The R-R intervals both preceding and including this longest measured QT interval correspond to a heart rate of ~43/minute.
- MD CALC is a handy link that provides near instant correction of the measured QT according to heart rate — allowing you to calculate the QTc by any of the 4 most commonly used corrective formulas ( = Bazett — Fridericia — Framingham — Hodges).
A measured QT interval of 360 ms = 9 small boxes on ECG grid paper. Plugging in this number into MD CALC for a heart rate of 43/minute yields the following results for the QTc:
- Bazett formula QTc = 305 ms.
- Fridericia formula QTc = 322 ms.
- Framingham formula QTc = 299 ms.
- Hodges formula QTc = 330 ms.
= = =
Conclusions:
- None of the formulas are perfect. Each has its advocates. There is some variation in QTc value determinations — but it’s clear in Figure-2 that the QTc is very short.
- Because the heart rate is so slow — the QTc turns out to be significantly less than the longest measured QT interval (which was 360 ms).
= = =
QUESTION #3: What is the “Short QT Syndrome” ?
= = =
= = =
ANSWER: A nice review by Rudic et al of Short QT Syndrome (SQTS) appears in Arrhythm Electrophysiol Rev 3(2):76-79, 2014.
- As emphasized in this article — SQTS is an inherited cardiac channelopathy determined by the presence of symptoms (syncope, cardiac arrest), positive family history, and the ECG finding of an abnormally short QTc interval.
- SQTS is a relatively new diagnosis that has only been recognized as a distinct clinical entity since 2000. The disorder is rare — but its importance is as a potential cause of atrial and ventricular arrhythmias, including cardiac arrest. Treatment is by ICD (implantable cardioverter defibrillator).
- Males with a QTc ≤330 ms — and females with a QTc ≤340 ms are defined as having SQTS, even if they are asymptomatic.
- Males with a QTc ≤360 ms — and females with a QTc ≤370 ms are said to have a “short” QTc. Such patients may have SQTS if, in addition to the “short” QTc there is a history of cardiac arrest, unexplained syncope or atrial fibrillation at an early age.
= = =
QUESTION #4: What are the ECG features of “Short QT Syndrome” ?
= = =
= = =
ANSWER: A series of gene mutations have been described in association with SQTS (See link to the above article by Rudic et al). By definition — these gene mutations are all associated with a short QTc interval, as defined above in answer to Question #3.
- Sometimes, the only ECG abnormality is an overly short QTc interval.
- BUT — some patients with SQTS manifest specific ECG patterns. One of these patterns consists of T waves that are tall, peaked, symmetrical and narrow-based with a morphology that is completely consistent with the T waves in Figure-2 (especially the T waves in leads V2, V3 and V4).
- U waves are often prominent with SQTS (This is best seen in lead V2 of Figure-2).
- Sometimes the ST segment is absent (ie, the QRS complex may seem to immediately follow the T wave). This was not the case in Figure-2 — as a short ST segment is present here.
= = =
BOTTOM LINE:
This tragic case of a young man critically ill with a gunshot wound to the head provides us with the fascinating ECG shown in Figure-1.
P.S. — It is easy to overlook a short QTc. Don’t forget to look for this in patients with syncope, cardiac arrest and/or unexplained arrhythmias.
- The principal findings of exceedingly tall, peaked and pointed T waves with narrow base + an exceedingly short QTc were not explained by either hyperkalemia or hypercalcemia — as both electrolytes were within the normal range.
- CNS catastrophes (as in the case of this comatose patient) — typically present with marked QTc prolongation — and morphologically, with broad T waves that fan out to a broad base. If anything — bradycardia should further prolong the QT. Other than this bradycardia, one would not expect the ECG findings seen here with coma from CNS trauma.
- I learned from this case that the T wave morphology seen in Figure-1 is perfectly consistent with one of the ECG patterns of SQTS, in this patient with a markedly shortened QTc (See Figure-1 in the above referenced review by Rudic et al).
- As per Dr. Meyers (and in the absence of a prior ECG for comparison) — we can strongly suspect that the ECG of this patient incidentally revealed a previously undetected congenital SQTS.
- P.S. — It is easy to overlook a short QTc. Don’t forget to look for this in patients with syncope, cardiac arrest and/or unexplained arrhythmias.
= = =
= = =
= = =
= = =