A middle-aged male presented with acute chest pain:
 |
| There is sinus rhythm. There is LVH by voltage in aVL, with what may appear to be secondary repolarization abnormalities (so-called “LVH with strain”, but this is a misnomer because it implies ischemia. “LVH with secondary repolarization abnormalities” is more appropriate). It has the “hockey stick” morphology typical of LVH with secondary repolarization abnormalities. What do you think? |
Here is the ECG of another middle-aged male with acute chest pain:
 |
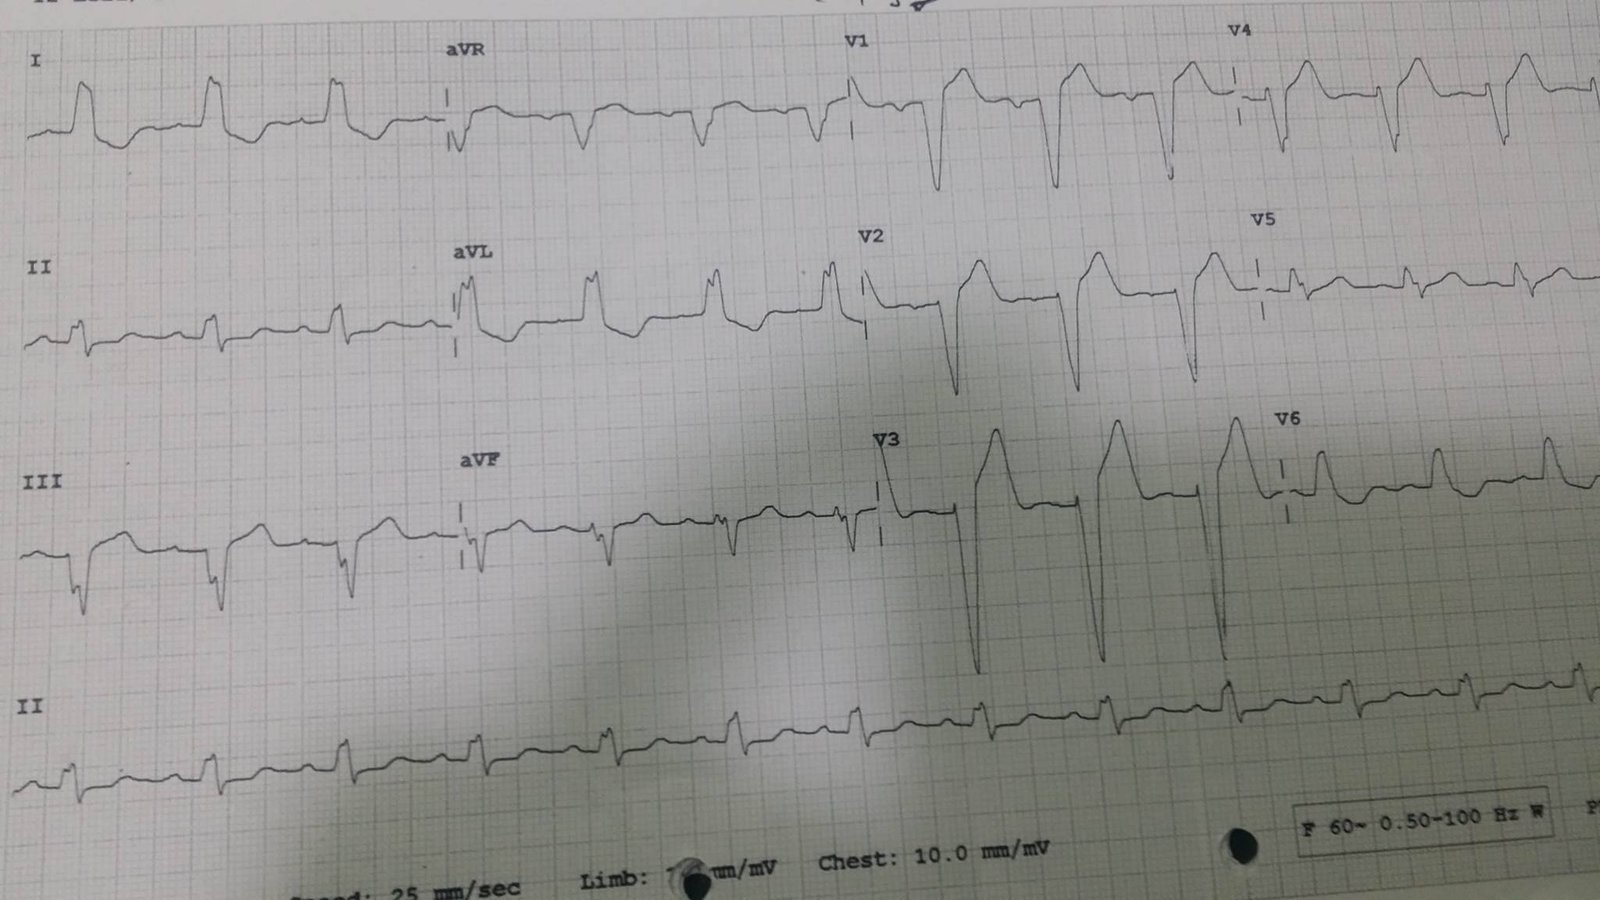
| It is similar, but notice how the T-waves are not nearly as proportionately large as in the above ECG.
What do you think? |
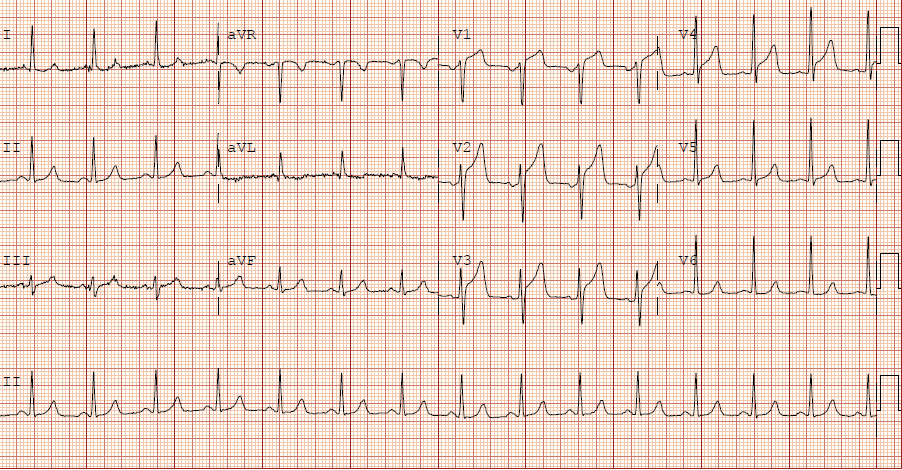
The bottom ECG is that patient’s baseline LVH.
The top ECG is LVH with superimposed inferior acute MI. The T-waves (both upright and negative ones) are far too large in proportion to the QRS. There is also a concordant T-wave in lead II, and ischemic appearing biphasic T-waves in V4-V6, with a flattened ST segment in V3, all suggesting posterior and lateral involvement.
Notice also the ischemic biphasic T-waves in V4 and V5.
Technically, it is not “STEMI” because the ST elevation at the J-point is less than 1 mm.
But it is an OMI!!
This (top) ECG was missed by several interpreters and the patient had very delayed reperfusion therapy.
The culprit was 100 % thrombotic occlusion of the mid RCA. The peak troponin I was 47 ng/ml (very high). There was a regional wall motion abnormality in the inferior and posterior walls. The LAD was not involved.
The patient was discharged with a diagnosis of NonSTEMI.
There actually was a previous ECG for comparison, which proves the point. Here it is:
 |
| Very different from LVH with superimposed inferior STEMI. |
Here is the post-PCI ECG:
 |
| Notice inferior reperfusion (inverted) T-waves Notice precordial large T-waves (posterior reperfusion T-waves) Notice lateral reperfusion T-waves. These are “Wellens’ waves” of inferior, posterior, and lateral walls. |
Learning point
Know the T-wave to QRS proportions in LVH vs. LVH with superimposed MI.