Posterior Reperfusion T-waves have never been described in the literature, until now. Dr. Brian Driver and Dr. Gautam Shroff have joined me in formally studying this and we show that this is a real phenomenon.
Here is the article (full text):
Posterior reperfusion T-waves: Wellens’ syndrome of the posterior wall
Here I provide 2 examples. Here are many other examples.
Case 1
ECGs of a patient with proven reperfused isolated posterior MI during pain and then 120 minutes later, after resolution of pain.
Elderly male who is perfectly healthy complained of chest pain on and off for 2 days, then much more severe just prior to evaluation.
Figure 1:
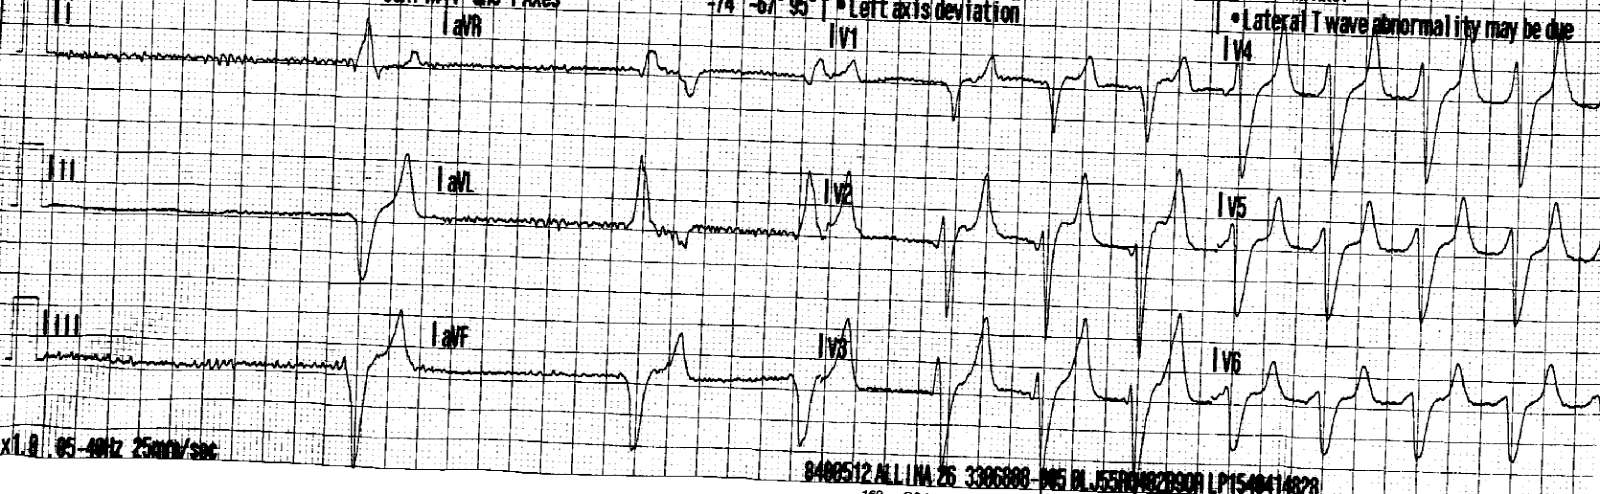
Figure 1a: ED ECG during pain.
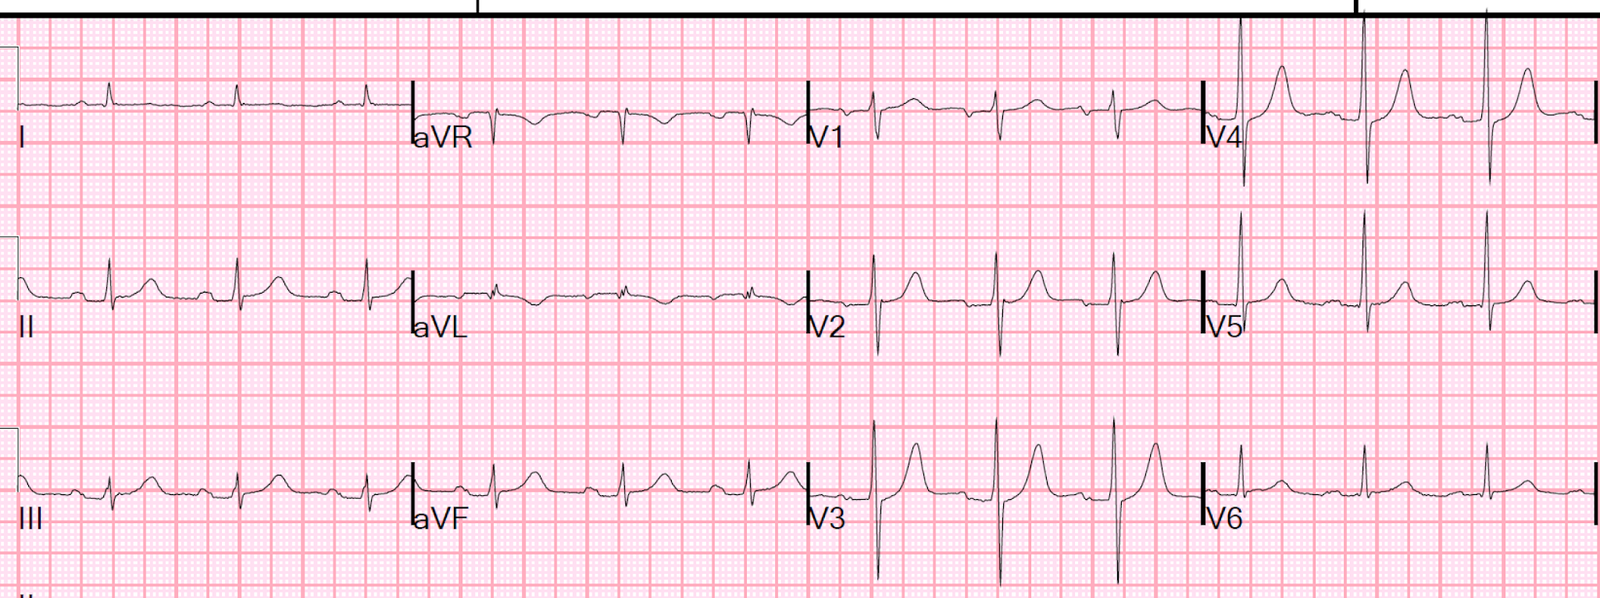 |
| The ST segments in right precordial leads are isoelectric and there is no definite evidence of acute infarction. |
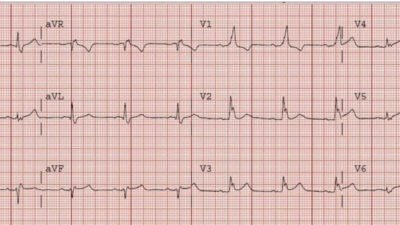
Figure 1b. 120 minutes later after pain resolution.
 |
| Relative to the presenting ECG, the ST segments are relatively slightly elevated and the T-wave has enlarged signficiantly. This was not recognized by the treating physicians. |
No one saw these ECG changes which signify that the first ECG was acute posterior MI and the second represents reperfusion of the infarct related vessel.
When I saw them in reviewing ECG, I immediately knew that he had a posterior MI.
Peak TnI 46
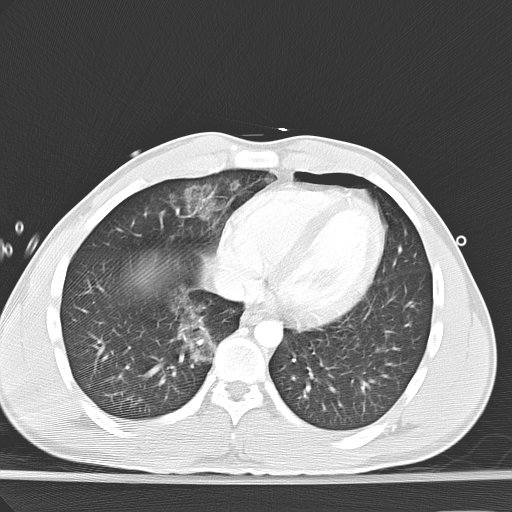
Nuclear scan: Severe intensity, large perfusion defect involving the
lateral wall consistent with myocardial infarction in that
distribution.
Echo: Regional wall motion abnormality-lateral
No angiogram due to clinical considerations.
Case 2
Figure 2a. A patient with stuttering chest pain presents pain free:
 |
| There is evidence of reperfused inferior and lateral MI, with T-wave inversion. There is minimal ST depression in V2 and V3 highly suspicious for posterior MI |
Figure 2b. Here is the previous ECG:
 |
| Previous ECG – Normal |
Figure 2c. The patient developed chest pressure again
 |
| There is pseudonormalization of inferior and lateral T-waves, with some new, minimal inferior ST elevation and reciprocal ST depression and T-wave inversion in aVL. This is diagnostic of coronary occlusion. |
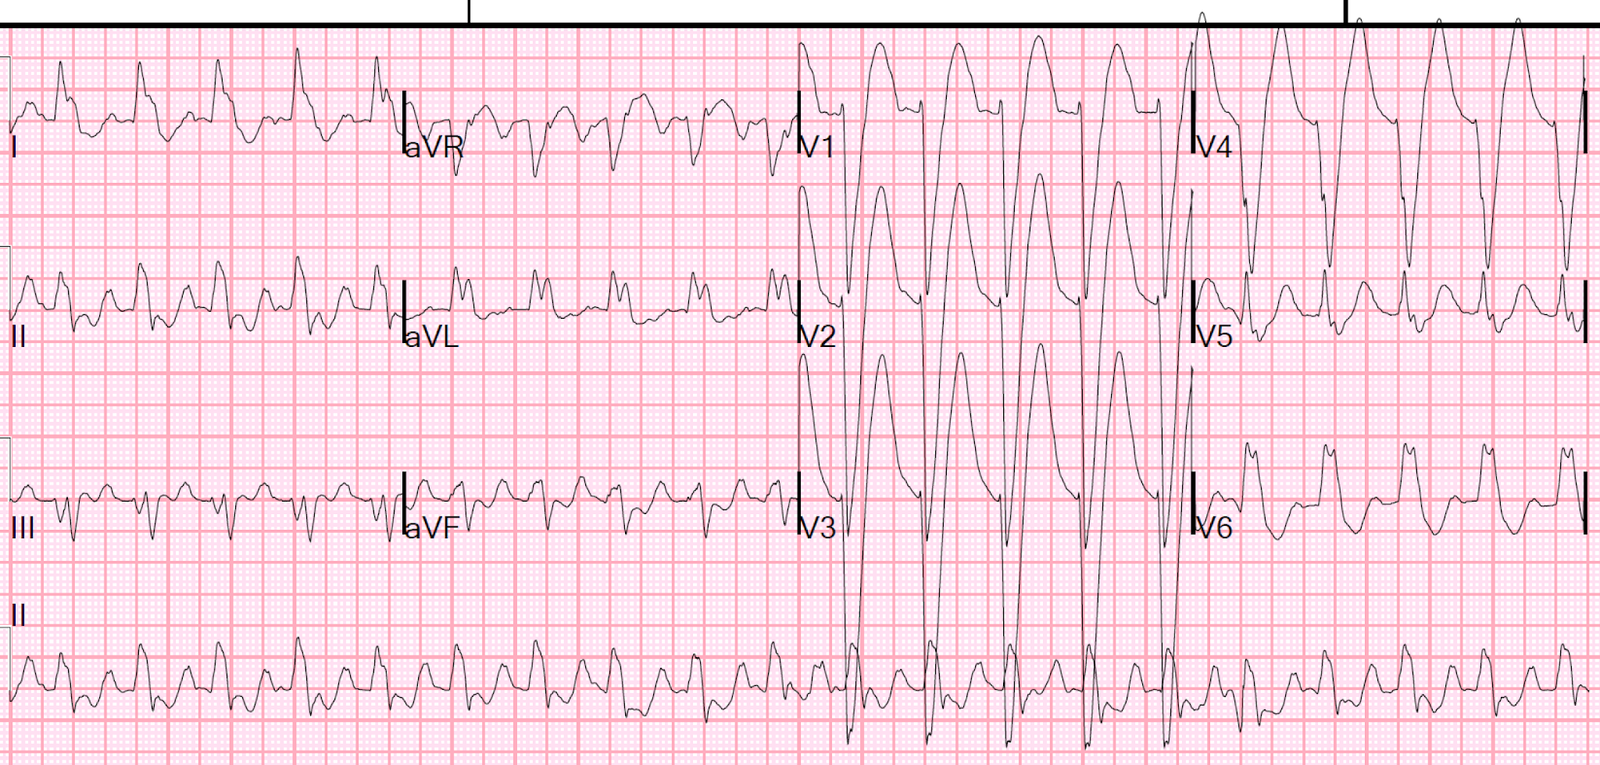
Figure 2d. I activated the cath lab and an occluded RCA was opened. Here is the ECG several hours after reperfusion:
 |
| There are inferior and lateral reperfusion T-waves (inverted). There are large right precordial “posterior reperfusion T-waves” in lead V2 |
Comment
If recorded on the posterior wall, the T-waves would be inverted, just like a posterior Wellens’ syndrome. However, they are recorded from anterior, and are added to the upright T-waves of the anterior wall, so they result in added voltage to the right precordial T-waves!
(+) T-wave in anterior wall.
Add the (-) the T-wave of the posterior wall. This T-wave is a negative of a negative, and therefore positive, so adds to the total voltage.
1st negative: recording the posterior wall from anterior
2nd negative: negative T-wave on the posterior wall.
Recording a negative of a negative gives a positive.