Written by Magnus Nossen.
This prehospital ECG was obtained form an elderly male with new onset chest pain. The pain was substernal 7/10, crushing in nature and radiating to the neck. He had a medical history significant for type II DM treated with insulin, DVT and abdominal surgery. How would you assess this ECG?
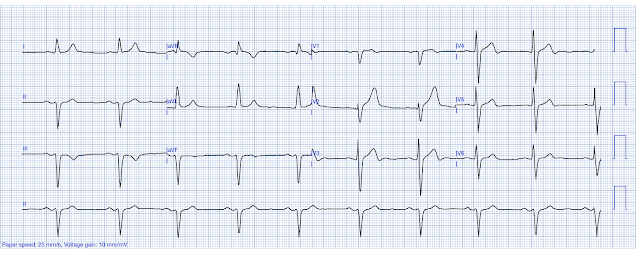
Prehospital ECG (ECG #1)

Interpretation: The ECG shows sinus rhythm with a heart rate of approximately 50 beats per minute. The QRS duration is 110 ms, and in lead I the QRS morphology, along with absent significant R waves in V1-V2, is consistent with incomplete left bundle branch block. There is minimal J-point elevation noted in the anterolateral and high-lateral leads. T waves in leads V3-V6 are notably hyperacute, with the most pronounced T wave changes seen in lead V5. These subtle ECG changes were not noticed or commented on by providers.
The patient arrived in the emergency department with ongoing chest pain unresponsive to morphine and nitroglycerin. Initial high-sensitivity troponin I was mildly elevated at 35 ng/L (reference <34 ng/L). A repeat troponin I, drawn 3 hours later, showed a marked increase to 592 ng/L. The subsequent ECG was recorded after this second troponin result, though it is unclear if chest pain persisted at that time.
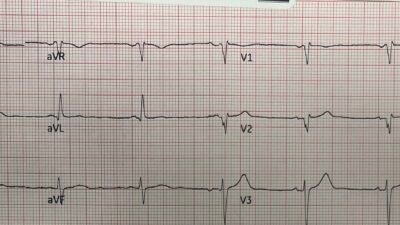
Repeat ECG done in the ED (ECG #2)

This ECG has some baseline wander, but essentially it shows the same findings as the initial one, strongly suggesting the patient likely remained symptomatic at the time this ECG was recorded. There are no clear signs of reperfusion.
Despite the rising troponin levels (and probable ongoing chest pain), the patient was not taken to the catheterization lab — but was admitted to the hospital instead. Troponin I levels increased to 23,076 ng/L overnight, and rose further to 35,906 ng/L in the morning. Both ECGs in this case independently meet criteria for diagnosing occlusion myocardial infarction (OMI). Additionally, comparison with a previous baseline ECG, which was available for this patient, makes the changes even more evident.
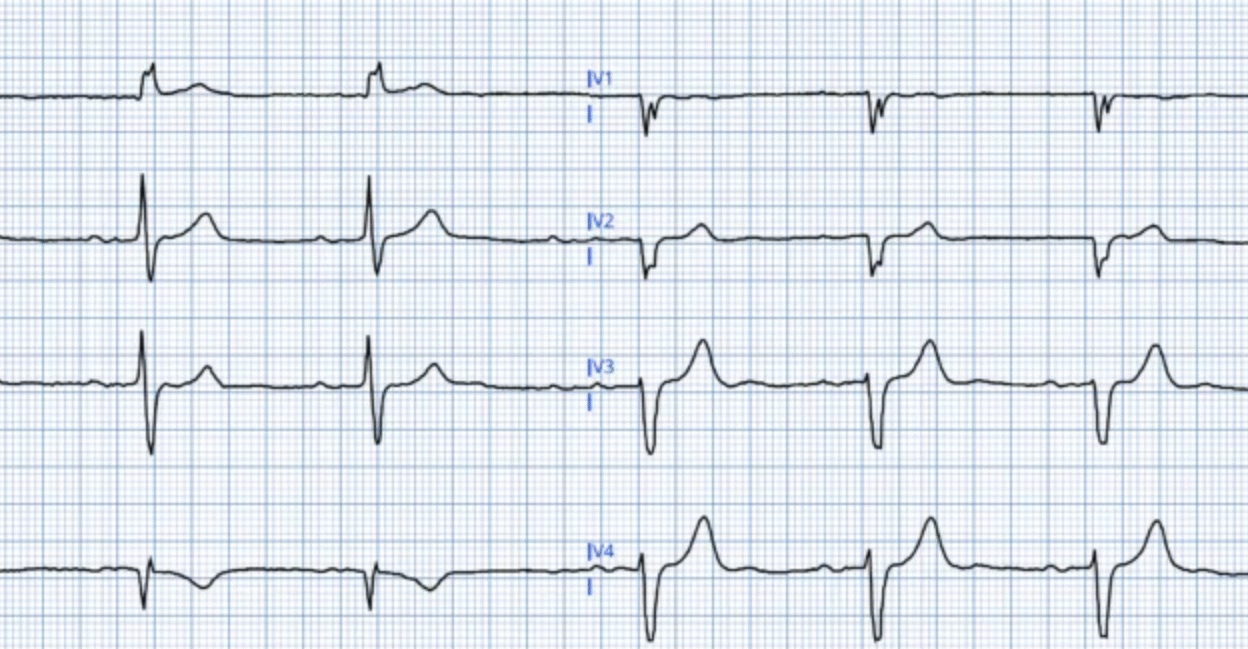
In the image below, selected leads from the prehospital ECG are compared with baseline. The change from prior can only be caused by ischemia.

Notice the concordant T wave in lead I, and the hyperacute T waves in leads V5 and V6 in the prehospital ECG when compared to baseline.
The Queen of hearts was not used in the patient management in this case. Had this AI model been used, she would have identified the occlusion myocardial infarction. See the below image for the QoH interpretation with explainability map for the initial ECG in today’s case.
QoH with explainability for ECG #1

New PMcardio for Individuals App 3.0 now includes the latest Queen of Hearts model and AI explainability (blue heatmaps)! Download now for iOS or Android. https://www.powerfulmedical.com/pmcardio-individuals/
As you can see, the AI model highlights subtle concordant ST segment convexity in lead I — as well as hyperacute, prominent T waves in the lateral chest leads. Additionally, there is an inappropriately isoelectric ST segment in lead III — where one would typically expect slight ST elevation given the marked S wave. This is likely noticed by the AI model, but does not meet the criteria for being reported in the explainability map. Collectively, these features are diagnostic for occlusion myocardial infarction (OMI).
How certain can you be that this ECG represents OMI?
I was sent this ECG by my colleague Dr. Vinje without clinical information. My response was, “OMI until proven otherwise”. Which was his impression as well. With practice — OMI findings can be recognized. How sure can you be that this patient is having an occluded coronary artery? I felt pretty confident.
The Queen of Hearts AI model classified this ECG as a STEMI-equivalent (OMI). As shown in the image below, the model outputs a value of 0.981 for active OMI, which is very close to the maximum score of 1.0. According to Dr. Meyers, based on the training data — this corresponds to a specificity of approximately 99-99,5%
Queen’s Interpretation of ECG #1
(This model is not available to the public)

The AI model is very certain this ECG represents acute coronary occlusion, assigning a score very close to 1.0 (the maximal score). There are no features suggestive of reperfusion, as reflected by the very low score in the ‘Reperfused OMI’ category. Additionally, the score for subendocardial ischemia (SEI) is even lower, further supporting the diagnosis of active transmural ischemia.
Below is the QoH estimation for culprit vessel. As you can the AI models indicates that the LAD is the most likely vessel involved (with the RCA being the least likely culprit artery).

Discussion
This 87-year-old man was ultimately referred for coronary angiography. During the procedure, a 100% occlusion of the first diagonal branch (D1) was identified and successfully stented. The rest of the voronary arteries only showed mild atheromatosis without any significant obstructive lesions. The angiogram took place more than 24 hours after symptom onset. Opening a coronary artery that has been occluded fully occluded for more than 24 hours provides little if any prognostic benefit.
The first diagonal branch supplies the anterolateral wall of the left ventricle. This anterolateral territory supplied by D1 lies “between” the regions supplied by the LAD and the circumflex artery, which is reflected in the AI’s predicted likely culprit — the LAD first, followed by the LCx.
Learning points
- Smith: When you have a diagnostic ECG, DO NOT WAIT FOR TROPONIN. MYOCARDIUM IS DYING!! USE THE QUEEN OF HEARTS!
- Smith: this patient’s pretest probability (new crushing chest pain in an 87 year old?!) is so high that you should activate no matter what the ECG shows
- A patient with rising troponin and ongoing refractory chest pain needs to go to the cath lab as OMI will be the most likely diagnosis.
- Comparison to a baseline ECG should be done when available.
- “Subtle” ECG changes are often diagnostic. Even in the case of minor changes as in today’s case, the Queen of Hearts identified active OMI with an impressively high specificity.
======================================
MY Comment, by KEN GRAUER, MD (7/30/2025):
Today’s case by Dr. Nossen is of an older man who presented with severe new-onset CP (Chest Pain). Unfortunately — a series of subtle-but-acute ECG abnormalities were not recognized by health care providers on either the initial EMS ECG — nor on the repeat ECG that was done ~3 hours later in the ED.
- I focus My Comment on a number of important ECG findings that were overlooked on both tracings.
==================================
Why is the Initial EMS ECG Diagnostic of Acute OMI?
KEY Point: The history in today’s case cannot be ignored: The patient is an elderly man with risk factors who contacted EMS for, “crushing substernal CP, radiating to the neck — with a severity rating of 7/10″. This history automatically places today’s patient in a higher-risk group for having an acute cardiac event (meaning that any potentially acute ECG findings should be accepted as indicating an acute OMI until proven otherwise).
- The rhythm in Figure-1 is sinus bradycardia — with slight QRS widening to 0.11 second. QRS morphology in lead I looks like LBBB (Left Bundle Branch Block) — except that the QRS complex is not wide enough to qualify for this conduction defect (ie, Complete LBBB should manifest a QRS duration of at least 0.12 second).
- Regardless of whether today’s ECG qualifies as “incomplete” LBBB — or is better referred to as a nonspecific IVCD (IntraVentricular Conduction Defect) — my “eye” was immediately drawn to lead aVL because of the coved ST elevation with terminal T wave inversion in this lead. In addition — the initial Q wave in lead aVL is clearly too wide to be a normal septal q wave (and if this conduction defect does represent incomplete LBBB — then no Q wave at all should be seen in lateral leads!).
- BOTTOM Line: Even if nothing else of note was seen on ECG #1 — in this older man with severe, crushing CP — I already knew that this initial EMS ECG has to be assumed to represent acute OMI until proven otherwise.
But there are multiple additional findings in ECG #1:
- Regardless of whether the upright, widened R wave in lead I is the result of incomplete LBBB or nonspecific IVCD — the ST-T wave in left-sided leads with QRS widening that resembles lbbb conduction should be oppositely directed (ie, negative) to the upright R wave. Instead, the upright T wave in lead I (BLUE arrow in this lead) conveys a similar clinical significance as the coved ST elevation in the other high-lateral lead ( = lead aVL).
- That these high-lateral lead acute ST-T wave changes in leads I and aVL are “real” — is supported by the abnormal ST segment straightening in 2 of the inferior leads ( = leads III and aVF).
- More obvious abnormalities are seen in the chest leads. As per Dr. Nossen — the most abnormal of the hyperacute T waves is seen in lead V5 (RED arrow in V5), where in addition to subtle ST elevation, the T wave is clearly disproportionately “bulky” considering modest amplitude of the R wave in this lead.
- By the principle of neighboring leads — Blue arrows in leads V3,V4 and V6 are all taller, “fatter-at-their-peak, and wider-at-their-base than expected (ie, hyperacute) given modest QRS amplitude in these leads.
- KEY Point: The above described ST-T wave findings in leads I, III and aVF are admittedly subtle. But the abnormal coved ST elevation with terminal T wave inversion in lead aVL — and the hyperacute T waves in lead V5, and by extension (neighboring leads) in leads V3,V4 and V6 in this patient with severe, new-onset crushing CP have to be assumed indicative of acute OMI until proven otherwise.
Figure-1: I’ve labeled the initial EMS ECG.

==================================
What is Incomplete LBBB?
Beyond-the-Core — I have studied the concept of incomplete LBBB for decades. Whereas incomplete RBBB is a common and well-defined entity — incomplete LBBB is a rare, nebulous entity for the reasons I review below in Figure-2.
- The relevance of our consideration of incomplete LBBB as the reason for QRS widening in ECG #1 — is that like complete LBBB (in which the sequence of ventricular depolarization is altered due to this conduction defect) — the vector of ventricular repolarization with both complete and incomplete LBBB should be opposite the last QRS deflection in certain leads (which in lateral leads like lead I — is the upright R wave). It is for this reason that the upright T wave in lead I of ECG #1 is a primary ST-T wave change, that in a patient with new severe CP should be interpreted as an acute ischemic ECG change.
- P.S.: This is an advanced concept … (and since the ST-T waves in leads aVL and V3-thru-V6 are clearly abnormal in ECG #1 — the diagnosis of acute OMI should be made in ECG #1 regardless of how you interpret the ST-T wave in lead I).
Figure-2: Does incomplete LBBB exist? (Figure excerpted from Grauer K — ECG Pocket Brain-EPub; KG/EKG Press, 2014).

Inappropriate Use of Morphine:
As we often emphasize in Dr. Smith’s ECG Blog — Morphine should not be given when considering the diagnosis of acute OMI until the decision is made to perform prompt cath. The reason for this word of caution is that analgesic relief of symptoms with morphine may further delay the decision to perform cardiac catheterization with needed PCI.
- Unfortunately in today’s case — Morphine failed to relieve this patient’s CP (which of itself, even without ECG changes — would be an indication for prompt cath given this patient’s worrisome history — not to mention the increasing Troponin values).
==================================
What Does ECG #2 Show?
The reason I ask the question as to, What does ECG #2 show? — Is that I am uncertain from the tracing in Figure-3 what the answer to this question is.
- ECG #2 (that I’ve reproduced in Figure-3) — consists of only 4 beats (ie, The same 4 beats are seen in all 12 leads). Awareness that only 4 beats are assessed in this tracing is relevant — because we have to ask which of the 4 complexes that I’ve labeled “A”, “B”, “C” and “D” is the real complex?
- Focus on ST-T wave appearance in leads V5 and V6 (within the RED rectangle). Isn’t the ST-T wave appearance changing for each of the QRS complexes in both of these leads?
- For example — IF complex “B” were to represent the “real” ST-T wave appearance in leads V5,V6 of ECG #2 — then we’d have to interpret this as a dynamic ST change compared to the ST-T waves in leads V5,V6 of ECG #1 that did not look nearly as acute.
- On the other hand — the ST-T waves in “C” and “D” of leads V5,V6 in ECG #2 look far less acute.
- Lesson-to-be-Learned: When the decision of whether (and if so, when) to perform cardiac catheterization hangs in the balance — if technical issues such as artifactual distortion produce confusion as to what the “real” ST-T wave appearance is — Repeat the ECG! (Don’t wait hours — as was done in this case — but instead, simply repeat the ECG with efforts as best is possible to minimize artifactual distortion on the repeat tracing.
Figure-3: I’ve labeled the repeat ECG (done in the ED — about 3 hours after ECG #1 was recorded).