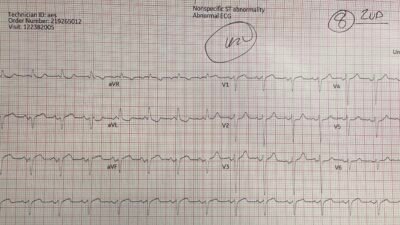
This ECG was texted to me: dyspnea and chest pain. O2 saturation 88%.
What was my response?
My response: “She has some sort of chronic hypoxia and pulmonary hypertension. Maybe a right to left shunt.”
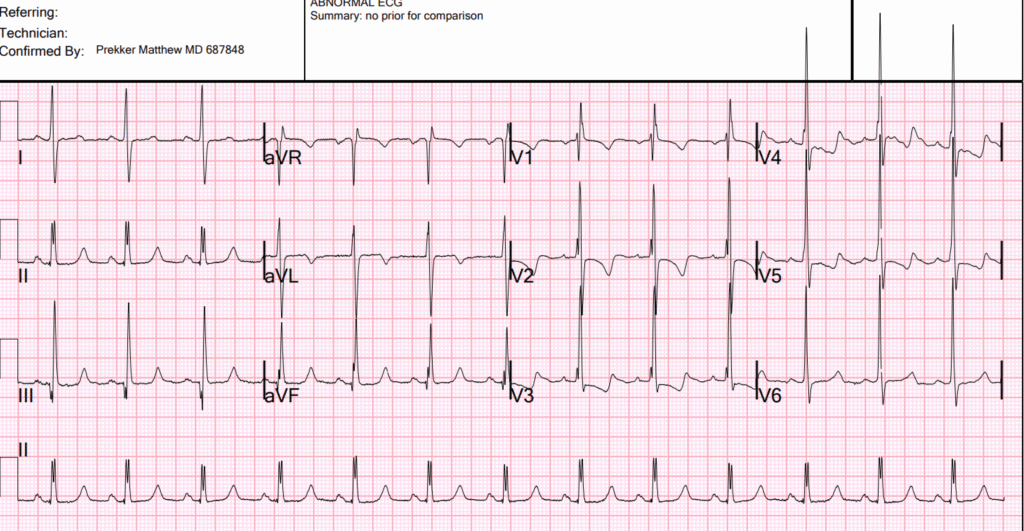
The ECG shows massive right ventricular hypertrophy. There is right axis deviation, large R-wave in V1, VERY large R-wave in V2-3, and very typical ST-T abnormalities of severe RVH. Therefore, the patient has pulmonary hypertension. She may have an anatomic right to left shunt, or she may have pulmonary vessel hypertension. There is no right bundle branch block!! (the clinicians interpreted RBBB) This is important, as, if this were RBBB, it would be much more difficult to differentiate the large R-wave is due to RVH from that of RBBB. It cannot be RBBB with QRS duration of < 120ms, although an interpretation of incomplete RBBB would be reasonable. It is exceedingly difficult to make the ECG diagnosis of RVH in the presence of RBBB.
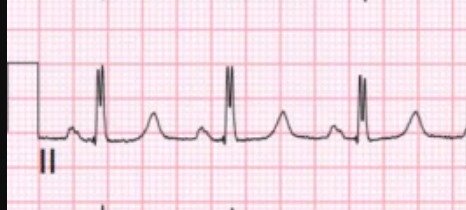
Moreover, there is double R-wave in lead II, which is called Crochetage sign, and is a sign of atrial septal defect:
The patient had been admitted to the hospital one month prior with hypoxia and Covid, but never had an ECG recorded. She did not carry a diagnosis of pulmonary hypertension. She did not have a bedside ED ultrasound.
On this previous visit, she did have several imaging studies as an inpatient.
On this previous visit, there was a CT pulmonary angiogram which was reported to show only “dilated pulmonary arteries suggestive of pulmonary hypertension.” You can see some images of this below which show much more than this description.
Fortunately, a pulmonary consult was done and they suspected Eisenmenger’s syndrome, and ordered a CT of the heart. This revealed the diagnosis of right to left shunt due to large ostium secundum atrial septal defect.
Here is her echocardiogram interpretation:
Limited study to assess for intracardiac right to left shunting. Contrast echocardiography was performed with the injection of agitated D50, with evidence for large intracardiac right to left shunting with normal breathing.
Right ventricular enlargement, marked. Decreased right ventricular systolic performance. The estimated PA systolic pressure is 70 mm Hg + RA. Evidence for significant intracardiac right to left shunting under current hemodynamic loading conditions (severe pulmonary hypertension)
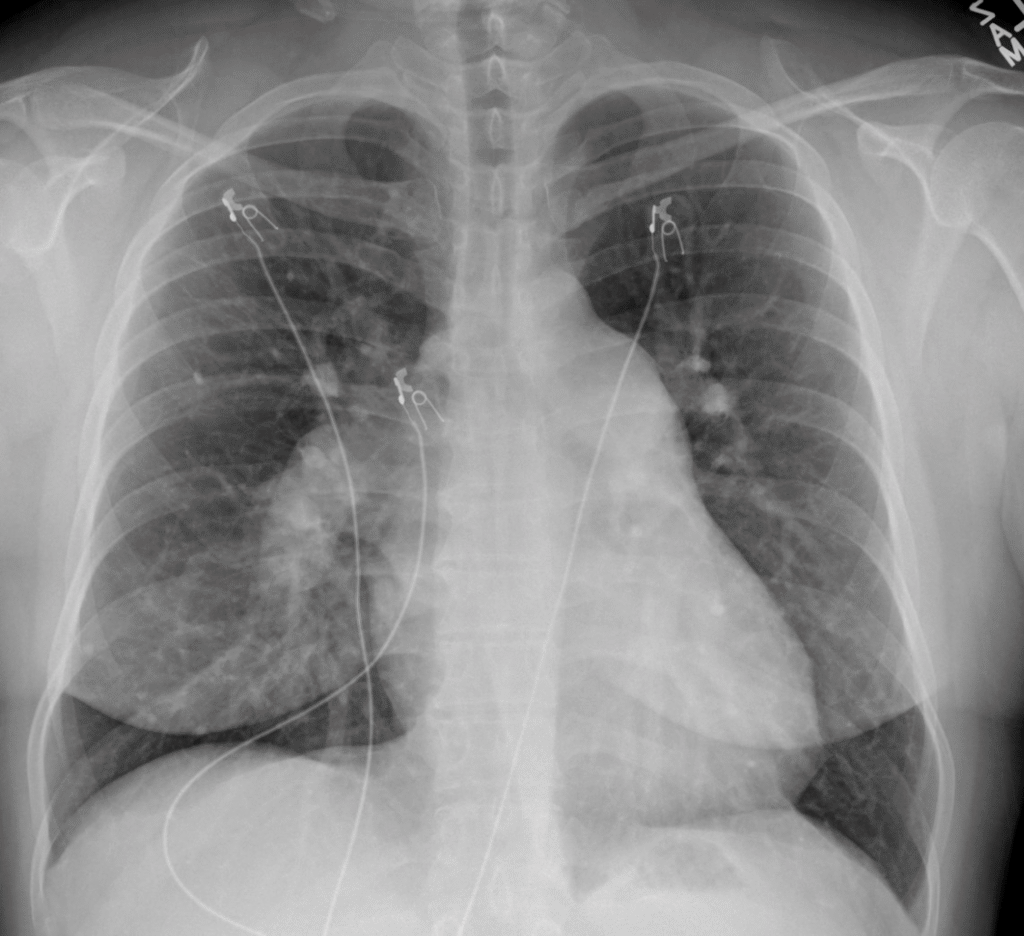
Here is the Chest X-ray (which looked the same during her covid admission, and should alert that covid is NOT the etiology of hypoxia, since there are no pulmonary infiltrates). Importantly, it shows a massive right pulmonary artery, and bulging of the mediastinum on the left, also due to enlarged left pulmonary artery. Less obvious, there is prominent right heart border:
Below are images from that heart CT done on the first presentation. First, the parenchyma did not have infiltrates but you can see HUGE pulmonary arteries (the two bilateral round densities posterior):
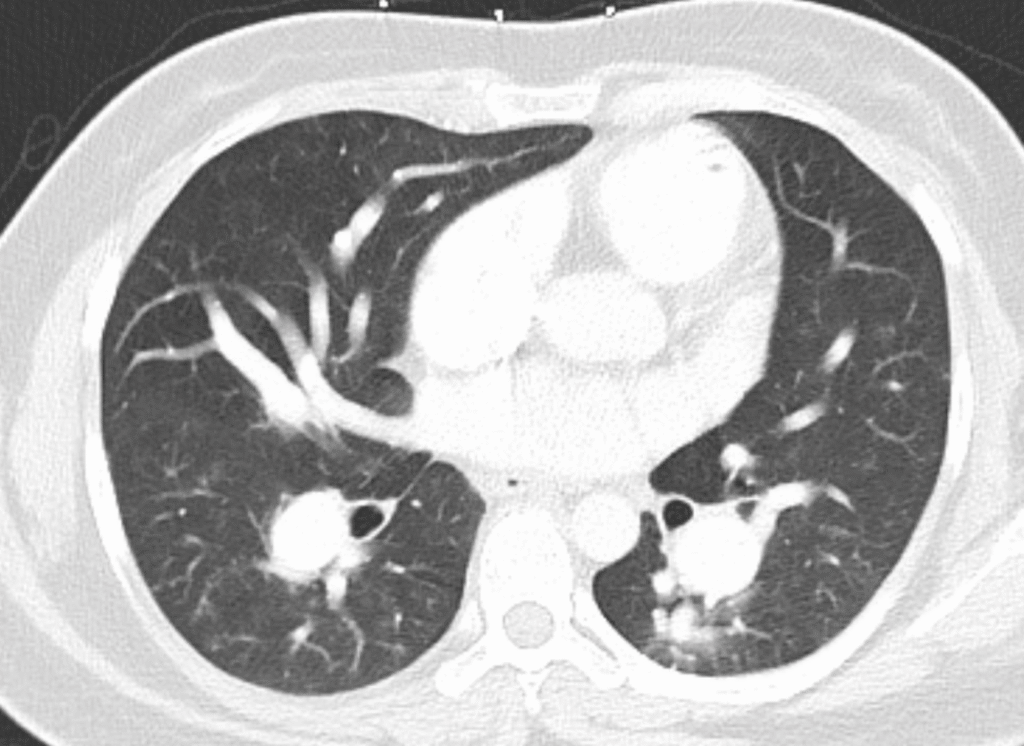
Here are the pulmonary artery trunks:
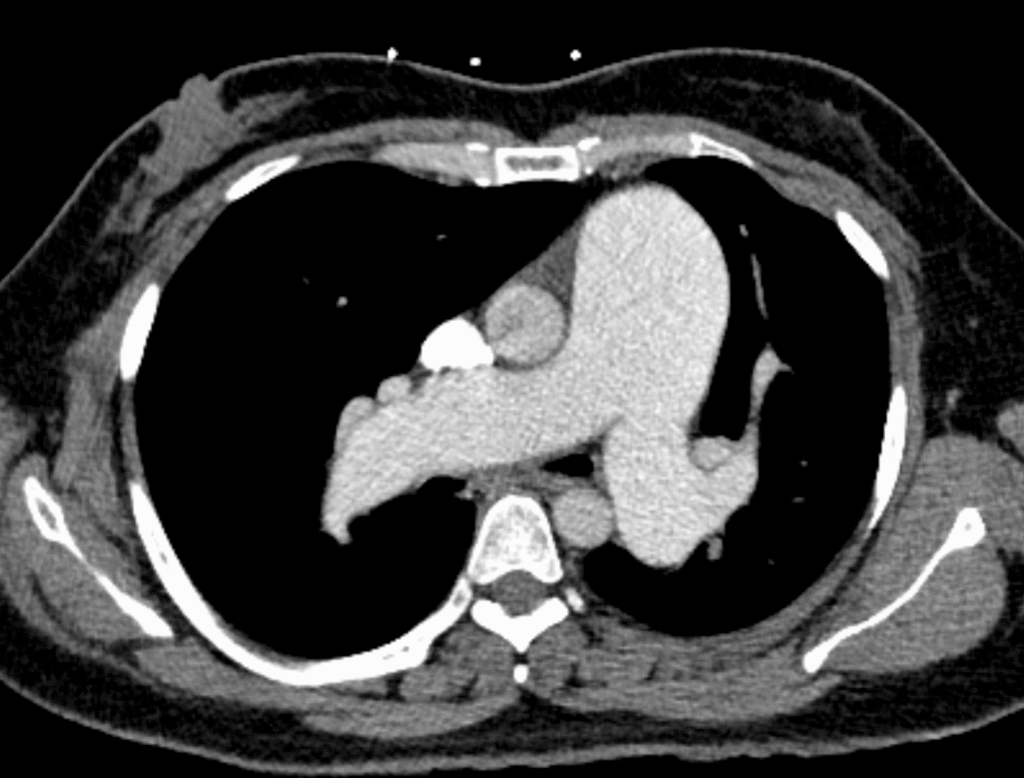
These are massive pulmonary arteries.
Cardiac CT coronary angiogram (below), with views of the massive RV (on top), both very enlarged and very hypertrophic:
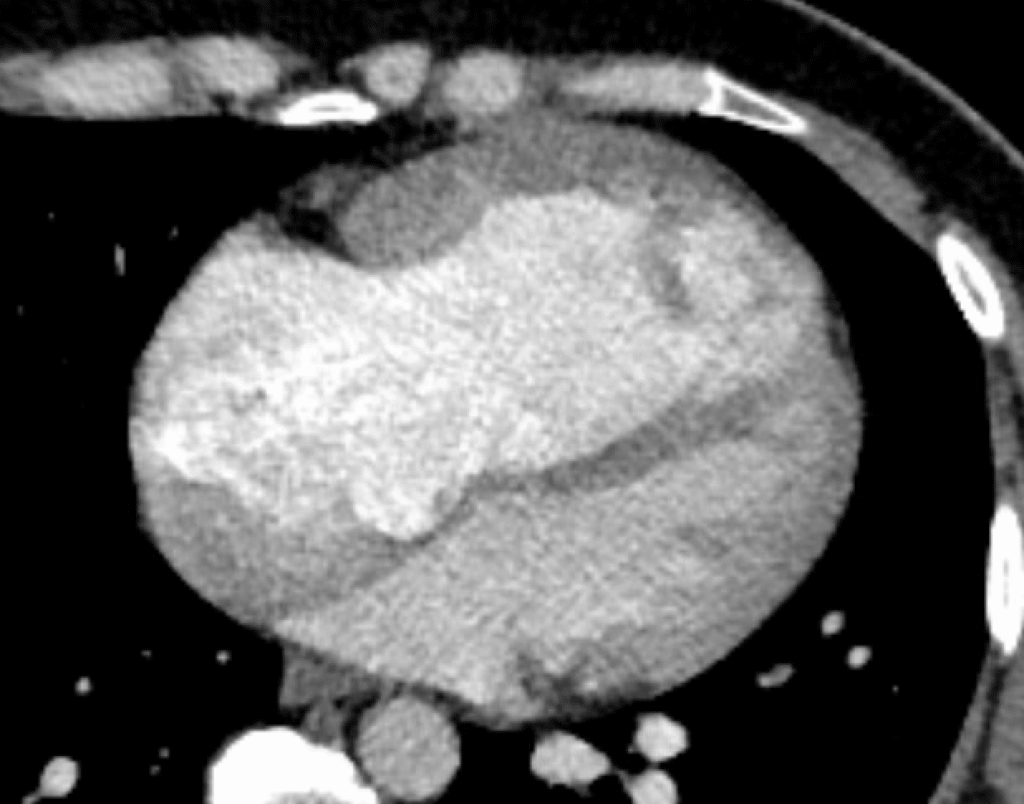
And of large ostium secundum defect (top of image, between the 2 atria):
And another:
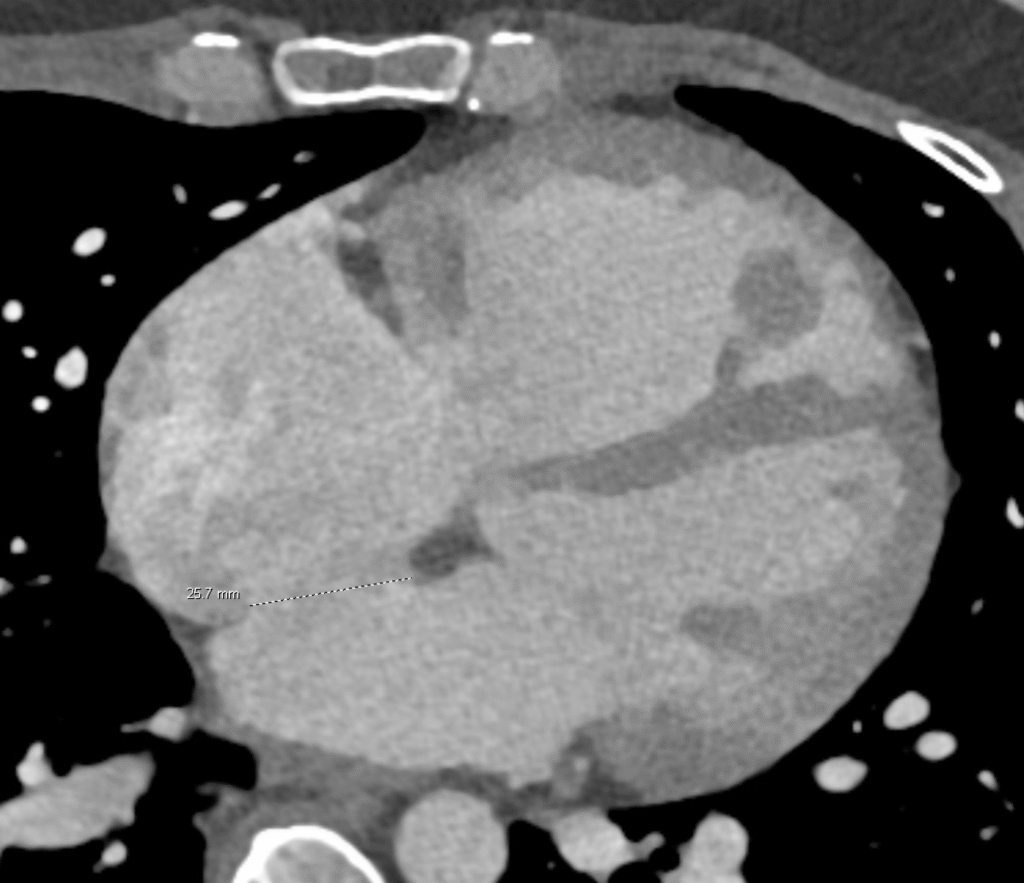
Again, between the 2 atria, but on the left side of the image
CT interpretation: Changes of pulmonary hypertension, with marked enlargement of the main pulmonary artery, marked enlargement of the right heart, and diffuse right ventricular hypertrophy. Septum is bowed to the left.
What’s the point? You can see all of this on the ECG. Yet these findings of RVH are almost always missed. I went to a lecture by the leading author for ED and ICU diagnosis of pulmonary hypertension. Every case she showed had an ECG which showed the RVH and she did not even know it until I pointed it out. She was glad for the education.
Here are many more cases of RVH. Learn this pattern!!
In particular, here are a couple cases of congenital RVH picked up after age 20:
Severe Right Ventricular Hypertrophy
21 year old woman with CP, SOB, then syncope, and with ST depression with T-wave inversion in V1-V3
Follow up
Provider note: “Patient with known Eisenmenger physiology secondary to congenital ASD presents with chest discomfort and exertional dyspnea. EKG demonstrates right atrial enlargement, complete right bundle branch block (NOT!!), and right ventricular hypertrophy, consistent with chronic pulmonary hypertension. Serial troponins are not suggestive of acute ischemia, and chest radiograph shows stable enlargement of the pulmonary arteries without acute findings. The 50-foot walk test revealed mild exertional desaturation (SpO₂ 89–94%) and labored breathing, consistent with baseline hypoxia. Differential diagnoses including acute coronary syndrome, pulmonary embolism, and pneumonia were considered but are unlikely. Symptoms are best explained by chronic Eisenmenger physiology and pulmonary hypertension. The hemoglobin was 17.6 (polycythemia due to chronic hypoxia).
Management of Eisenmenger’s syndrome is beyond the scope of this blog.
= = =
======================================
MY Comment, by KEN GRAUER, MD (11/6/2025):
The diagnosis of RVH (Right Ventricular Hypertrophy) on ECG is often elusive. This should not be surprising — because ventricular mass of the left ventricle in adults is normally so much greater than right ventricular mass, such that it takes a fairly dramatic increase in right ventricular forces for us to be able to see this effect on an ECG. As a result — RVH on ECG is not a common diagnosis (and when it occurs — clinicians not used to seeing RVH on ECG often fail to recognize it).
- The above said — recognition of RVH on ECG is often of critical importance because of the special therapeutic considerations essential for optimal management. This is especially important when RVH is severe and accompanied by significant pulmonary hypertension — as occurred in today’s case.
= = =
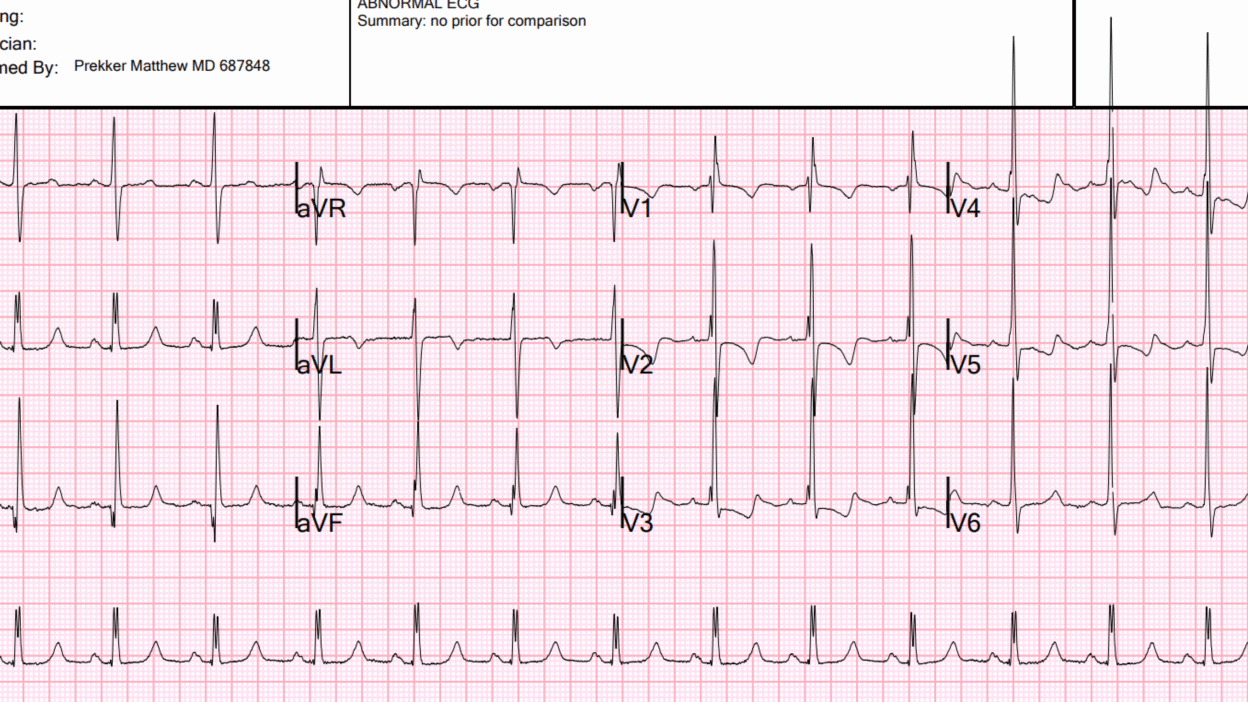
Today’s Initial ECG:
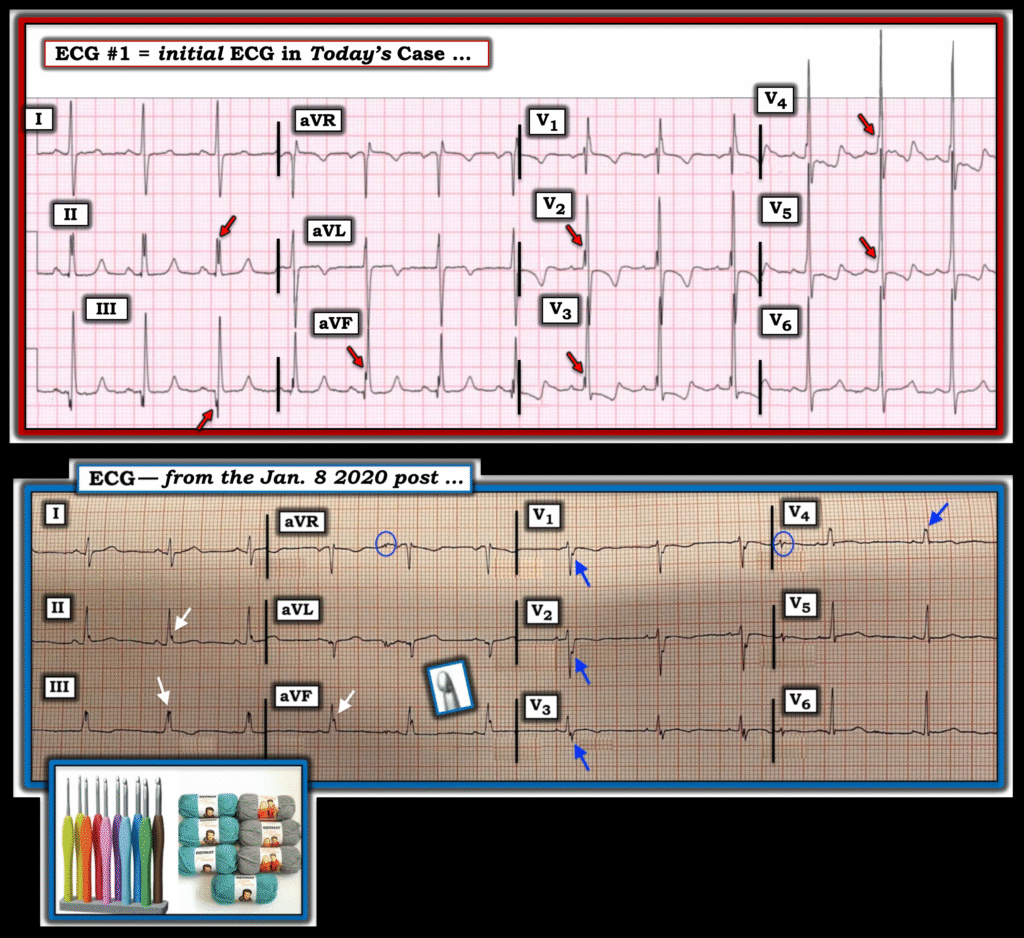
For clarity — I’ve reproduced today’s initial ECG in the TOP panel of Figure-1. This initial ECG was misdiagnosed as showing “complete” RBBB. As emphasized by Dr. Smith — complete RBBB is not present because the QRS is not wide. Instead — the rSR’ complex in right-sided lead V1, in association with narrow but deep terminal S waves in left-sided leads I and V6 that we see in Figure-1 is consisistent with incomplete RBBB.
- Dr. Smith emphasizes why distinction between complete vs incomplete RBBB is more than academic: It is because today’s initial ECG shows incomplete RBBB — that we can definitively diagnose RVH in this patient who presents with exertional dyspnea (whereas the ECG diagnosis of RVH would be much more difficult to make if complete RBBB was present).
- Incomplete RBBB as an isolated finding is rarely associated with an R’ deflection as tall as the 10 mm seen in lead V1 of ECG #1. Instead — this suggests RVH.
- Incomplete RBBB rarely produces an S wave as deep as the 10 mm seen in lead I. Instead — this suggests RVH.
- Isolated incomplete RBBB is not associated with RV “strain” (ie, The ST-T wave may be slightly negative in anterior leads with incomplete RBBB — but it should not be as deep and persistent through to lead V5, as we see in ECG #1). This suggests severe RVH, if not also significant pulmonary hypertension.
- KEY Point: The above findings that suggest RVH are all the more remarkable in ECG #1 — because this ECG also shows marked LVH (with R wave amplitude exceeding 25 mm in lateral chest leads V4,V5 and V6!) — which means that the above ECG findings of RVH are so marked as to be prominent despite significant opposing forces from coexisting LVH.
= = =
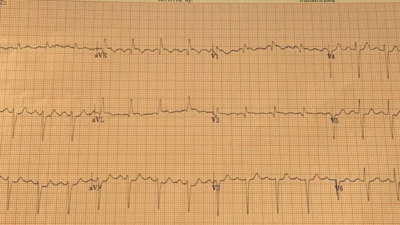
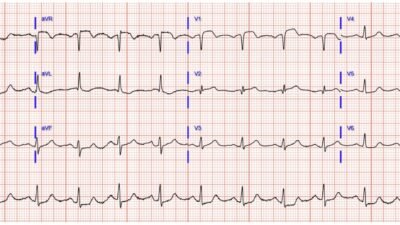
Figure-1: Comparison of today’s initial ECG — with the ECG from the January 8, 2020 post in Dr. Smith’s ECG Blog.
= = =
The Crochetage Sign:
Dr. Smith also highlights above the discussion and My Comment regarding the Crochetage Sign in the January 8, 2020 post of this ECG Blog — in which I trace the history and literature findings on clinical implications of this ECG sign.
- I’ve taken another look at the literature during the 5 years since I wrote My 2020 Comment — to which l’ll now add the following references in support of the points that I note below: Hazim et al: Cureus 15(10):e46498, 2023 — and — Zeman et al: JACC Case Reports 13, 2023 — and — Sarma: Indian J Crit Care Med 25(2):234,235, 2021.
- While the description regarding the Crochetage Sign still highlights the presence of a notch at the rising edge or peak of the R wave in one or more of the inferior leads — reference to the potential mechanism for this ECG sign is now made. The thought is that the Crochetage Sign is the result of delayed depolarization of the right ventricle in patients with an ASD (as the electrical impulse travels from the RV to the LV across the atrial septum).
- The points in the above 3 references again emphasize: i) That while sensitivity of the crochetage sign is not high for detection of a secundum ASD — the overall specificity of this sign is surprisingly good, especially when Crochetage is seen in all 3 inferior leads (albeit on occasion, Crochetage can be seen in other conditions, including PFO, VSD, pulmonary stenosis, pulmonary embolism, RVH, PDA); — ii) The presence of the Crochetage often correlates to the severity of the shunt; — iii) ECG signs of RVH may be seen — including one or more of the following: Right axis deviation, RAA, incomplete or complete RBBB, RV “strain”, tall R wave in lead V1; — iv) The Crochetage Sign often decreases in size or disappears following surgical correction of the congenital defect; — and, v) When the crochetage sign occurs in association with RBBB — the notching will often be seen in the latter portion of the QRS (rather than in the rising edge of the R wave).
My Observation regarding the Crochetage Sign:
- Although the literature I have seen on the Crochetage Sign seems to limit the appearance of this sign to the inferior leads — both in the example we published in the January 8, 2020 post (that I’ve reproduced in the BOTTOM panel in Figure-1) — as well as in illustrations in the references that I have seen — often also show notching (ie, “crochetage”) in a number of other leads!
- For example in Figure-1 — BLUE arrows in the tracing from our January 8, 2020 post — and RED arrows in today’s initial tracing highlight notching or slurring at various points in the QRS complex in both of these patients, with today’s patient having a hemodynamically significant secundum ASD defect. I suspect the size and diffuseness of “crochetage” (notching) defects in multiple leads (especially when associated with incomplete or complete RBBB and other signs of RVH) often correlates to clinical severity of the secundum ASD defect.
= = =
= = =