Sent by Anonymous, written by Pendell Meyers
A man in his 60s developed sudden chest pain, dizziness, diaphoresis, and shortness of breath shortly before ED arrival.
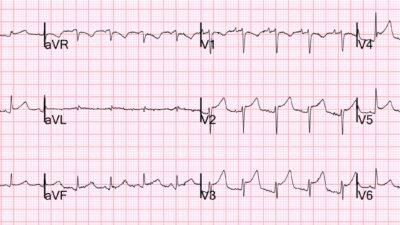
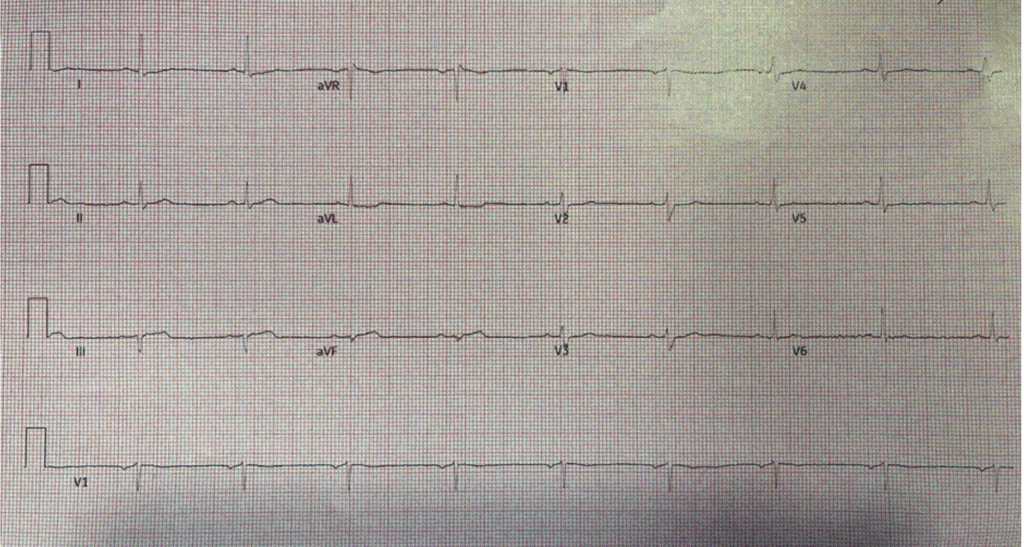
Triage ECG:
The patient had multiple risk factors and remote PCI.
This ECG was compared to prior (not shown) and demonstrated STE in III and aVF with reciprocal STD in aVL, disproportionally large, broad T hyperacute T waves (HATW) in III and aVF, and flattening ST segment in V2-V2 concerning for inferior and posterior OMI.
Smith: Notice that these hyperacute T-waves have an amplitude less than 2 mm!! That is because HATW are not defined by amplitude; they are defined by 1) AREA UNDER THE CURVE RELATIVE to QRS amplitude and 2) greater SYMMETRY. We just published the proof of our conception of HATW.
Smith: this is diagnostic of inferior/posterior OMI even though there is near zero ST Elevation. The ST segments are not depressed in V2-4, but they are isoelectric and very flat. ST segments in V2-3 should be elevated normally, which is why the STEMI criteria allow a LOT of STE in those leads. When they are isoelectric, there should be strong suspicion that they are RELATIVELY depressed.
We were unable to run the HATW algorithm on this ECG because the QRS amplitude in lead aVF is below the threshold for its use.
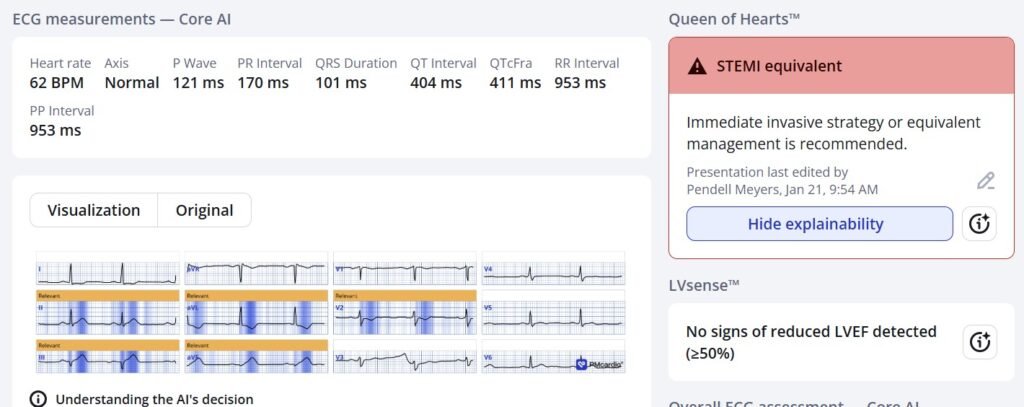
Here is the Queen of Hearts interpretation:
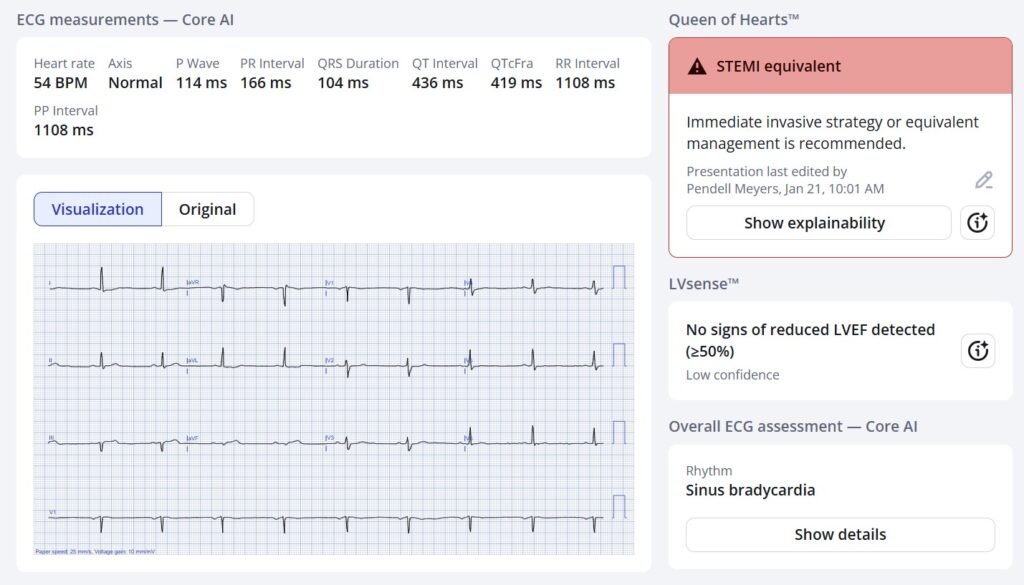
The numeric output was 0.99. That means that Queen is almost 100% certain that this is OMI. At a numeric value between 0.67 and 0.84, the specificity is 98%. The Queen of Hearts sees these Hyperacute T-waves.
New PMcardio for Individuals App 3.0 now includes the latest Queen of Hearts model and AI explainability (blue heatmaps)! Download now for iOS or Android. https://www.powerfulmedical.com/pmcardio-individuals/ (Drs. Smith and Meyers trained the AI Model and are shareholders in Powerful Medical). As a member of our community, you can use the code DRSMITH20 to get an exclusive 20% off your first year of the annual subscription. Disclaimer: Certain AI ECG Modules are CE-marked medical devices under EU MDR and are certified for marketing only in the European Union and the United Kingdom. PMcardio technology has not yet been cleared by the US Food and Drug Administration (FDA) for clinical use in the USA.
Case continued: The patient was referred to a neighboring PCI center though the cardiology team thought this did not meet activation criteria. Our interpretation was reiterated and we discussed that this did meet criteria based on the 2022 ACC Expert Consensus Decision Pathway (ECDP) for ED chest pain given the HATW.
The cardiologist again refused, and made it clear that the plan was to transfer the patient to the accepting hospital only in case his ECG “evolved to a STEMI”.
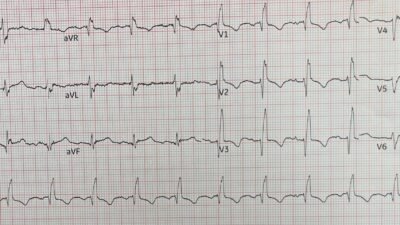
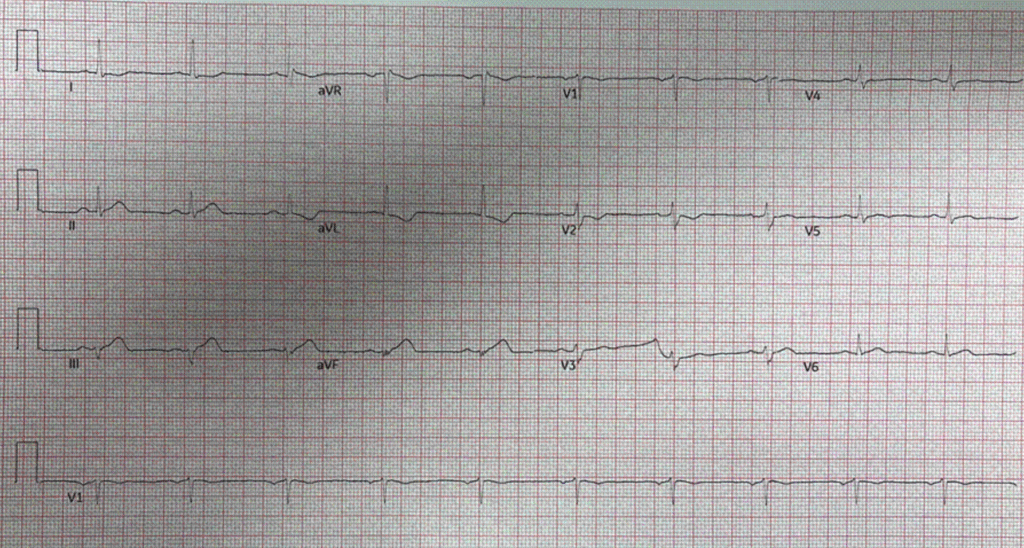
Soon a repeat ECG was completed 20 minutes later (below) showing the expected progression and this led to the patient being accepted for emergent PCI (despite still not actually meeting STEMI criteria).
Just as easy as ECG#1 for the QOH:
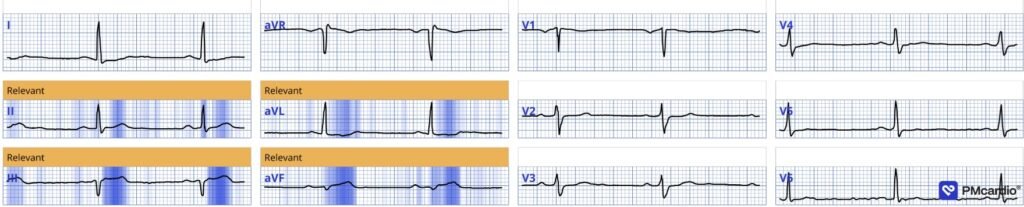
Below you can see our automated, objective HATW formula applied to the ECG, showing that leads II, III, and aVF all have objectively HATWs. Unfortunately lead aVF does not have QRS voltage sufficient to meet the inclusion criteria used in the original protocol, and thus the display system is programmed to not show the HATW numbers for that lead, but the T wave is obviously as hyperacute as lead III or even more so.
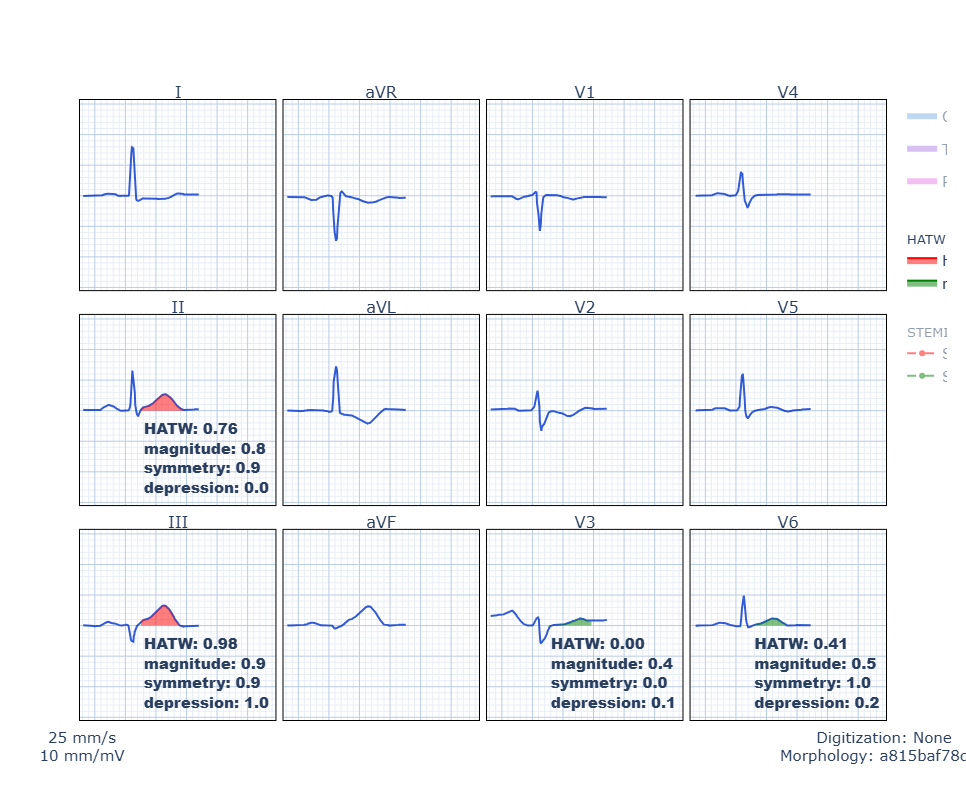
“Magnitude” is a measure of AUC/QRS. Symmetry is measure of J point to T wave peak compared to T wave peak to T wave end.
The angiogram revealed RCA occlusion and concomitant severe LCX stenosis, both of which underwent intervention.
No more follow up was available.
Summary:
This is a great case of how the Queen of Hearts app can help correctly identify subtle OMI findings. The triage ECG demonstrated HATW in III and aVF with a downscoping ST segment in the reciprocal aVL. Additionally, V2-V3 showed a flatter ST segment which was more noticeable on the repeat and fits with the acute RCA occlusion.
= = =
======================================
MY Comment, by KEN GRAUER, MD (1/26/2026):
“Shape more than Amount!” That’s the theme for today’s case. It is because the cardiology team ignored this basic tenet of ECG interpretation — that cardiac cath was delayed.
- Fortunately for the patient — the delay that resulted because the cardiology team felt, “The initial ECG does not meet STEMI criteria” was only 20 minutes.
- But unfortunately for the patient — during this 20-minute delay, there was significant progression of the infarct (the repeat ECG now showing obvious acute changes).
- KEY Point: As per Drs. Meyers and Smith, this case provides an insightful example of how tiny T waves can be — yet still qualify for being hyperacute!
= = =
Why is Voltage So Low?
It’s important to be aware of WHY voltage is so low in working through today’s case. This is because many of the common causes of Low Voltage may be consistent with this patient’s presenting symptoms (which were sudden onset of chest pain — dizziness — and shortness of breath).
- Especially relevant to today’s final diagnosis (which was acute RCA occlusion in a patient with multi-vessel disease) — is myocardial “stunning” from a large acute infarction.
- It is for this reason that we’ve made review of the Causes of Low Voltage readily available from the TOP Menu of every page in Dr. Smith’s ECG Blog (CLICK HERE — with illustration how to find this link at the bottom of the page).
===
Voltage is Small — but acute OMI should be Obvious!
The 3 most important factors in real estate are:
- #1) Location;
- #2) Location;
- #3) Location.
- #2) Location;
= = =
For ECG interpretation of acute OMI — My List of the 3 KEY factors is:
- #1) Clinical Context;
- #2) Shape;
- #3) Proportionality.
- — NOTE: “Size” is not in my Top 3 …
- #3) Proportionality.
- #2) Shape;
= = =
To examine the role of My KEY Factors with respect to today’s case — Consider the following:
- Clinical Context: Today’s patient is a man in his 60s with known coronary disease (with remote PCI) — who now presents for new-onset CP (Chest Pain) — that occurred in association with dizziness, diaphoresis and shortness of breath. This patient’s age and clinical history immediately place him in a higher-risk group for having an acute cardiac event.
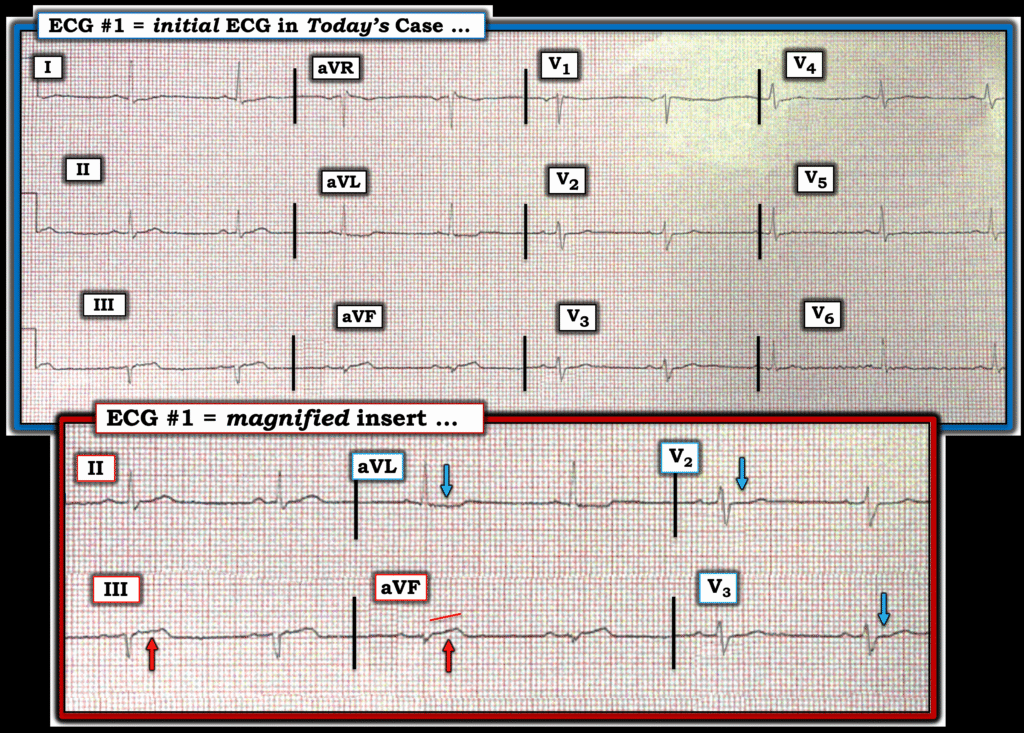
Now consider Figure-1 — in which I’ve reproduced this patients initial ECG (together with a magnified insert of the KEY leads).
- The rhythm in Figure-1 is sinus bradycardia at ~55/minute. Intervals (PR-QRS-QTc) are normal. The frontal plane axis is slightly leftward — but not enough to qualify as LAHB. There is no chamber enlargement.
- The Shape of the ST segment takeoff in leads III and aVF is clearly abnormal (straightened).
- Although the actual amount of ST elevation in leads III and aVF is very small — by the principle of Proportionality — the ST-T waves in both of these leads are clearly hyperacute (much “bulkier” and wider-at-their-base than expected given tiny size of the QRS in these leads).
- In this 60s man with new CP — confirmation that these ST-T waves in leads III and aVF are acute is forthcoming from the near mirror-image of reciprocal ST depression in lead aVL (compared to the subtle ST segment straightening and elevation that we see in lead III).
- Further support in favor of an acute inferior OMI — is forthcoming from the ST-T wave appearance in leads V2 and V3 (BLUE arrows in these leads showing shelf-like ST segment flattening — instead of the slightly elevated, gently upsloping ST segments that should normally be seen in these leads). This inappropriate Shape of these ST-T waves, in which maximal abnormality is seen in leads V2,V3 — indicates associated posterior OMI.
BOTTOM Line: Even before serum Troponin results come back — in this 60s man with new-onset CP — the localization of ST-T wave changes in the 6 leads shown in the magnified insert of Figure-1 — are diagnostic of acute infero-postero OMI until proven otherwise! (most likely from acute RCA occlusion — given ST elevation in lead III>lead II ).
- P.S.: A QS wave appears to be present in lead III. I suspect there is an initial positive deflection (r wave) in lead aVF. Whether these findings represent an old inferior OMI — or are part of an acute evolving event, is uncertain from this single tracing.
- Final Thought: Shape is more important than amount. When assessing a given case for the likelihood of acute OMI — KEY emphasis lies with: i) Clinical Context; — and the ECG factors of — ii) Shape; — and, iii) Proportionality.
= = =
Figure-1: I’ve reproduced today’s initial ECG — with a magnified insert of the KEY leads. Despite small size — diagnostic ECG findings are here.
= = =
= = =