A 50-something with diabetes presented with 3 hours of sharp chest pain radiating to the left hand, with dyspnea and diaphoresis; it was worse with exertion and with lying flat.
He had this second ECG, which was texted to me and I looked at it on my iPhone. At the time of this ECG, the patient had received NTG and the pain was decreasing.
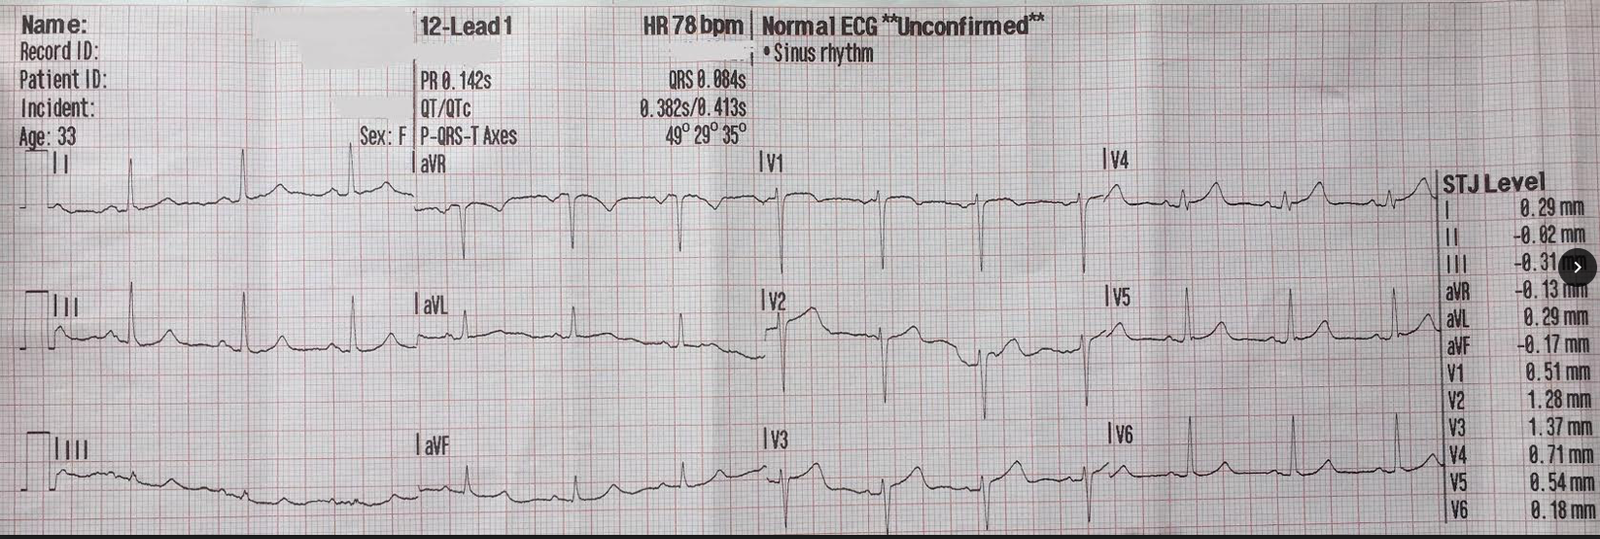
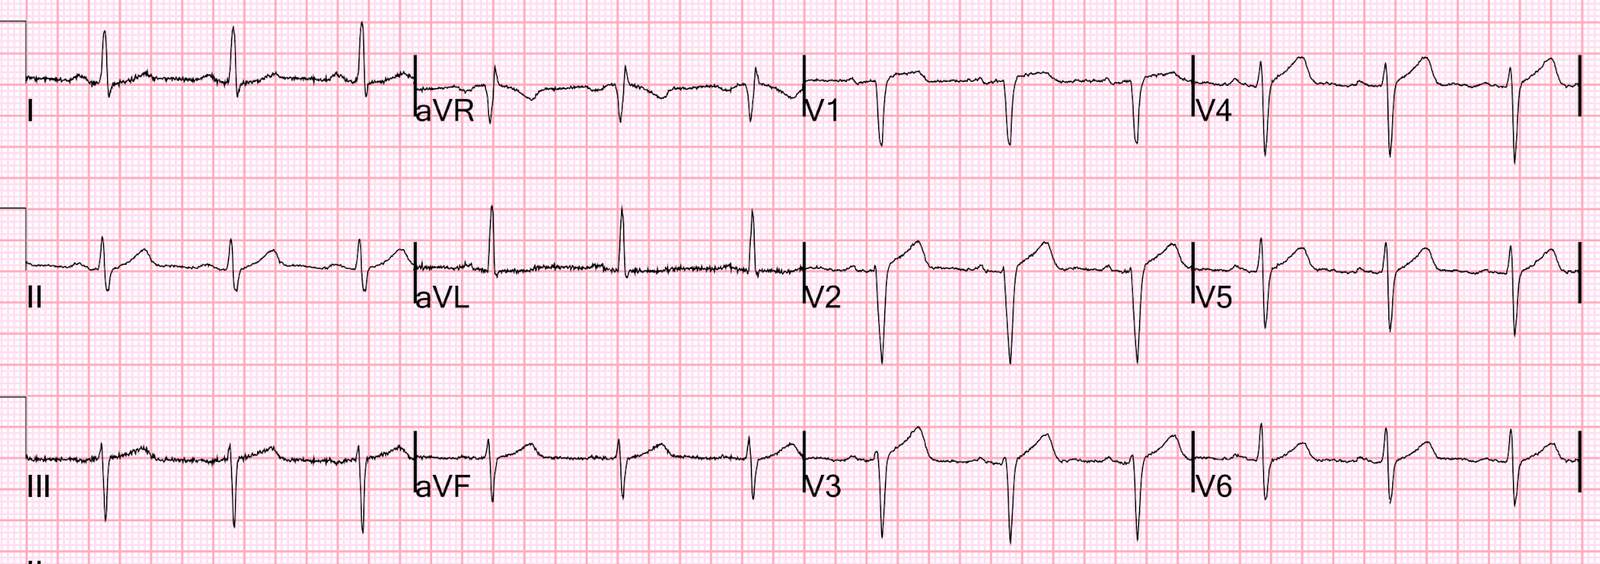
ECG-1:
 |
| There is 1 mm of ST elevation at the J-point in both V2 and V3 (within normal limits). Computer interpretation is normal Cardiologist overread is normal What do you think? |
More description: There is also poor R wave progression, with small R waves in V4. The T waves are slightly broad and large, but probably could not be called hyperacute. There is minimal STD in aVF.
One of our interns had texted this ECG-1 to me, with the message:
“3 hours of chest pain, QTc = 415 ms, 3 variable formula is 25.3. What do you think?”
__________
[The 3-variable formula for differentiating normal variant ST elevation from the ST elevation of subtle LAD occlusion can be accessed by clicking on the link at the top of the page and entering the values into the online excel applet. Values are: 1. ST elevation at 60 ms after the J-point in lead V3. 2. R-wave amplitude in V4. 3. computerized QTc. See also the free iPhone app “SubtleSTEMI”. See also MDcalc.]
A value greater than 23.4 is very worrisome for LAD occlusion.
__________
I responded:
“Not LAD occlusion. What do you think? Do the 4-variable formula.” (I just did not think it looked like an LAD occlusion)
I showed it to Pendell Meyers, and he said: To me it looks like it could be “on the way down” from LADO. The only way to prove it is with serial ECGs and the rest of the clinical story.
Very perceptive.
__________
[The 4-variable formula adds the entire QRS amplitude in lead V2 and is more accurate than the 3-variable formula. It is: (1.062 x STE at 60 ms after the J-point in V3 in mm) + (0.052 x computerized QTc) – (0.151 x QRSV2) – (0.268 x R-wave Amplitude in V4 in mm). It can also be accessed at the top of the page, with value entry into the excel applet.]
The publication of the formula can be found here: A new 4-variable formula
A value greater than 18.2 is quite sensitive and specific for LAD occlusion.
___________
The calculated value was 19.2
I suggested serial ECGs, which were done:
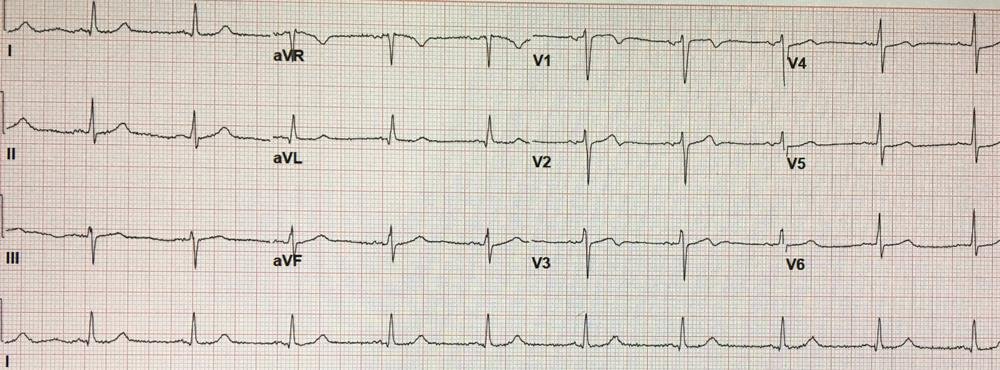
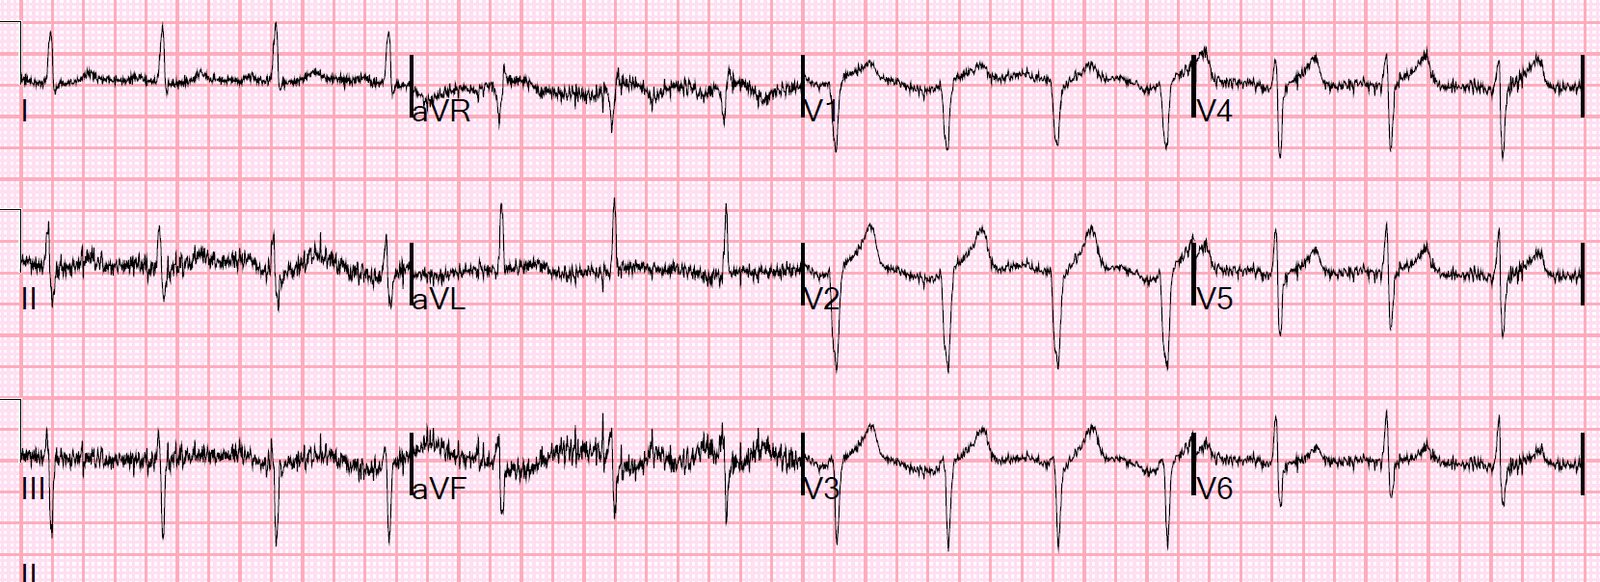
ECG-2: This one is about 50 minutes later:
 |
| Not much change |
The first troponin I returned undetectable.
At about 3 hours after ECG-1, the second troponin I returned at 0.097 ng/mL.
At this time, the patient became pain free.
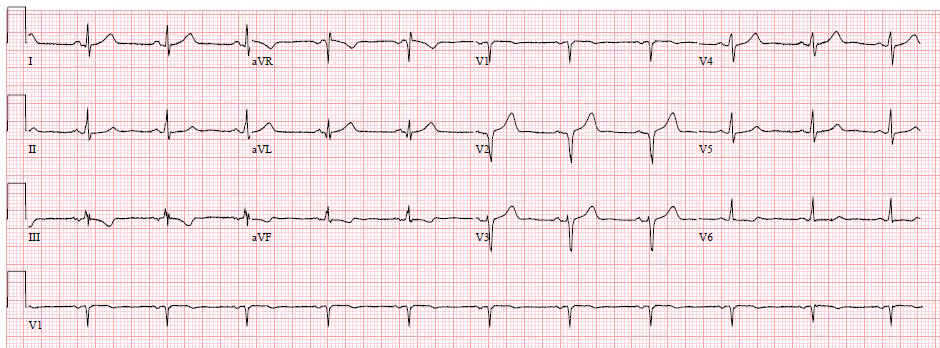
ECG-3. Here is the ECG in the pain free state:
 |
| Now there is less than 0.5 mm of ST Elevation. Some people have nearly zero ST elevation at baseline. For such patients, LAD occlusion may only manifest 1 mm of STE |
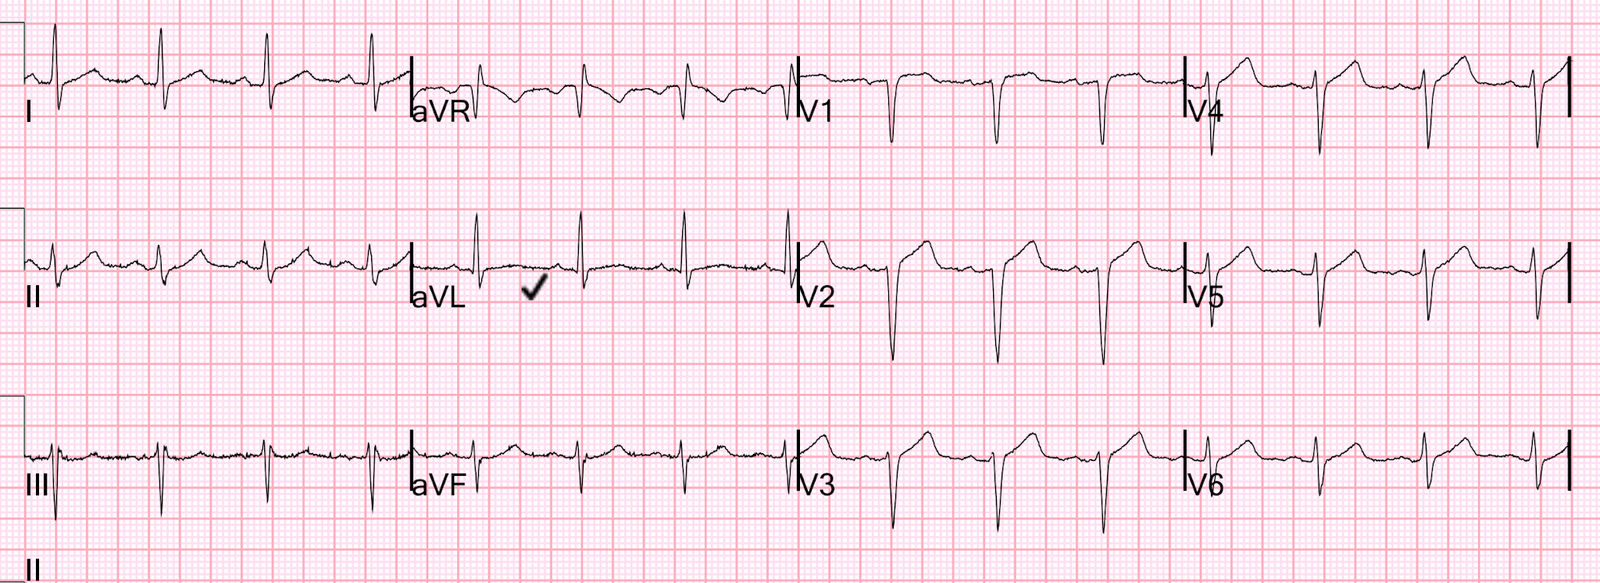
ECG-4. One hour later, this was his ECG (still pain free):
 |
| There is still only minimal STE. T-waves in V2 and V3 are slightly less tall. This suggests further resolution. |
ECG-5. Later I discovered that there was an even earlier first ECG, recorded 50 minutes prior to ECG-1.
 |
| This has a lot of artifact. It was called normal except for artifact. But this is very interesting: As it turns out, the ECG at the top (ECG-1) was done after nitroglycerine, and the patient’s pain had diminished “from 6/10 to 4/10.”
Here are all the V1-V3 leads, side by side: 1300 1350, pain decreasing 1430 1700, pain free 1800, still pain free
This shows that the T-waves (which never were quite hyperacute), are deflating and may have been hyperacute prior to arrival. |

Outcome:
The third troponin I, drawn 4.5 hours after presentation, returned at 4.2 ng/mL.
The patient went for angiogram and had an 80% mid-LAD thrombotic stenosis and proximal LAD disease, as well as a 90% diagonal lesion. He went for Coronary bypass (CABG).
This outcome is perfectly consistent with all the ECGs.
Learning points:
1. Pay attention to diminishing T-wave amplitude during diminishing pain.
2. The formulas are very accurate. I have always thought that I can do better than my formulas, but now I’m in doubt.
3. Some patients have near zero ST elevation at baseline. Any ST elevation in these patients is abnormal. In such patients, LAD occlusion may result in very subtle ST elevation.