Submitted and written by Alex Bracey, with edits by Pendell Meyers and Steve Smith:
I was walking through the critical care section of the ED when I overheard a discussion about the following ECG. I had no history on the case and no prior ECG for comparison.
 |
| What do you think? |
Here are inferior leads, and aVL, magnified:
 |
|
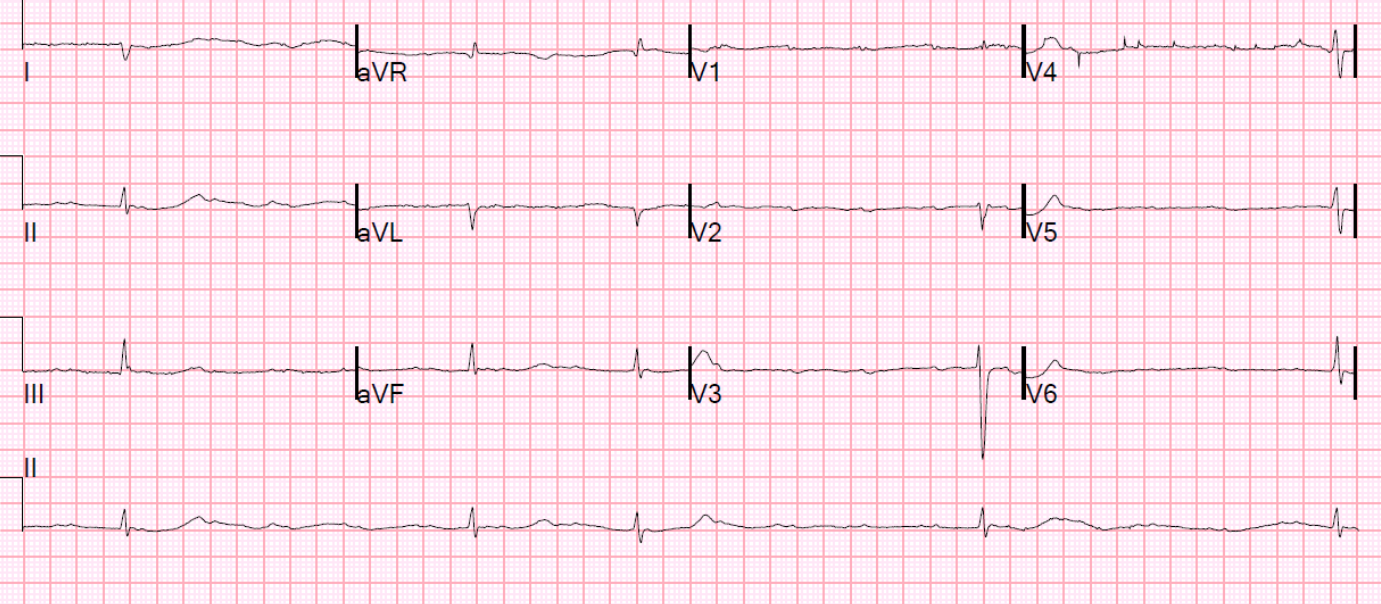
A closer inspection of the inferior leads and aVL Sinus bradycardia. The T-wave in lead III is slightly tall and broad (increased area under the curve) compared to its QRS complex. In isolation, this probably could not be called a hyperacute T-wave, but you may suspect it. There is T-wave inversion (TWI) in aVL. |
T-wave inversion in aVL: when is it abnormal?
There is no LVH or LBBB on which to blame the TWI (i.e., the QRS is normal). While T-wave inversion in aVL may be normal in the presence of a normal QRS, this is only true when the T-QRS angle is small. That is to say, when the T-axis and QRS axis are similar. In other words, if the QRS is negative, the T-wave may be negative. However, here QRS axis is about 35 degrees and the T-axis is about 85 degrees. Thus the T-QRS angle is 25 – 85 = (-60) degrees, which is abnormal. Any absolote value greater than 45 degrees is suspicious for T-wave inversion (however, this is very complex; see table posted at the bottom of this post.)
Now that we know the T-wave inversion in lead aVL following a normal QRS complex is abnormal, it helps to confirm that the T-wave in lead III is indeed hyperacute. The flattened T-wave in V2 suggests likely posterior involvement.
The cath lab was not activated based on this initial ECG. The patient was a female in her 60s with history of HTN and smoking who presented for chest pressure x1 hour. The initial ECG was taken at 0839. Based on the initial ECG and presenting complaint, the attending involved in the case opted to keep the patient in our critical care unit for close monitoring and serial ECGs.
She went on to describe her chest pain as a “buffalo sitting on my chest” and a “weird” sensation in her jaw for 1 hour prior to arrival, associated with lightheadedness and diaphoresis.
The patient was given fentanyl initially for chest pain with minimal effect and then vomited which was followed by zofran and famotidine. Initial troponin T from 0840 was less than 0.010 ng/mL (undetectable).
The following ECG was obtained at 0910:
 |
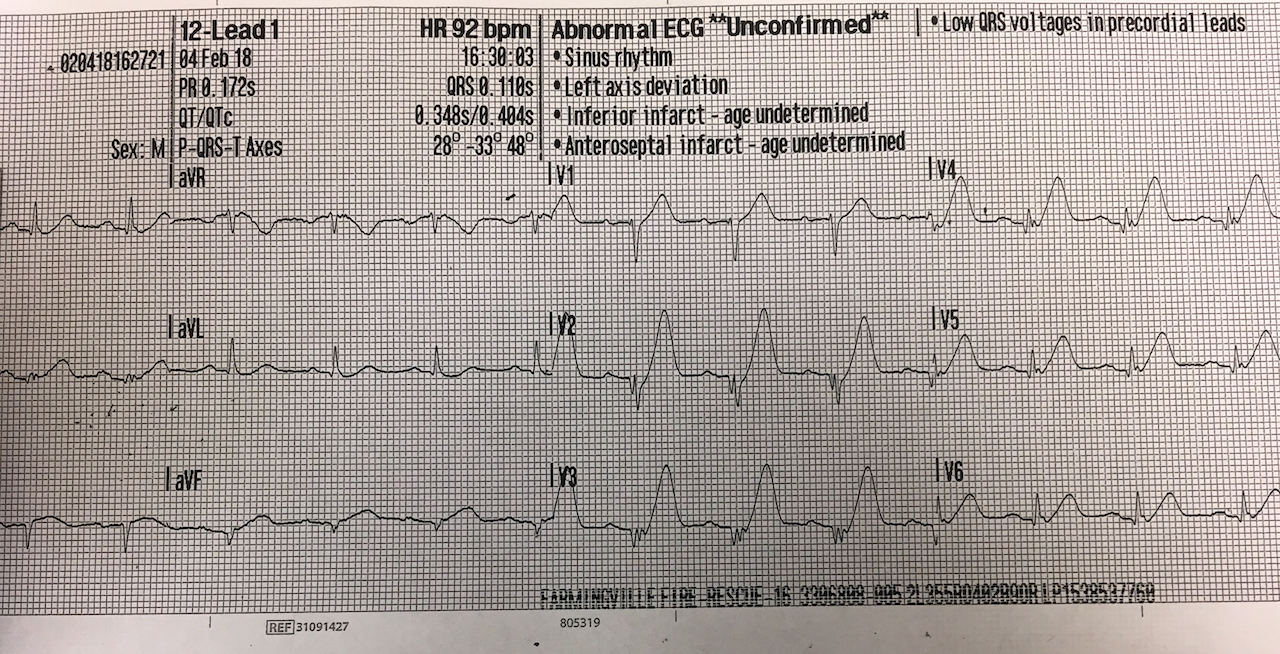
| Repeat ECG recorded 30 minutes after initial ECG. The patient still had chest pain. |
Magnified:
 |
|
Again, a close up of the interior leads and aVL |
Sinus rhythm with borderline 1st degree AV block. There has been interval marked increase in the area under the ST-segment and T-wave in leads II, III, and aVF, with concomitant increase in the area above the inverted T-wave in aVL, all confirming that that these truly represent inferior hyperacute T-waves. The STE in the inferior leads is larger. There is now TWI and small STD in lead V2, highly suspicious for posterior MI.
This ECG is diagnostic of an acute coronary occlusion of an artery supplying the inferior and posterior walls.
The cath lab was activated following this ECG and the cardiology fellow came to the bedside. The patient was given aspirin and ticagrelor and was scheduled for urgent cath.
In the cardiac cath holding area, a repeat troponin T was 0.01 ng/mL (positive). The following ECG as recorded at 1206:
 |
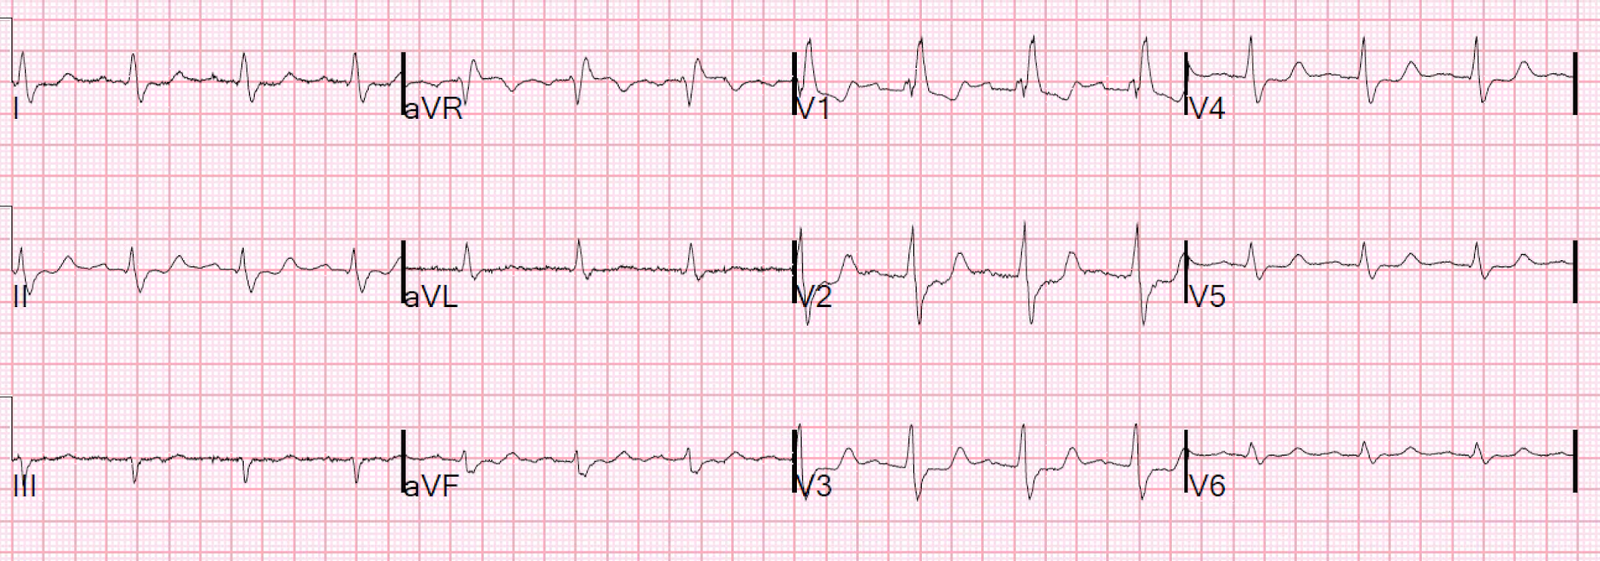
| Pre-cath right sided ECG. V1 and V2 are unchanged from the normal 12-lead sytem; V3-V6 are actually V3R-V6R. |
The T-waves are even more hyperacute. Right sided leads (V3-V6 on this ECG correspond to V3R-V6R) have STE and hyperacute T-waves indicative of RV infarction.
 |
|
Progression of Inferior leads and aVL In this magnified arrangement you can see progression of subtle changes including the progressively increasing area underneath the hyperacute T-waves. Even at ~4 hours into her acute coronary occlusion there is barely any ST Elevation. |
Also notice that the ST segments in this example are concave, which is often erroneously mythologized as a non-ischemic pattern.
 |
| Progression of V2 showing posterior involvement. |
The patient was then taken to the cath lab an found to have a proximal RCA 100% thrombotic occlusion which was successfully stented.
 |
| 100% occluded RCA with TIMI 0 flow |
 |
| Post drug-eluting stent placement with TIMI 3 flow |
While in the cath lab, she transiently developed complete heart block and became hypotensive requiring transvenous pacemaker placement and transient pressors. A right heart cath revealed increased right heart pressures and a similarly timed echo revealed mild right heart failure.
Peak troponin T was 3.00 ng/mL (highly elevated).
 |
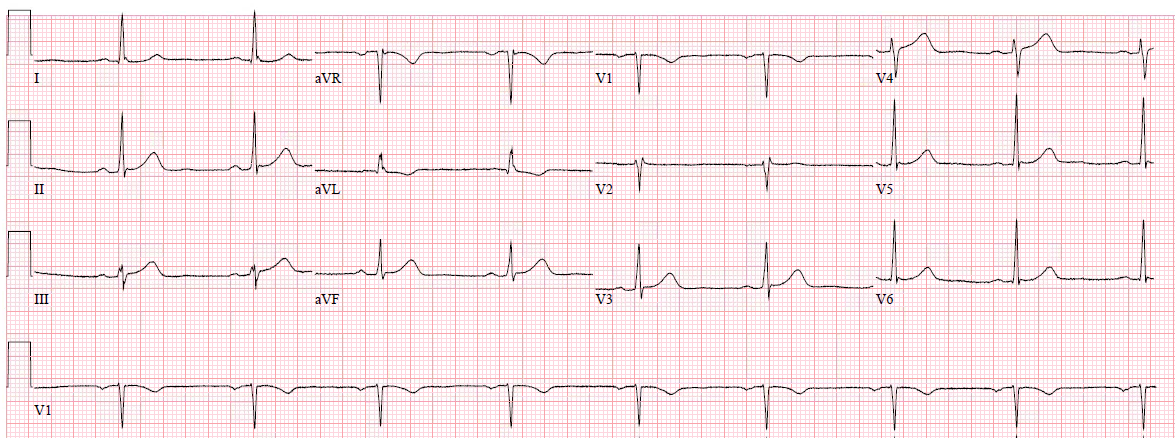
| Post-cath ECG with resolution of acute changes. |
The transvenous pacemaker was removed the following day and pressors were not required again. She was discharged to home 2 days later without further complications.
Learning Points:
1) As we have previously demonstrated, aVL was once again the key initial clue to diagnosing subtle RCA occlusion.
2) Contemporary troponins only start to rise 4-6 hours after the onset of acute coronary occlusion. Relying on troponin elevation to diagnose acute coronary occlusion after at least 4 hours of infarction when the ECG can identify it immediately is poor choice.
3) STEMI criteria failed to identify this acute coronary occlusion, like many others. Only expert ECG interpretation combined with strong clinical suspicion were able to identify this case. Remember that some acute coronary occlusions will present with totally normal serial ECGs, and some patients with extremely concerning symptoms warrant emergent cath lab activation even without ECG findings.
QRST Angle
New abstract on QRST angle:
http://www.jecgonline.com/article/S0022-0736(17)30477-6/fulltext
Strebel I et al. Diagnostic and prognostic value of the QRS-T-angle, an ECG marker quantifying heterogeneity of depolarization and repolarization, in patients with suspected non-ST-elevation myocardial infarction. J Electrocardiology January–February, 2018; Volume 51, Issue 1, Pages e5–e6.
Background: The value of the 12-lead ECG in the diagnosis of non-ST-elevation myocardial infarction (NSTEMI) is limited due to insufficient sensitivity and specificity of standard markers of ischemia and because ECG confounders may prevent their application. The QRS-T-angle reflects depolarization–repolarization heterogeneity and might assist in diagnosis and prognosis of patients with suspected NSTEMI.
Methods: We prospectively enrolled 2705 consecutive patients with symptoms suggestive of NSTEMI. The QRS-T angle and presence and type of ECG confounders were automatically derived from the digital 12-lead ECG recorded at presentation to the ED. Patients were followed up for all-cause mortality for 3 years.
Results: NSTEMI was the final diagnosis in 15% of patients. Overall, 18% showed any form of ECG confounders. QRS-T angles were significantly greater in patients with NSTEMI compared to those without (p less than 0.001). The diagnostic accuracy of the QRS-T-angle for NSTEMI as quantified by the area under the ROC curve was 0.67 overall, and similar in patients with no, intermediate and remarkable ECG confounders (AUC 0.65, 0.70 and 0.63, p = 0.20 for comparison). The QRS-T-angle provided incremental diagnostic value to dichotomous standard ECG criteria (ST-depression, T-inversion) and the ST-deviation score (all p less than 0.001). Greater QRS-T-angles were independently associated with a worse prognosis (3 year survival rates 96%, 88% and 71% for patients with a QRS-T angle less than 50°, 50-100° and greater than100°, p less than 0.001).
Conclusion: In patients with suspected NSTEMI, the QRS-T-angle automatically derived from the 12-lead ECG provides incremental diagnostic accuracy in both patients with and without ECG confounders, and independently predicts all-cause mortality during 3 years of follow-up.
Normal QRS-T angle
From this article: Ziegler R and Bloomfield DK. A study of the normal QRS-T angle in the frontal plane. Journal of Electrocardiology 3(2):161-167; 1970.
Yes, there are valuable articles from 50 years ago!
Quote from the article:
Since I do not know how to make a “degree” sign on this blog, I use “^” for degree sign:
“Deviation of the mean electrical QRS axis of
the heart in the frontal plane (A^QRS) from apparent normal values has been considered
evidence of electrocardiographic abnormality.
Similarly, the normal range of the mean electrical
T axis in the frontal plane (A^T) has been described. The difference between A^QRS and
A^T (the QRS-T angle), has also proven useful in
defining electrocardiographic normality and abnormality. It has generally been accepted that a
QRS-T angle in the frontal plane which exceeds
45^, 50^, or 60^ is abnormal. We have
studied the value of the QRS-T angle in normal
and abnormal electrocardiograms, and have noted
the normal A^QRS ranges between -15^ and +85^ on the hexaxial reference system and locates
centrally from normal QRS vectors that vary
from -30^ to +95 ^.
 |