From Anonymous
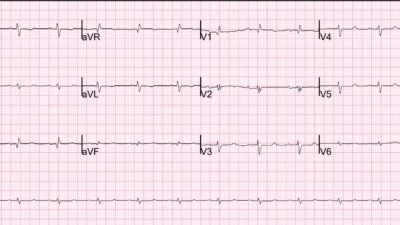
A man in his 50s experienced acute chest pain and shortness of breath. He presented quickly to the Emergency Department, where he had normal vital signs at triage except for bradycardia. Here is his triage ECG:
Surely you understand this ECG if you read this blog?
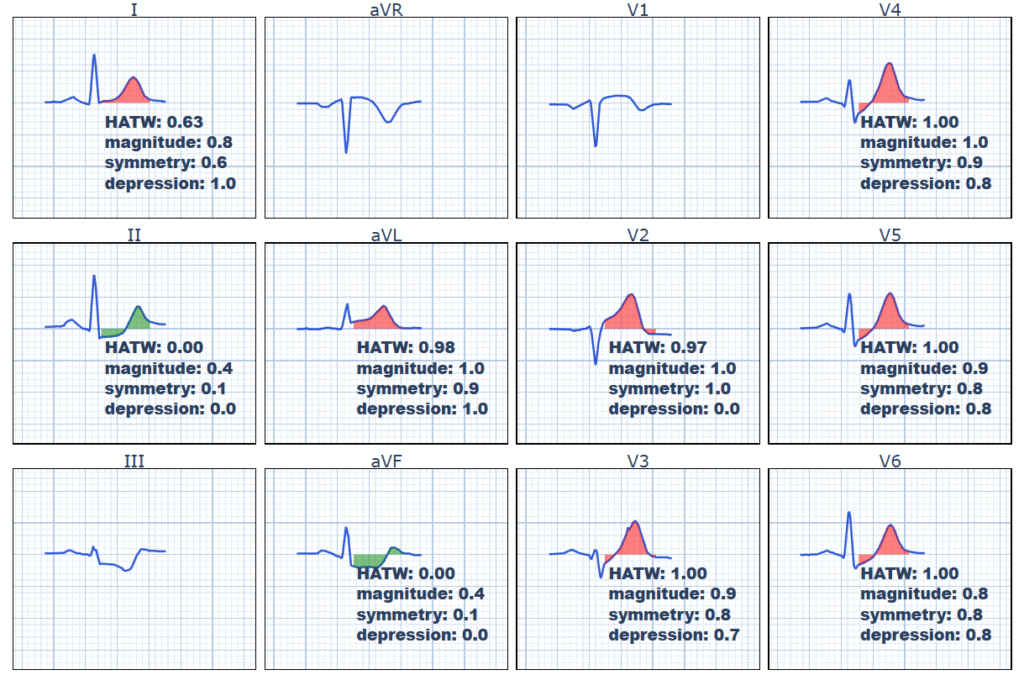
Sinus rhythm, normal QRS, anterolateral hyperacute OMI pattern. HATW in V2-V6, I, and aVL (leads V3-V6 also have STD, making them the de Winter subtype of HATW). There is no STEMI criteria due to lack of 2 consecutive leads with STEMI mm criteria. Fortunately for the patient, there is reciprocal STD in inferior leads (but this is absent in about 50% of LAD occlusions).
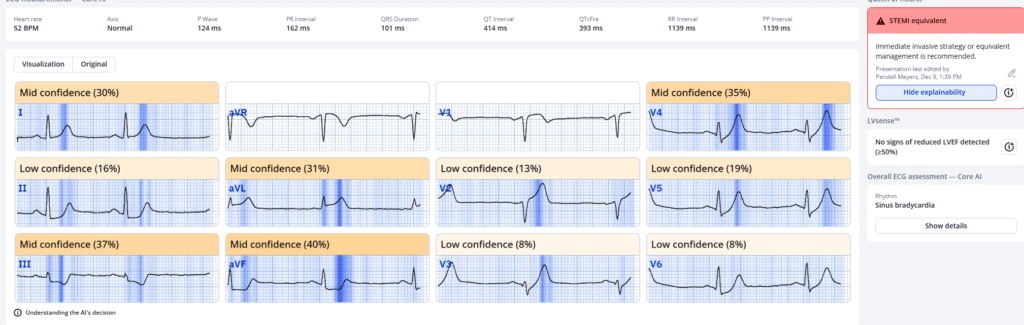
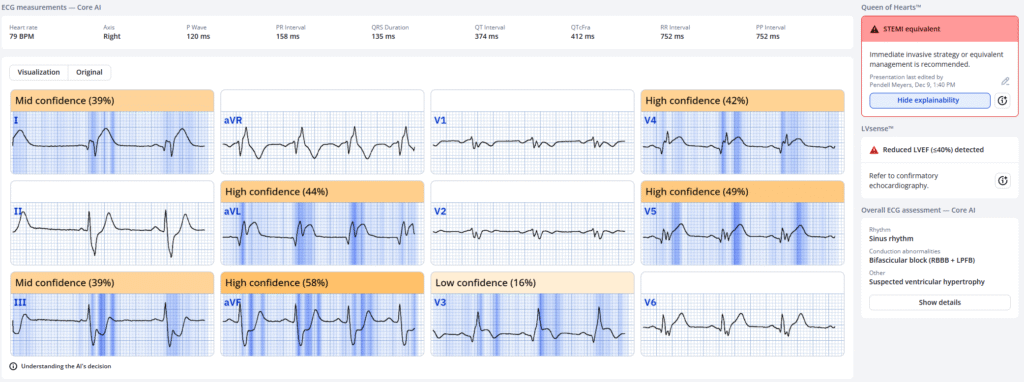
Queen of Hearts interpretation:
PMcardio for Individuals now includes the latest Queen of Hearts model, AI explainability (blue heatmaps), and %LV Ejection Fraction. Download now for iOS or Android: https://individuals.pmcardio.com/app/promo?code=DRSMITH20. As a member of our community, you can use the code DRSMITH20 to get an exclusive 20% off your first year of the annual subscription. Disclaimer: Certain AI ECG Modules are CE-marked medical devices under EU MDR and are certified for marketing only in the European Union and the United Kingdom. PMcardio technology has not yet been cleared by the US Food and Drug Administration (FDA) for clinical use in the USA.
Also, here is the ECG with our objective HATW formula applied (the 3-variable version that also includes de Winter ST depression):
The EM physician was concerned and called a Code STEMI. The receiving Cardiologist stated that there was no STEMI criteria and “did not want to call it a code STEMI.”
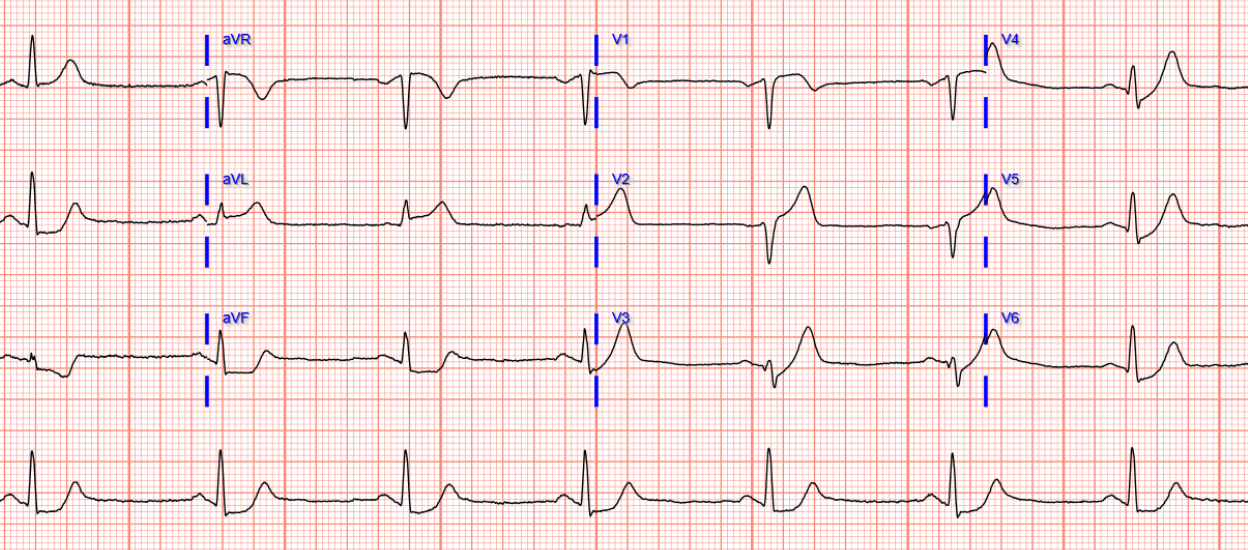
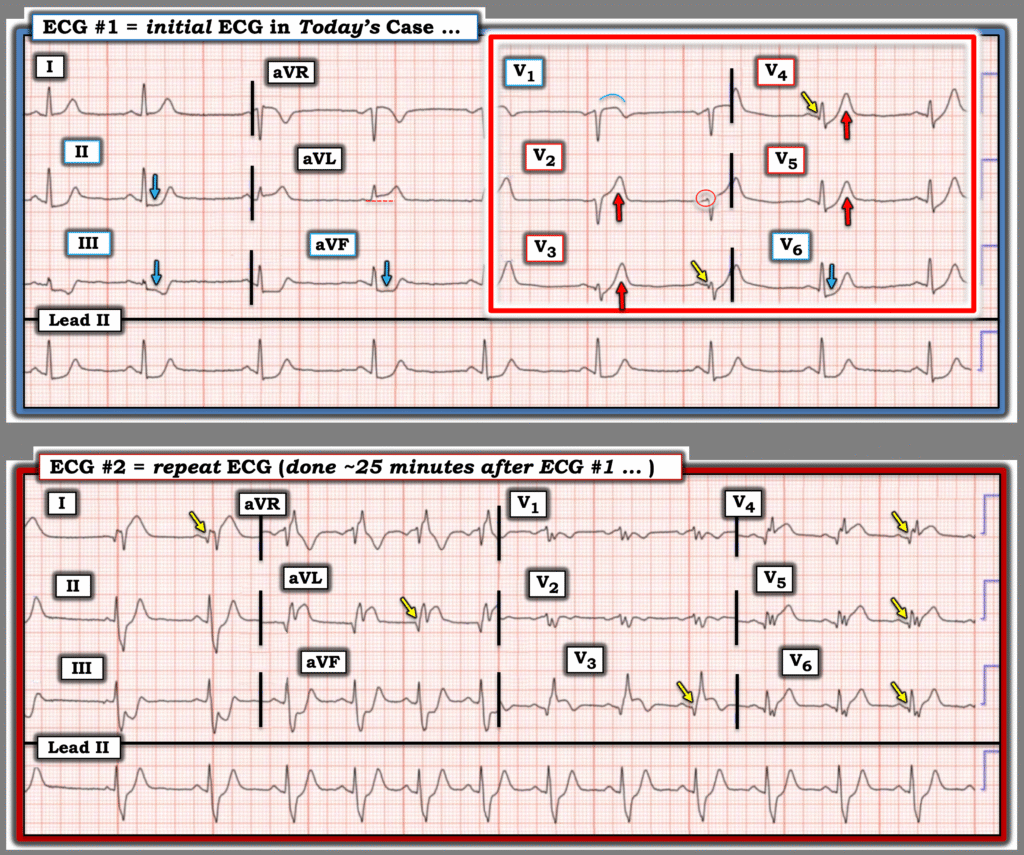
So the EM physician obtained a repeat ECG at about 25 minutes after the first:
Still very obvious, but now with likely RBBB, LAFB, and precordial lead misplacement.
Seeing this ECG, the Cardiologist now agreed to code STEMI.
Queen of Hearts:
The angiogram showed a total occlusion of the proximal LAD with thrombus. PCI was performed and the patient survived.
Other patients are not so lucky to have obvious ECGs, and even this patient could easily have suffered cardiac arrest during the delay between STEMI diagnosis and OMI diagnosis.
Smith: it is also not a guarantee that this occlusion will develop ST Elevation. See this article, where we show that, of 17 patients with total LAD occlusion with hyperacute T-waves but without diagnostic ST Elevation, zero ever develop diagnostic ST Elevation. Do NOT let your cardiologist deny an activation for an ECG like this! It is absolutely diagnostic of proximal LAD Occlusion. Not only does waiting 25 minutes expose the patient to the risk of cardiac arrest, but in that time period a significant amount of myocardium is lost!
= = =
= = =
======================================
MY Comment, by KEN GRAUER, MD (12/20/2025):
Today’s case makes for a difficult read. The year we are in will soon be 2026 — which will make it 18 years since deWinter et al published their manuscript in the NEJM (N Engl J Med 359:2071-2073, 2008). One would hope that the cardiology community would be updated to this literature after passage of this amount of time — but today’s case is just one of many showing this is not the current reality (See My Comment in the January 31, 2025 post, among many others in Dr. Smith’s ECG Blog).
- The description by deWinter et al in their 2008 manuscript read, “There is a new ECG pattern without ST elevation that signifies acute occlusion of the proximal LAD (Left Anterior Descending) coronary artery.” Within the next few years, other investigators confirmed these deWinter findings — leading to adoption of deWinter T waves as a STEMI “equivalent“ pattern (Bhave et al: JACC: Expert Consensus Decision Pathway, 2022 — Ricci et al: Ann Emerg Med 85(4):330-340, 2025 — McLaren et al: JACC Advances 3(11), 2024).
= = =
Today’s CASE: A Difficult Read …
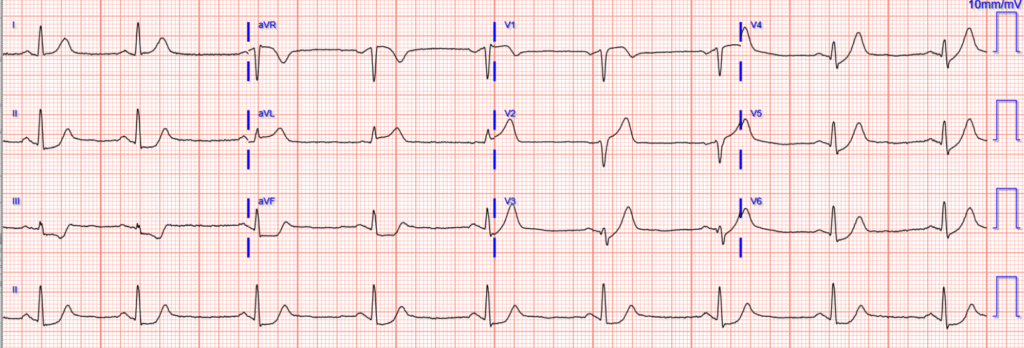
As per Drs. Meyers and Smith — today’s initial ECG (that I’ve reproduced and labeled below in Figure-1) is clearly diagnostic of an acute OMI in today’s patient, who presented with acute CP (Chest Pain).
- The long lead II rhythm strip in ECG #1 — shows the rhythm to be sinus bradycardia with sinus arrhythmia. All intervals and the frontal plane axis are normal. There is no chamber enlargement.
- Overall QRS voltage is reduced (in both limb leads and chest leads). Whether or not this might reflect cardiac stunning (vs being due to body habitus or some other cause) is uncertain from this single tracing — but this is an ECG finding to be noted and followed (CLICK HERE for causes and clinical implications of Low Voltage).
- As illustrated below in Figure-2 — today’s initial ECG manifests a textbook picture of deWinter T Waves because — i) There is marked, upsloping J-point ST depression — that continues into tall, positive symmetric T waves (seen in Figure-1 in 4/6 chest leads — with a hyperacute and elevated ST-T wave in lead V2 — and abnormal coved ST elevation in lead V1); — and, ii) Additional evidence of proximal LAD occlusion is present (in the form of reciprocal ST depression in the inferior leads + hyperacute ST elevation in lead aVL).
- In addition to deWinter T waves — I interpreted the appearance of the ST-T waves in lead V1 and lead V6 as consistent with Precordial “Swirl” (ie, The distinctly abnormal coved ST elevation with terminal T wave inversion in lead V1 — with deep ST depression in lead V6). This provides yet more indication of very proximal LAD occlusion (See My Comment at the bottom of the October 15, 2022 post for a summary of ECG findings with “Swirl”).
- PEARL: Additional indication from today’s initial ECG that there is more than just impending infarction from high-grade proximal LAD narrowing — is forthcoming from the infarction Q waves that are already developing in multiple chest leads. Whereas small and narrow q waves are not necessarily abnormal in lateral chest leads (as seen in leads V5,V6 in ECG #1) — the subtle loss of R wave (from the tiny initial positive deflection seen within the RED circle in lead V2) — with distinct development of Q waves in leads V3,V4 (YELLOW arrows in these leads) is never a “normal” finding.
BOTTOM Line: In today’s patient, who presented with new acute CP — there is no justification for failure to activate the cath lab because, “there is no STEMI”.
- As per Drs. Smith and Meyers — this delay in activating the cath lab risks cardiac arrest, as well as potential permanent loss of viable myocardium. Fortunately, the ED physician recognized the seriousness and acuity of today’s initial ECG — thereby ordering a repeat ECG within 25 minutes that now satisfied STEMI criteria, finally convincing the interventionist of the need for prompt cath.
= = =
Figure-1: Comparison between the 2 ECGs in today’s case.
= = =
What to Learn from Today’s Repeat ECG:
The repeat ECG (Bottom tracing in Figure-1) emphasizes several points:
- In as little as 25 minutes — there can be marked changes in an acutely evolving MI. If concerned about active evolution — a repeat ECG might be obtained even sooner than 25 minutes.
- As per Dr. Meyers — some sort of “technical misadventure” most probably accounts for the highly unusual (and almost identical-looking) low-amplitude multi-deflection complexes in leads V1,V2 (complexes in both leads preceded by negative P waves, as is commonly seen with too high placement of leads V1,V2) — and with what most probably represents RBBB in lead V3 (a qR pattern — that typically is seen in lead V1 with RBBB).
- The above bullet noted — the obvious dramatic increase in ST segment elevation and depression in multiple leads is such, that even if there is an error in lead placement — a “STEMI” can be finally verified. (One can only wonder how much time might have passed until the ECG was repeated — if not for the astute ED physician who did so within 25 minutes).
- Note the evolution of Q waves in multiple leads in ECG #2. This verifies the suspicion I had from ECG #1 that showed loss of R wave from lead V2-to-V3 — and development of the initially subtle YELLOW arrow Q waves that we saw in the chest leads of the initial tracing.
- Note the evolution of deWinter T waves from ECG #1 — to now showing dramatic increase in the amount of respective ST elevation and depression (as well as development of RBBB and suggestion of a hemiblock in lead V2).
- Finally — Note T-QRS-D (Terminal QRS Distortion) in leads V3,V4! While clearly not needed in today’s case for the diagnosis of an extensive STEMI — it is good to gain comfort in recognizing this important ECG indication of acute OMI (See My Comment in the November 14, 2019 post).
- = = =
- P.S.: Did you notice the slight change in the rhythm in ECG #2? Sinus arrhythmia remains, although the heart rate is faster than it was in the initial tracing. But the long lead II begins with a slight pause — and the P wave of the first beat is different in shape than all of the P waves that follow. Clinically — this probably reflects an unimportant atrial escape beat that occurs after a premature beat. But my point is that it takes no extra time to always begin your assessment of each new ECG with a 2-3 second look at the long lead rhythm strip (which sometimes will pick up important changes in the rhythm that will otherwise be missed).
= = =
deWinter T Waves on Today’s Initial ECG?
I find it helpful to periodically review the “ECG picture” of deWinter T waves. To do this — A picture is worth 1,000 words. So I like to go back to the illustration of 8 patients from the original manuscript by Robbert J. de Winter et al (N Engl J Med 359:2071-2073, 2008).
- For clarity in Figure-2 — I compare a sample QRS complex from each of the 12 leads in today’s initial ECG (Left panel in Figure-2) — with the ECGs from 8 of the patients studied by deWinter et al (labeled A-thru-H in Figure-2).
- Focus on the 6 chest leads in today’s tracing (Left panel — within the BLUE rectangle) — reveals a memorable ST-T wave picture comparable to that seen in the 8 illustrative deWinter patients (within the RED rectangle). This pattern should be embedded in our brain to facilitate instant recognition.
- The above said — it’s good to appreciate that there may be some variation in the appearance of deWinter T waves. There may not always be involvement of all 6 chest leads as deWinter described. And, as was seen in lead V2 of today’s case — J-point ST depression is not always seen in each of the leads with large, hyperacute T waves. I suspect this depends on when during the course the ECG was recorded (as well as on other factors, such as prior infarctions, presence of multi-vessel disease, different collateralization patterns, and whether or not there has been some component of spontaneous reperfusion).
- Most (but not all) patients with deWinter T waves will have at least some ST elevation in lead aVR.
- Most (but not all) patients with deWinter T waves will manifest at least some reciprocal ST depression in the inferior leads (albeit often not as marked as in today’s case).
- Surprisingly (as seen in Figure-2) — the ST-T wave appearance in lead aVL is especially variable (ie, ST elevation or depression may be seen).
- Bottom Line: Even among these 8 representative tracings in Figure-2 (from the 30 patients in the deWinter study identified as manifesting deWinter T waves) — there may be some variability in the ECG picture of this entity, but the overall ECG pattern seen in ECG #1 is unmistakeable.
= =
= = =
Figure-2: Comparison of ECG findings in today’s case (LEFT panel) — with the deWinter T Wave Pattern, as first described by deWinter et al in their 2008 manuscript. (ECGs in these 8 patients [labeled A-thru-H] were obtained between 26 and 141 minutes after the onset of symptoms).
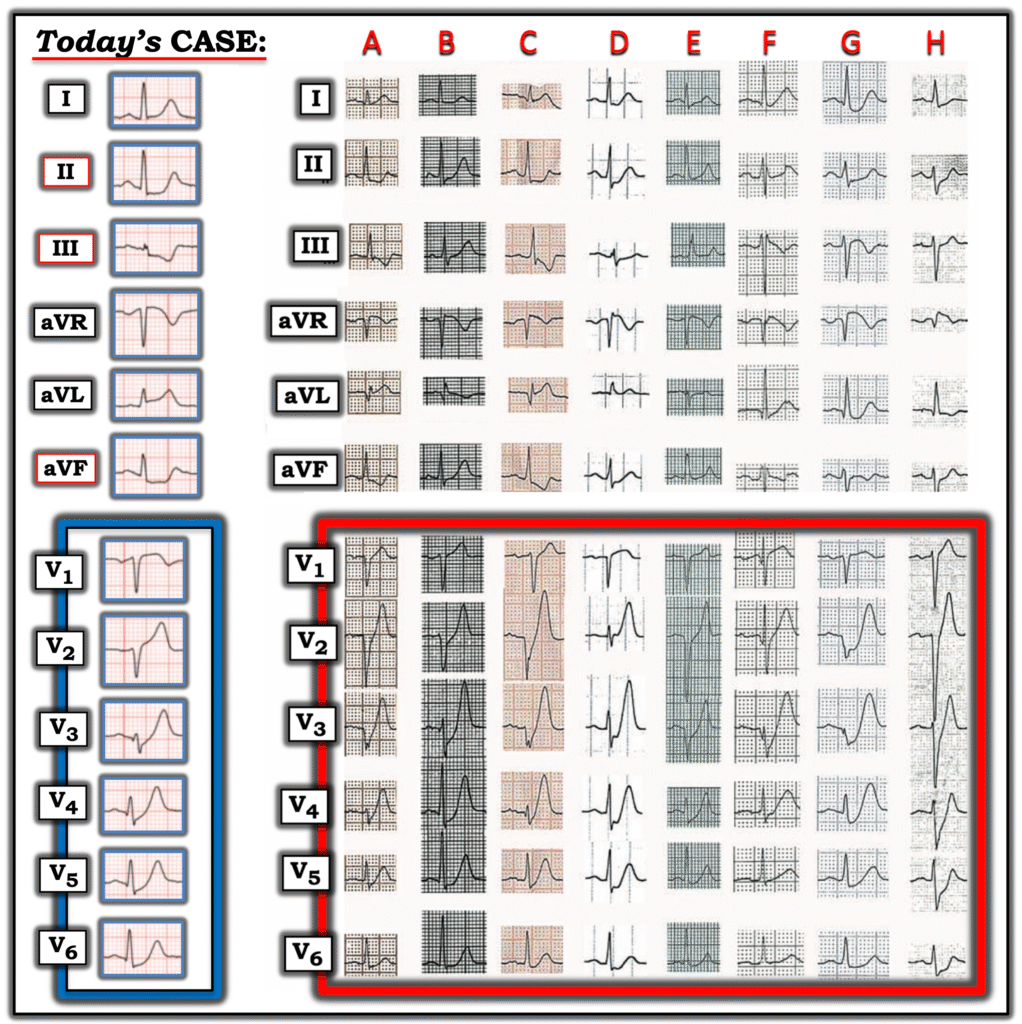
NOTE: I have corrected in Figure-2 for an error that I believe was made by the authors in their original manuscript ( = Leads I and aVL were switched in Patient C in the original manuscript from what I show above. That original mounting of those 2 leads would make for an impossible frontal plane axis and unlikely ST-T wave picture. I believe what shows above in my Figure-1 is now correct).
= = =
= = =
= = =