A male in his 60’s had a history of previously stented infero-posterior-lateral STEMI due to an occluded dominant circumflex, which had been opened and stented.
He called 911 for acute chest pain.
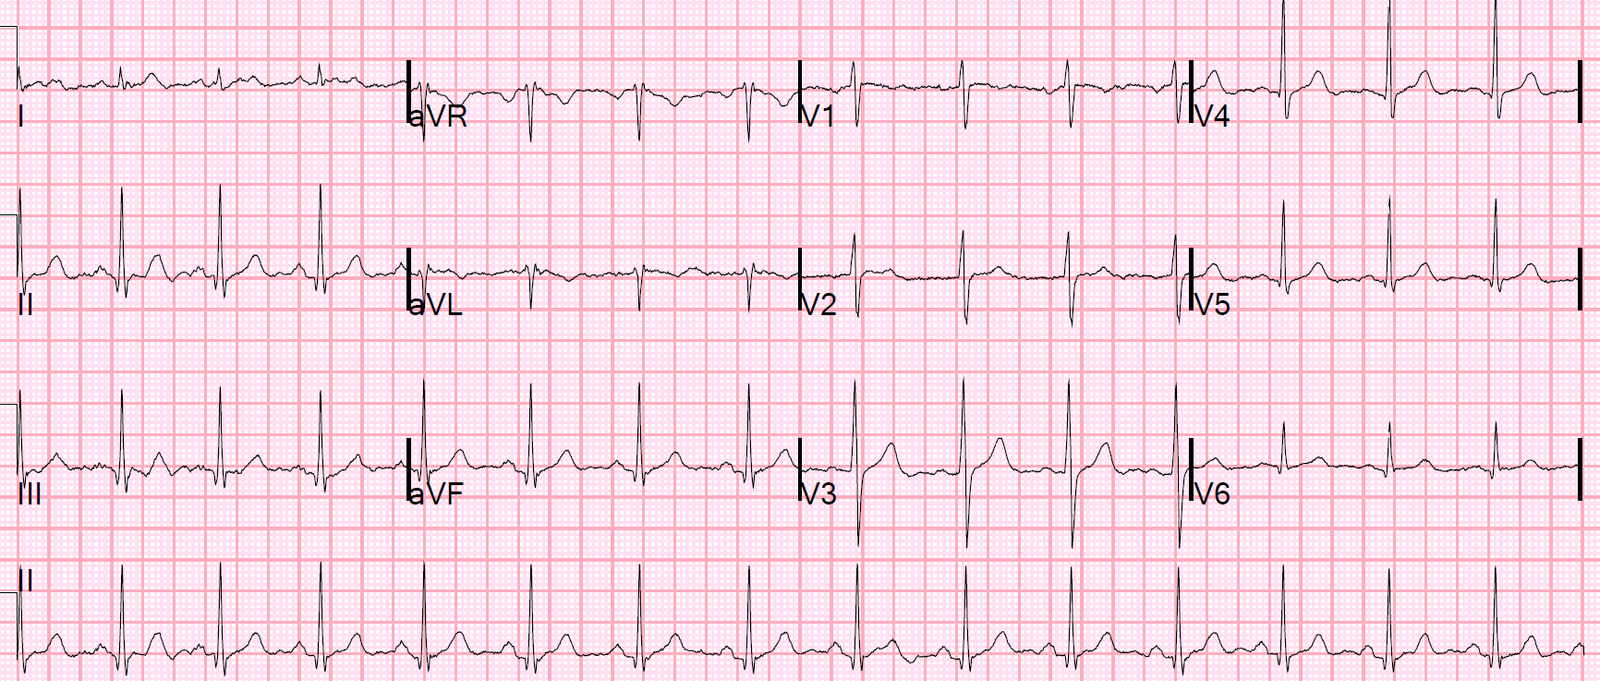
Here is the first prehospital ECG at time zero. The computer read “Nonspecific ST-T abnormalities.”
Time zero:
 |
| The computerized QTc was 431 ms.
The computer read “nonspecific ST-T abnormalities” |
There is minimal ST elevation in V2 and V3.
T-waves are large in V2 and V3.
There are minimal down-up T-waves in III and aVF.
This is LAD occlusion until proven otherwise. One must explain the minimal ST elevation in V2 and V3. It is not due to LVH, LV aneurysm, or pericarditis.
Thus, it must be either normal variant ST elevation (loosely called “early repolarization”) or acute LAD occlusion. To me it is clearly LAD occlusion.
One can use the LAD occlusion/early repol formula to differentiate. There is an iPhone app for it which really helps to be certain you are applying the formula correctly.
It is critical to use this formula only when the differential is subtle LAD occlusion vs. early repol (normal variant ST elevation). There must be ST Elevation of at least 1 mm. If there is LVH, it may not apply. If there are features that make LAD occlusion obvious (inferior or anterior ST depression, convexity, terminal QRS distortion, Q-waves), then the equation MAY NOT apply. These kinds of cases were excluded from the study as obvious anterior STEMI.
If you use these values:
Computerized QTc = 431 ms
ST elevation at 60 ms after the J-point in lead V3 (STE60V3) = 1.5 mm
R-wave amplitude in V4 (RAV4) = 6.5 mm
The resulting value = 25.1. Any value greater than 23.4 is very likely to be LAD occlusion.
Case continued
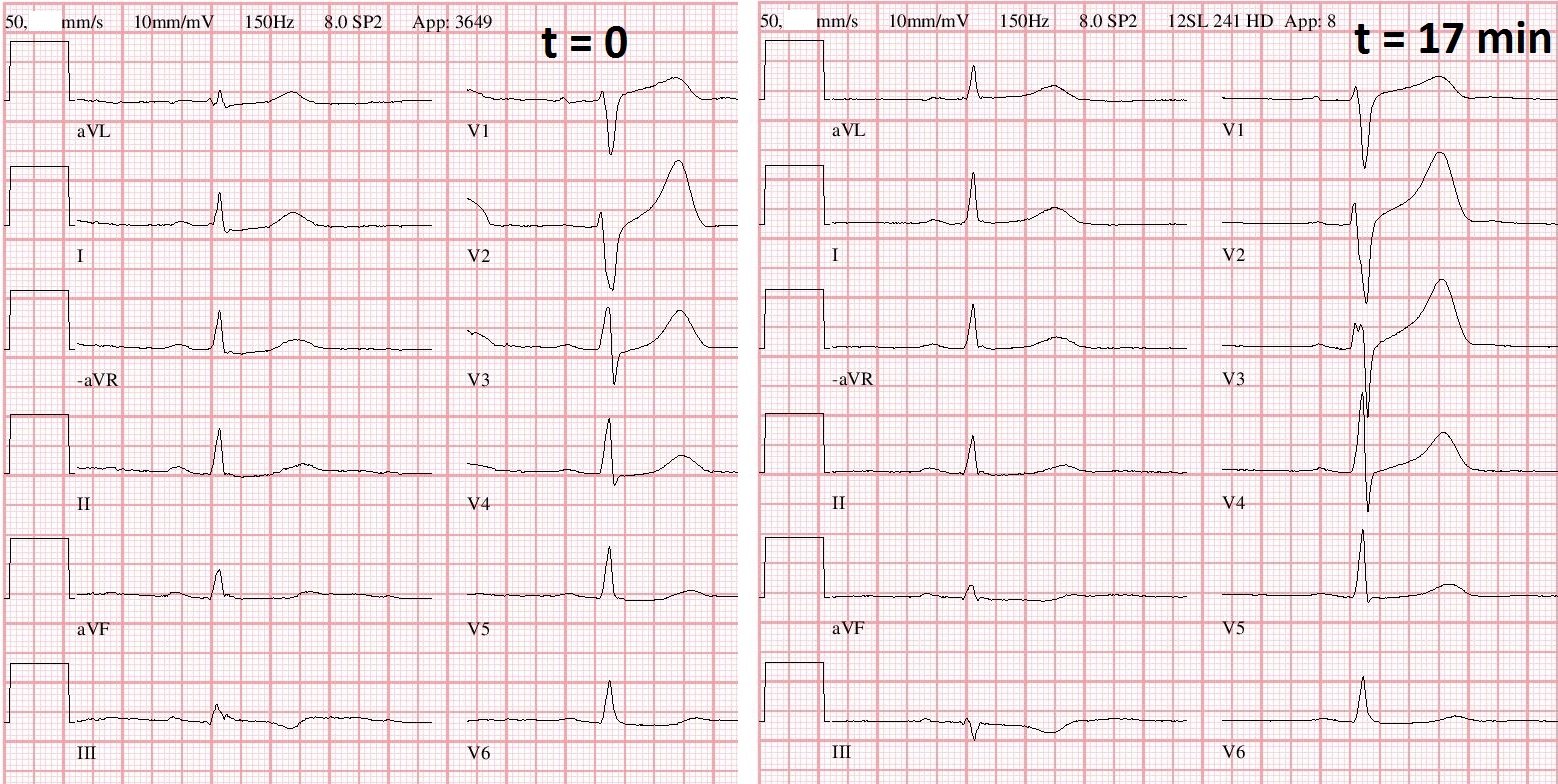
This was recorded 22 minutes later: Again, nonspecific ST-T abnormalities
 |
| What do you see here? The computer still reads “nonspecific ST-T abnormalities” Note the computer reads the ST segment: For V2, it is 1.03 mm For V3, it is 1.58 mm “Normal” for a male over age 40 is up to 2.0 mm in V2 and V3. |
Now there is straightening of the ST segment in V2. A straight ST segment is very rare in normal variant ST elevation, and the change makes it diagnostic of LAD occlusion. Inferior ST segments have also evolved. aVL has suspicious coving; it is probably a proximal LAD occlusion.
The ST elevation “criteria” are incorrect.
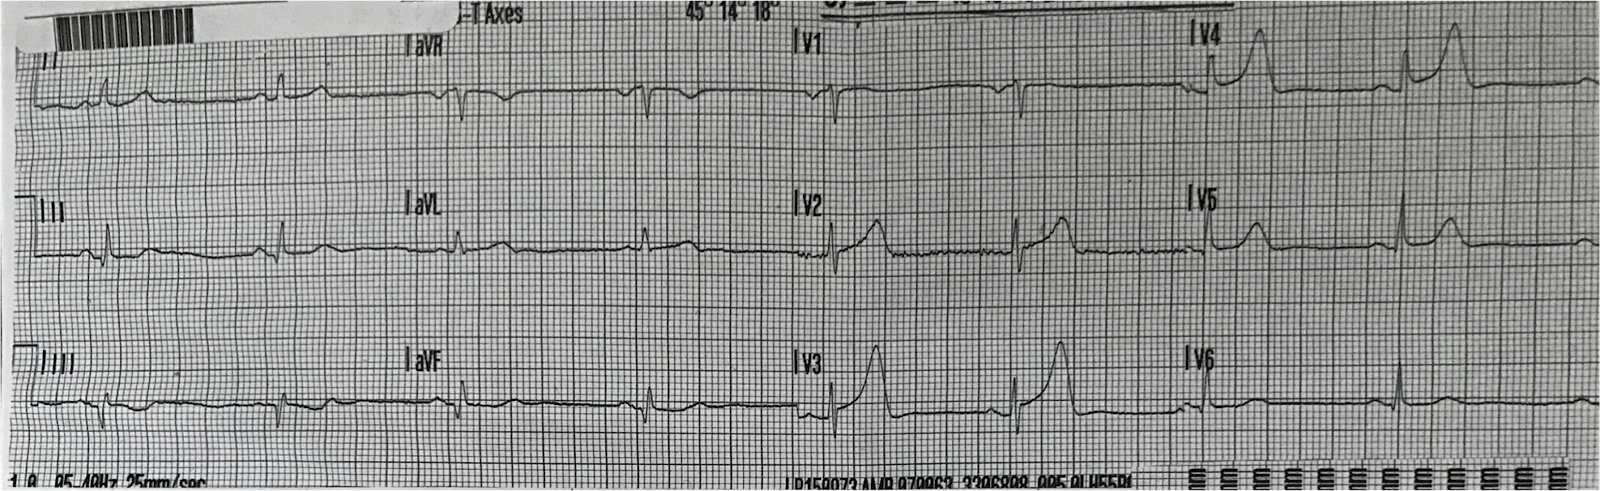
The patient arrived in the ED and had this ECG recorded at 25 minutes after the 2nd ECG (t = 47 minutes)
So this is the first ED ECG:
 |
| The computer interpretation: “Possible old inferior myocardial infarction.” Very similar, but now with more ST depression in inferior leads and subtle ST elevation in aVL. Again, diagnostic of LAD occlusion, with evolution of findings. |
The cath lab was activated.
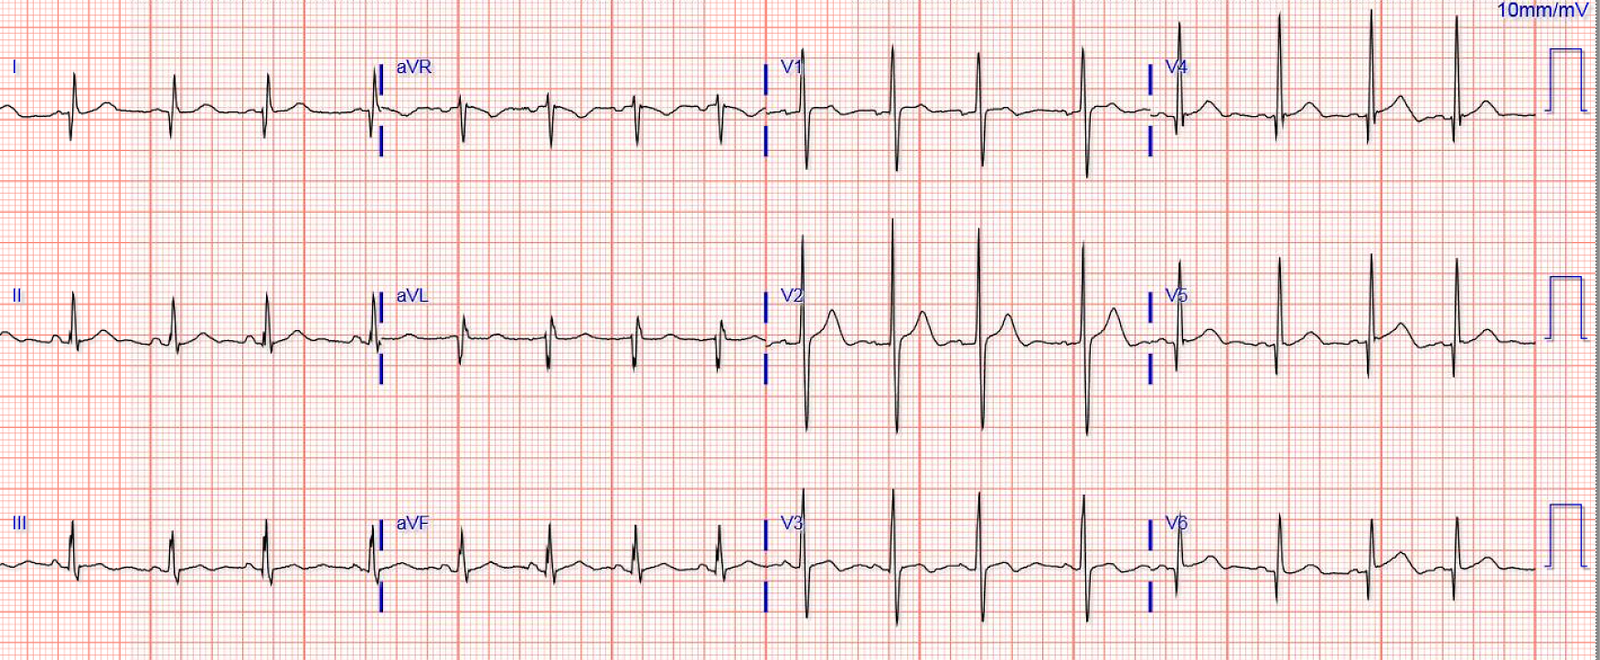
This ECG was recorded 26 minutes later, just before the patient was transported to the cath lab:
 |
| Very interesting: 1. The ST depression in the inferior leads is gone, as is the STE in aVL, suggestive of reperfusion of the high lateral wall. 2. There is T-wave inversion in aVL, also suggestive of reperfusion. 3. V3 has developed terminal QRS distortion (loss of S-wave), suggestive of evolution of injury to the anterior wall. 4. There are the beginnings of Q-waves in V2-V4 Thus, it appears as if there has been worsening of the anterior wall and reperfusion of the high lateral wall. |
My interpretation when I saw this was that the LAD thrombosis was at the ostium of the first diagonal (D1) and that it had partly reperfused, leaving D1 open and the LAD still occluded.
A 100% proximal LAD occlusion was found, with left-to-left collaterals (from the circumflex) perfusing the 1st diagonal. This explains the reperfusion of the high lateral wall.
Here is the next day ECG:
 |
| Reperfusion T-waves in I and aVL, and V2. Some persistent, minimal, ST elevation. |
Peak Troponin I: 99 ng/mL (very high)
Echo:
The estimated left ventricular ejection fraction is 50%
The estimated pulmonary artery systolic pressure is 39 mmHg + RA pressure.
Regional wall motion abnormality-distal septum anterior and apex akinetic
.
Regional wall motion abnormality-inferolateral (from previous STEMI).
Normal estimated left ventricular ejection fraction lower limits of normal.
Note there is no lateral wall motion abnormality because of the reperfusion, through collaterals, of that wall