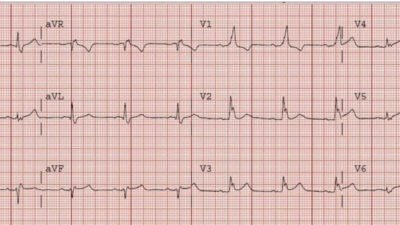
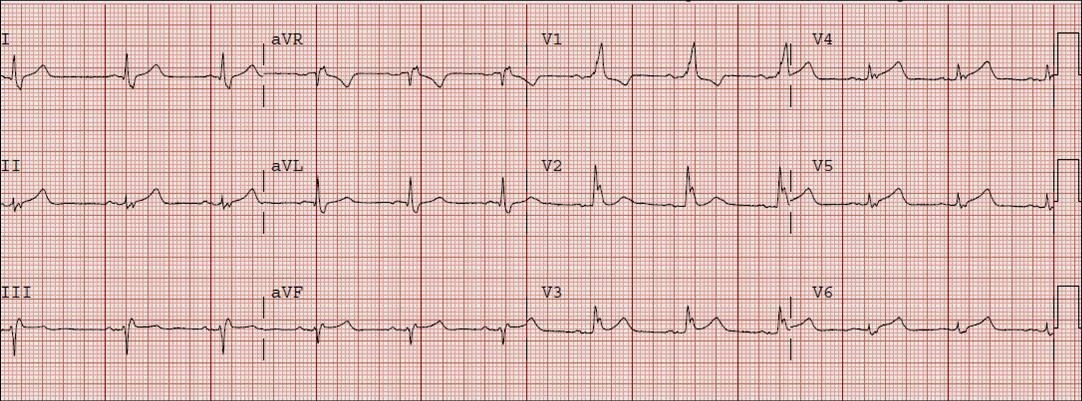
A 62 yo male with h/o CAD and stent in 1st OM presented with Chest pain while biking. Vitals were normal. An ECG was recorded:
What do you think?
There is Right Bundle Branch Block (with LAFB also?) with large R-wave in V1 (the first R wave of the rsR’ is not present) and wide S-wave in lateral leads I, aVL, V5 and V6. There is a slight amount of ST elevation (1 mm) in lead V3, and slightly more in V4-V6. The T-wave is upright in leads V2 and V3. Usually, but not always, RBBB has an inverted T-wave with up to 1 mm ST depression in leads V2 and V3, so these upright T’s with slight ST elevation is highly suspicious for anterior STEMI.
Most importantly, there are hyperacute T-waves in V4-6 that is diagnostic of LAD OMI. The ST elevation in V4-6 is additionally diagnostic.
I activated the cath lab emergently.
The Queen of Hearts Diagnoses OMI (STEMI Equivalent):
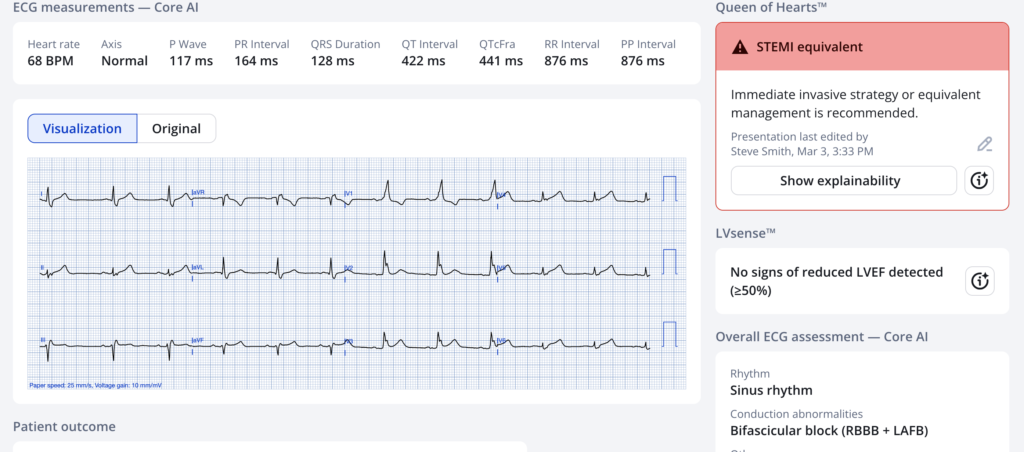
New PMcardio for Individuals App 3.0 now includes the latest Queen of Hearts model and AI explainability (blue heatmaps)! Download now for iOS or Android. https://www.powerfulmedical.com/pmcardio-individuals/ (Drs. Smith and Meyers trained the AI Model and are shareholders in Powerful Medical). As a member of our community, you can use the code DRSMITH20 to get an exclusive 20% off your first year of the annual subscription. Disclaimer: PMcardio is CE-certified for marketing in the European Union and the United Kingdom. PMcardio technology has not yet been cleared by the US Food and Drug Administration (FDA) for clinical use in the USA.
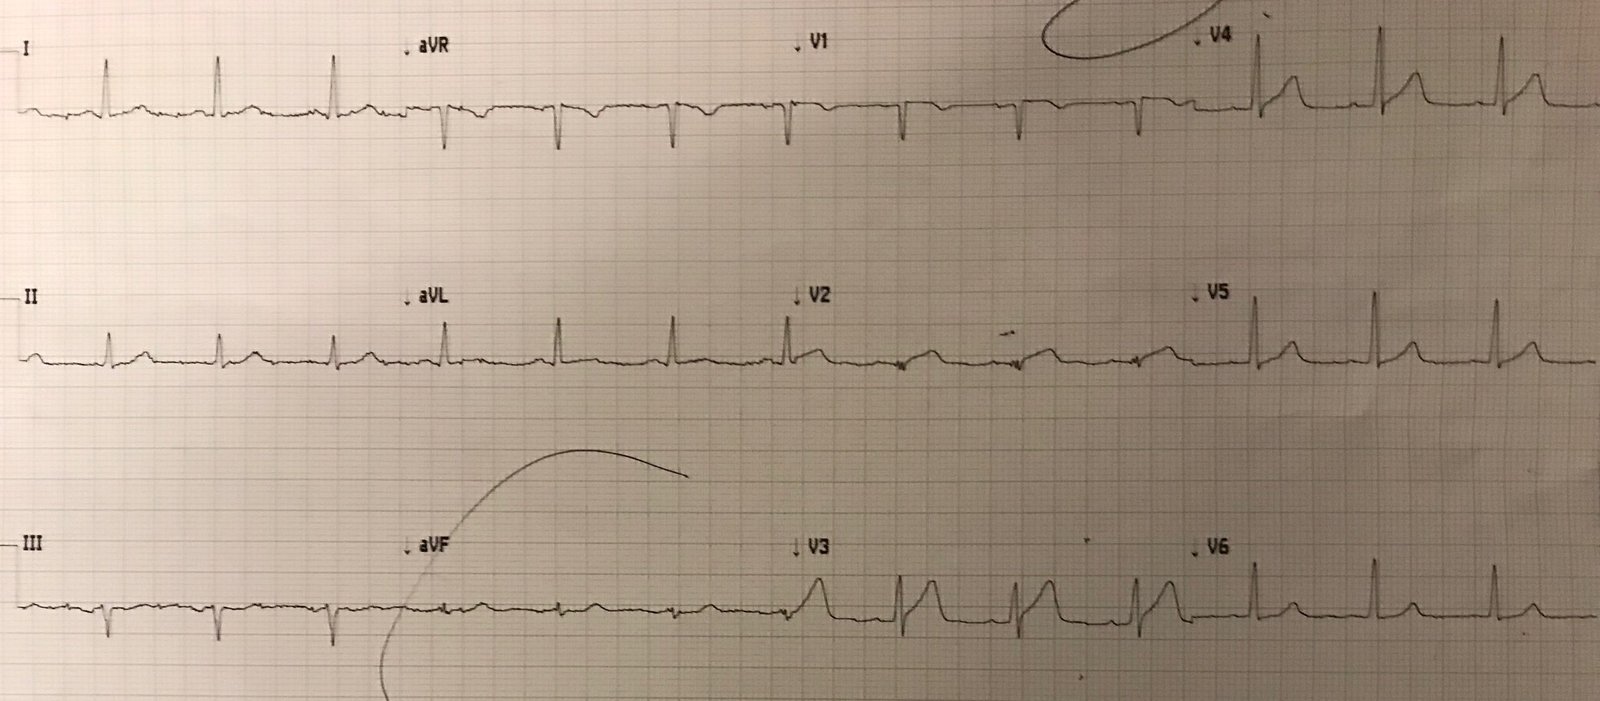
In this case, the diagnosis was particularly easy because there was a prior ECG available:

Here the normal baseline is easy to see for comparison. There was an rsR’ before (now the first R may be lost because of anterior wall ischemia), there was T inversion (normal) and ST depression (normal) in V2 and V3. There was no ST elevation in lateral leads (there never should be in RBBB).
The cath result was complex, but suffice it to say that there was TIMI-2 flow in the LAD by the time of cath.
= = =
======================================
MY Comment, by KEN GRAUER, MD (3/3/2026):
As per numerous posts on Dr. Smith’s ECG Blog — the ECG diagnosis of acute OMI in association with LBBB or RBBB may be challenging. That said — attention to the history, with an “eagle eye” for identifying acute ST-T wave abnormalities will surprisingly often provide the necessary clues to enable a definitive diagnosis.
- Today’s case provides an excellent example.
= = =
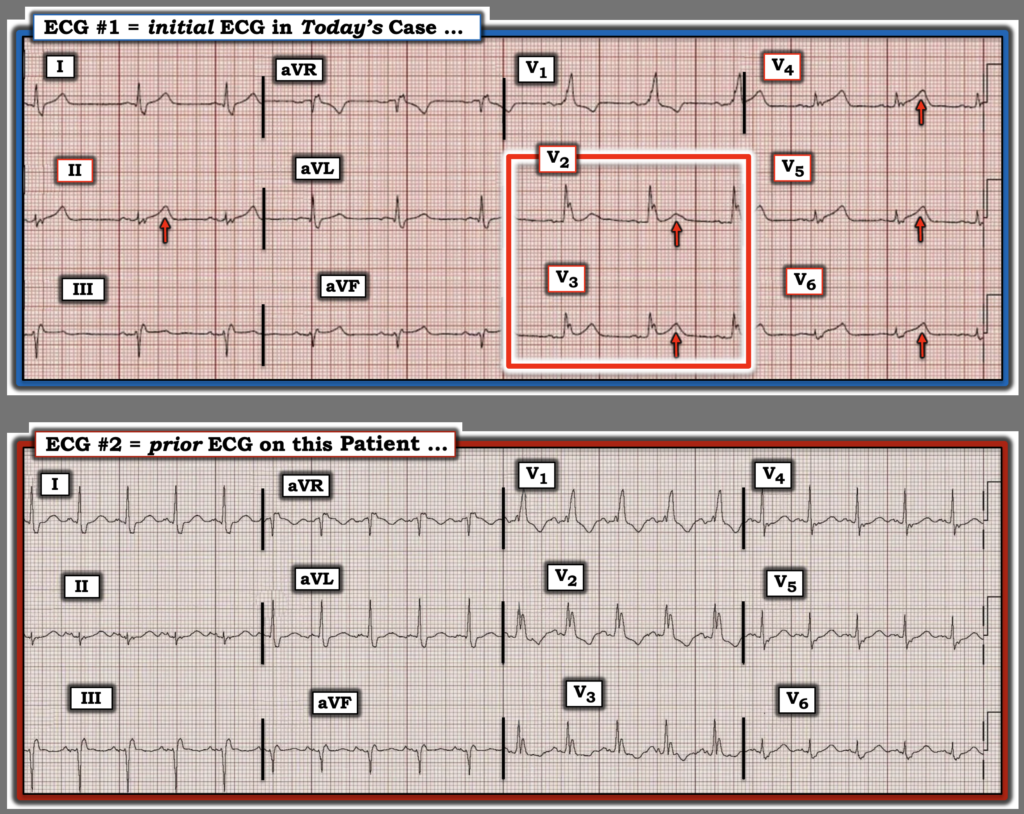
For clarity in Figure-1 — I’ve reproduced the 2 ECGs in today’s case. As per Dr. Smith — despite the presence of RBBB in today’s initial ECG — a definitive diagnosis of an acute OMI should be forthcoming from this tracing — even before access to a prior ECG on this patient was found:
- The history is suggestive: This 62yo man has a history of known coronary disease — and presented to the ED with new-onset CP (Chest Pain) — therefore, immediately placing him in a much higher-risk group for an acute cardiac event.
- My “eye” was immediately drawn to the hyperacute T waves in leads V2 and V3 (within the RED rectangle in Figure-1). The KEY point to recognize is that although there is no ST elevation and the T wave in lead V2 is small — in a patient with new CP, this is clearly an abnormal appearance for the ST-T wave in lead V2 in a patient with RBBB (because the ST-T wave should normally be oppositely directed to the last QRS deflection in anterior leads with RBBB).
- Confirmation that this abnormal ST-T wave appearance in lead V2 is “real” — is forthcoming from the slight-but-real ST elevation that should not be there in neighboring lead V3.
- The presence of hyperacute T waves becomes even more obvious in the remaining chest leads ( = leads V4,V5,V6) — in which T wave amplitude exceeds the amplitude of the tiny QRS complexes in these leads. Fitting with hyperacuity — Note the extensive “area” under these overly tall T waves (which are clearly disproportionately tall considering the tiny QRS amplitude).
- And, going back to lead V1 — although the ST-T wave is oppositely directed as it should be to the all-positive R wave in lead V1 — Considering what we see in the next 5 chest leads, I suspect the amount of J-point depression in lead V1 is less than what we would have seen had there been the expected amount of ST-T wave depression that is typically seen in neighboring leads V2,V3 when RBBB is uncomplicated by “something acute”.
- Limb lead findings are less dramatic in Figure-1 — but are nevertheless marked by the hyperacute T wave in lead II (that looks very similar to the hyperacute T waves in leads V4,V5,V6) — and the more subtle but still definitely elevated ST segments in leads III and aVF. (Note: Small q waves are present in high-lateral leads I and aVL — but these are likely to be normal septal q waves, and ST-T waves in these lateral leads do not look acute).
- Impression of ECG #1: In this patient with known coronary disease, who now presents with new CP — We see hyperacute T waves across the precordial leads — with abnormalities in 9/12 leads ==> ECG #1 is diagnostic of acute LAD OMI until proven otherwise.
Lead-by-Lead Comparison in Figure-1 between ECG #1 and ECG #2 removes all doubt.
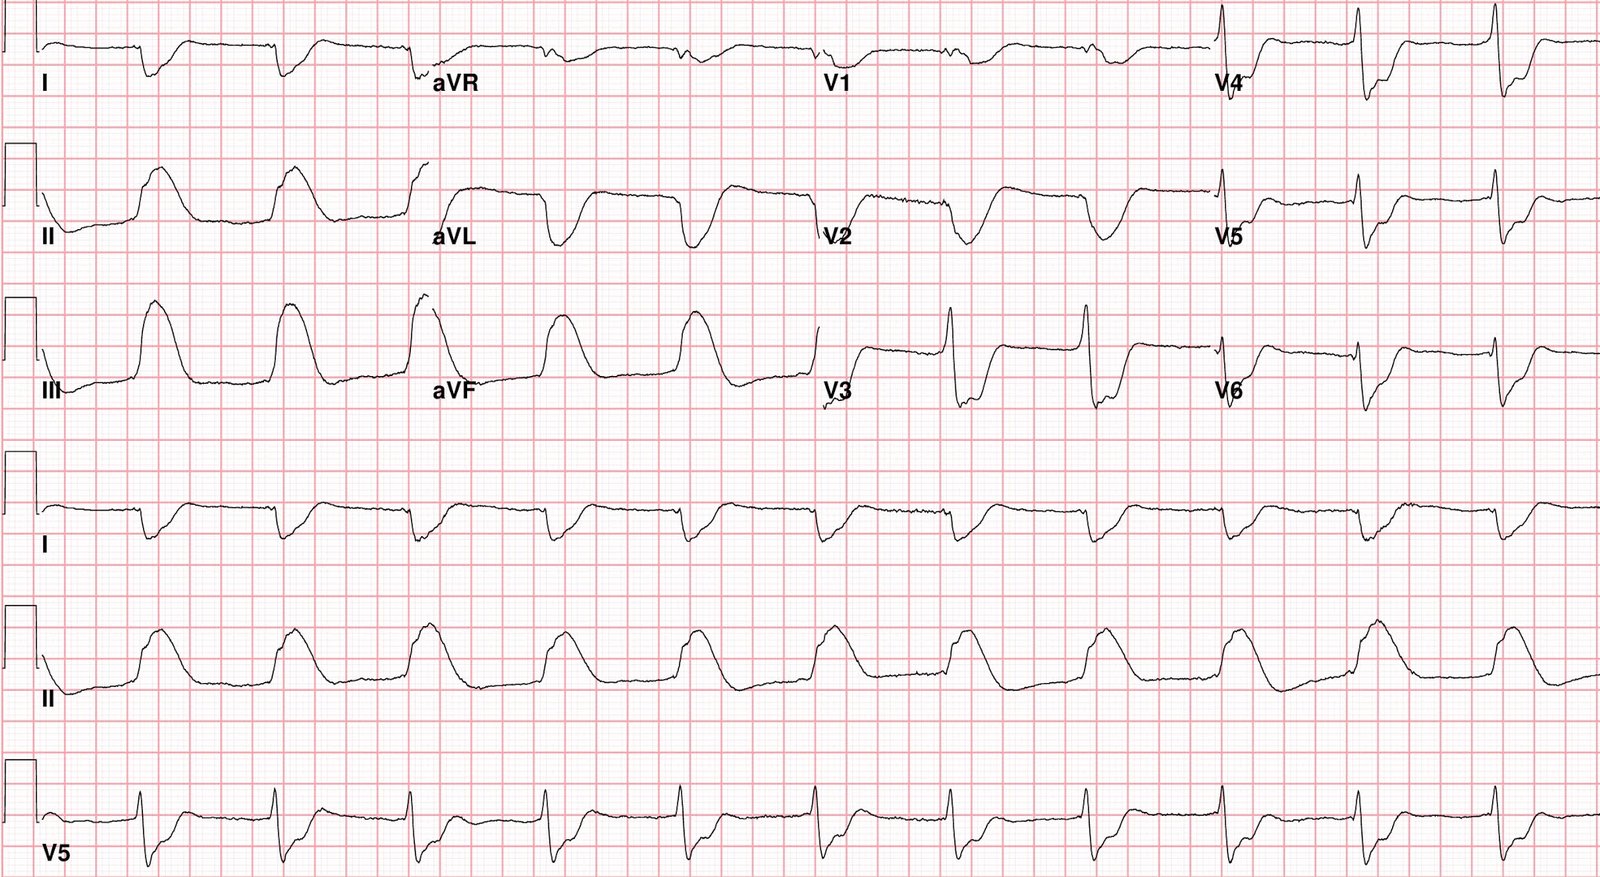
- To emphasize that although we do not know the clinical circumstances present at the time ECG #2 was recorded (ie, considerable sinus tachycardia is present in ECG #2) — there is no denying the interval change in ST-T wave appearance between the 2 tracings.
= = =
Figure-1: I’ve reproduced the 2 ECGs from today’s case.
===
= = =