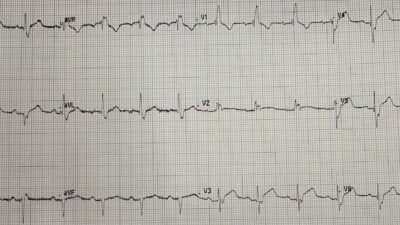
A 40-something woman with no previous medical history presented in the wee hours with 4 hours of chest pain. The pain had been intermittent for one week, but she attributed it to something she had eaten. An ECG was recorded at triage:

Conventional computer interpretation

What do you think?
The ECG is diagnostic of LAD Occlusion (OMI), and also of STEMI! There is 1 mm of ST Elevation (STE) in lead V1. There is 1.5 mm STE in lead V2. (STEMI criteria for women are 2 consecutive leads with STE of 1 mm in all leads, except for 1.5 mm in V2 and V3) Therefore, this ECG meets STEMI criteria!! It is true that many normal ECGs have STE, so just because it meets STEMI criteria does not automatically mean it is OMI.
However, there is an abnormally large T-wave in V1. There is a definitely hyperacute T-wave in V2. Hyperacute T-waves are NOT measured by their amplitude, but by 1) their “bulkiness” (area under the curve relative to QRS amplitude and 2) by increased symmetry. The one in V2 is VERY bulky. THIS CANNOT BE ANYTHING ELSE! There is a bit of reciprocal ST depression in II and aVF. ECGs with normal ST Elevation do NOT have ST depression anywhere else except aVR!!
This ECG is diagnostic of LAD Occlusion AND of STEMI, by definition!!
The Queen of Hearts knows immediately.

New PMcardio for Individuals App 3.0 now includes the latest Queen of Hearts model and AI explainability (blue heatmaps)! Download now for iOS or Android. https://www.powerfulmedical.com/pmcardio-individuals/ (Drs. Smith and Meyers trained the AI Model and are shareholders in Powerful Medical.)
Her raw AI output model value is 0.84. Anything over 0.50 is 98% specific, and above 0.83 is highly confident (even more specific). 1.00 is 100% specific. So she is VERY certain.
It was shown to the EM provider who did not recognize OMI.
Approximately 2 hours later, the first troponin I returned at 1971 ng/L, and another provider who is particularly skilled at OMI interpretation recognized LAD OMI.
She became short of breath. A bedside ultrasound showed many B-lines of Acute Pulmonary Edema. She was put on BiPAP. The cath lab was activated.
The pretest probability of OMI in a patient with one week of stuttering chest pain followed by constant chest pain then pulmonary edema is by itself a slam dunk.
The cardiologist agreed that she should go to the cath lab given the story and the clinical presentation, though noted that “the ECG is not a slam dunk STEMI”
We frequently hear that “It’s not a STEMI” when a real OMI does not meet STEMI criteria, but you would think that a real STEMI-OMI would be indeed a slam dunk.
The provider recorded another ECG 2 hours after the first:

Now it is even more obvious.
She required intubation for pulmonary edema before angiogram.
Angiogram:
“Briefly, 49 yo female with no prior coronary history who now presented with intermittent chest pain and EKG findings suggestive of an acute coronary syndrome.”
Even now, the interventionalist won’t call the ECG findings diagnostic of an acute coronary occlusion (OMI); rather, it is only “suggestive of ACS”.
Result: LAD: ostial mild eccentric stenosis. Then mid thrombotic LAD occlusion (100%, TIMI 0)
Echocardiogram:
Mildly decreased left ventricular systolic function with an estimated EF of 41%.
Regional wall motion abnormality–mid to apical anterior, mid anteroseptal, apical septal, apical inferior, and apical lateral akinesis.
Troponin profile:

So the patient had a very large MI due to acute coronary occlusion and the door to balloon time was delayed by at least 2 hours.
ECG after PCI

Diagnotic of reperfusion.
An echo a couple days later showed sigificant recovery of function (some of the myocardium was stunned but not infarcted). EF recovered to 55%, but it was probably 70% before the infarct.
Learning Points:
- Even STEMI which meet STEMI criteria can be difficult to recognize on the ECG.
- Use the Queen of Hearts. She will get BOTH STEMI-OMI and Non-STEMI OMI to the cath lab faster, with fewer false positives.
- We have a paper under review that shows that what determines the final diagnosis of “STEMI” vs. “NSTEMI” is not whether there was diagnostic ST Elevation, nor whether there was acute coronary occlusion, but whether the patient had a door to balloon time less than, or greater than, 120 minutes.
======================================
MY Comment, by KEN GRAUER, MD (7/19/2025):
I found today’s case instructive by the oversights that were made. Some of these oversights are quite subtle, though others not as subtle. But I thought it instructive to review the subtle — and the not-so-subtle oversights that I noted when reading this case, with the constructive goal of learning from them.
- How many of these oversights did YOU pick up on?
General Learning Points:
Consider the following:
- The history provides us with a clue of what we might expect. Today’s patient describes a history of intermittent CP (Chest Pain) that occurred over the course of ~1 week — prior to the night that she was awakened with severe CP that lasted for 4 hours, and which prompted her presentation in the ED.
- Certainly the severe CP that awakened her and lasted for 4 hours, prompting her ED visit — could represent an acute event. But it’s also possible given the above history — that a cardiac event could have occurred at any time over that previous week when the patient was having intermittent CP (that is not described in any further detail in the notes available to us).
- Relevance of the above to Today’s Case? — If today’s patient is having (or had) an event — and/or is having intermittent spontaneous opening-and-closure of a “culprit” artery — We should prepare ourselves for seeing anything on her initial ECG, including the possibility of reperfusion T waves and/or some degree of pseudonormalization (if there is intermittent ongoing spontaneous opening-and-closure of a “culprit” vessel).
- The initial Troponin in today’s case came back significantly elevated ( = 1971 ng/L) — which, with the above history means the patient has infarcted. Given the “rear-view mirror” perspective that Troponins provide (as to what happened hours or longer ago) — the initial ECG needs to be interpreted in this light (ie, The initial ECG might manifest an acute picture — or more of a subacute picture — or a much less impressive picture if this patient’s event was more than days old and ECG findings have mostly resolved).
- The repeat ECG was not done until 2 hours later — and then, apparently only because the initial Troponin came back elevated. Regardless of whether or not anything was seen on the initial ECG — given the history of this patient presenting to the ED for 4 hours of severe CP that began in the wee hours — a 2nd ECG should be done within no more than 15-30 minutes after the initial ECG.
- Around the time that the initial Troponin value came back, we are told that, “the patient became short of breath” — and was found to be in acute pulmonary edema. While impossible to tell without access to more complete chart records — We should wonder if there were signs of progressive dyspnea during those 2 hours since admission, during which time no repeat ECG was obtained. Are there lessons to be learned here about the care of this patient that might benefit the care of future patients?
- Finally, as per Dr. Smith — even after seeing the 2nd ECG, and seeing the significantly elevated Troponin, and seeing the development of acute pulmonary edema — the interpretation by cardiology was, “EKG findings ‘suggestive’ of an acute coronary syndrome”. Hard to imagine what it might take to call the events in this case not just “suggestive” — but rather diagnostic of an acute MI …
The First 2 ECGs in Today’s CASE:
We are told that the initial ECG in today’s case “was not recognized as OMI” — but we are not told what the interpretation of this initial tracing was. For clarity in Figure-1 — I’ve reproduced the first 2 ECGs in today’s case.
- As per Dr. Smith — the irony of today’s case is that millimeter-based STEMI criteria are actually satisfied (despite cardiology insistence on STEMI criteria before taking a patient to the cath lab — yet not recognizing that STEMI criteria are actually satisfied in ECG #1).
- But regardless of whether or not the initial ECG represents an actual STEMI in this patient who was awakened by severe CP — this tracing needs to be promptly recognized as providing clear indication to immediately activate the cath lab.
- As was Dr. Smith — my “eye” was instantly drawn to leads V1 and V2 (within the RED rectangle in ECG #1). There are several reasons why we know within seconds that these 2 leads in ECG #1 indicate acute OMI until proven otherwise: i) In addition to the ST elevation described by Dr. Smith — there is clearly an abnormally straightened ST segment “takeoff” in both leads V1 and V2; — ii) There is no LVH! About the only time you might see this tall of a T wave in lead V1 and this much ST elevation in lead V2 in the absence of QRS widening and the absence of LVH (S waves in V1,V2 not nearly deep enough for there to be LVH) — is with acute infarction; — and, iii) There is T wave “imbalance” — with the T wave in lead V1 so much more positive than the upright T wave in lead V6 (See My Comment at the bottom of the page in the June 1, 2022 post for review on “Imbalance” of Precordial T waves).
- Support that the ST segment straightening and elevation in leads V1,V2 is real — is forthcoming from limb lead findings: i) Lead III is most strikingly abnormal given shelf-like straightening of the ST segment with marked terminal T wave positivity (with similar changes to a lesser degree being seen in lead aVF); — ii) The T wave inversion in lateral Lead aVL is most probably a reciprocal change to the ST-T wave appearance in lead III; — and, iii) The ST segment flattening with lack of any T wave at all in lateral lead I is clearly an abnormal finding.
- BOTTOM Line: Taken together — the combination of the above described ECG findings in this patient with new severe CP has to be interpreted as an acute OMI until proven otherwise (ie, with clear indication for immediate cath lab activation).
- Whether the T wave inversion in lead aVL, the ST flattening in lead I — and the distinct terminal T wave positivity in inferior leads III and aVF represent spontaneous T wave reperfusion changes? (from an initial event occurring days earlier when this patient’s symptoms began) is uncertain — but a definite possibility given the 1-week history, the initial Troponin = 1971 ng/L, and limitation of ST elevation in ECG #1 to leads V1,V2 of the chest leads.
- P.S.: Lead-to-lead comparison of the repeat ECG with the initial tracing — shows accentuation of the ST-T wave abnormalities in virtually each of the leads highlighted above (ie, there is now ST depression in each of the inferior leads, as well as in lead I — and there is clearly more ST elevation in leads V1,V2). This emphasizes the insightful point of how much easier it is to assess serial ECGs by lead-to-lead comparison when both tracings are next to each other.
==================================
Figure-1: Comparison of the initial ECG and the repeat ECG.