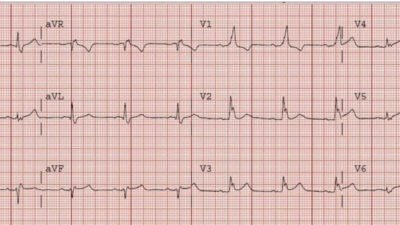
I saw this ECG lying around:
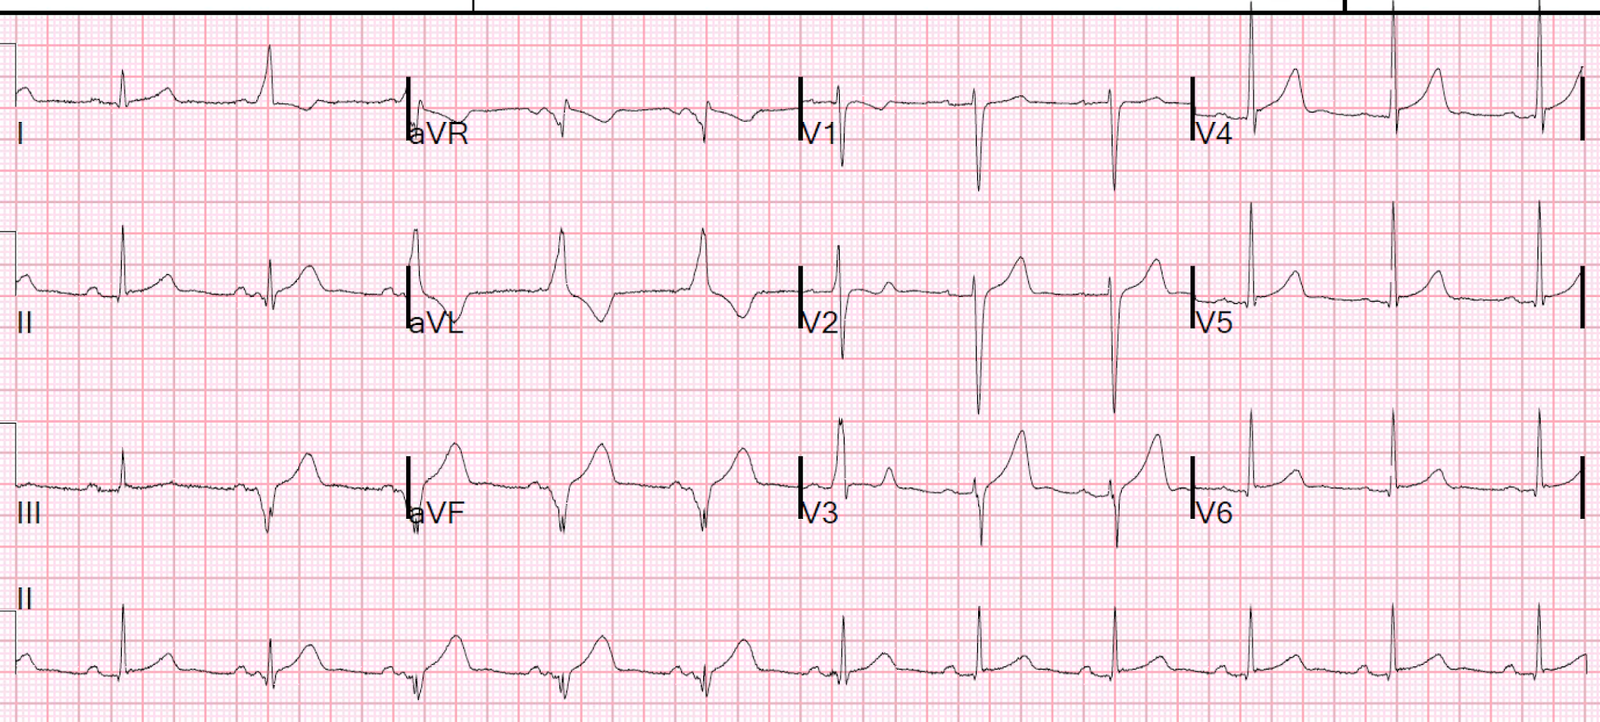 |
| The computer called this “normal” with no other comment. what do you think? |
It is amazing that the computer called this normal, as there are clearly abnormal QRST’s in beats 3, 4, and 5.
What are they?
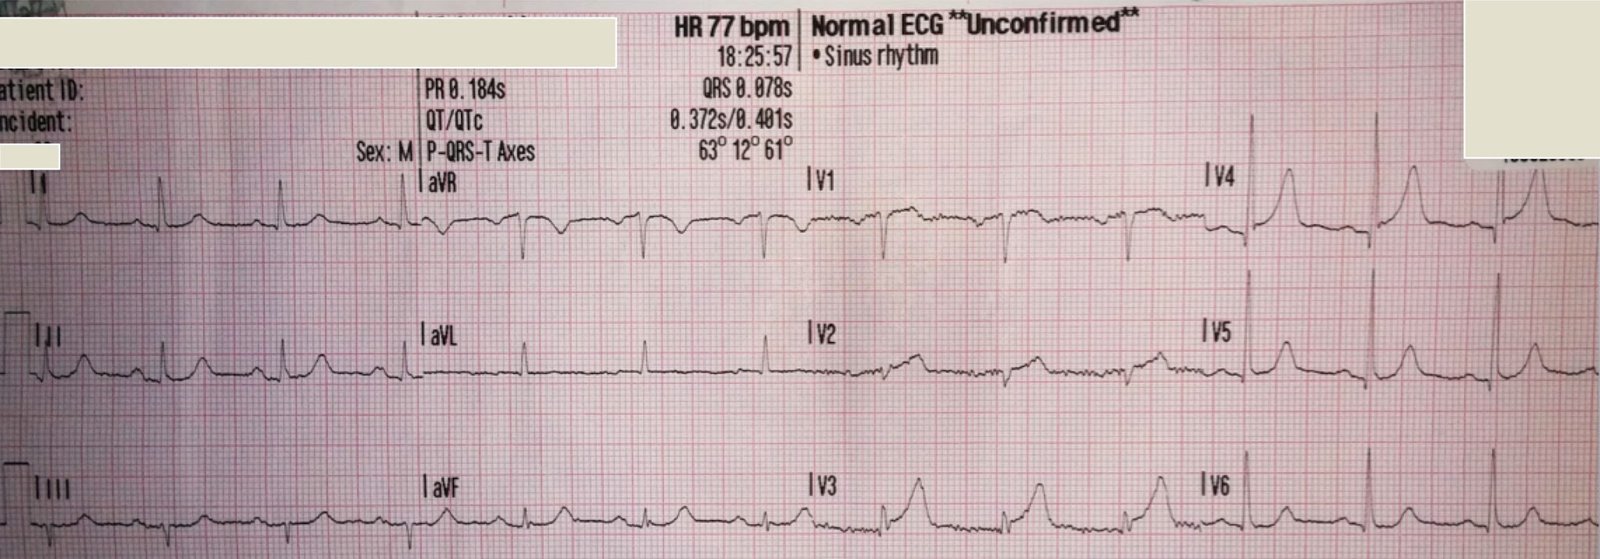
I looked the case up on the McKesson system because one can highlight the run of abnormal beats in lead II across the bottom (see red box) and then one is able to see these abnormal beats in all 12 leads:
 |
| Now what do you think? |
One could easily be fooled into thinking these are hyperacute T waves.
But the queen was not fooled by this into thinking it is OMI.
The PM Cardio app does diagnose WPW. The app called it Left anterior fascicular block. It clearly recognized it as not normal.

This is clearly WPW. Among these beats there is clearly a short PR interval and delta waves. The QRS is very abnormal due to the pre-excitation.
I looked at the patient presentation and it was unrelated (no tachycardia, no palpitations, etc.). The ECG findings were not recognized by the emergency physicians. The patient had been admitted to the hospital and no one had noticed. No final ECG interpretation had been placed in the record before the patient was discharged, and he was discharged without recognition of the diagnosis of WPW.
On record review, the patient had been seen in the ED in previous years for palpitations and the ECGs were actually normal, with no evidence of WPW. He had been diagnosed with anxiety (which he may indeed have, but it is common for patients with later-diagnosed SVT to be diagnosed with anxiety or panic attack). No doubt he had been having runs of tachycardia due to WPW.
I am certain that when the final read was placed by the interpreting physician that it would have been correct. In this instance, I put that final interpretation into the system, added the diagnosis, and notified the primary care physician.
Learning Point:
You cannot trust the computer interpretation! You must carefully look at every tracing yourself. Use the computer’s interpretation, but do not rely on it.
I suggest:
1. Read it yourself while hiding the computer interpretation
2. Then read the computer interpretation (it may see things that you did not)
3. Then look again
Dr. Ken Grauer has an excellent post on computer interpretations:
http://ecg-interpretation.blogspot.com/2016/05/ecg-blog-126-computerized-ecg.html
Also, see Ken’s insightful comments on this case below:
GREAT case Steve! Thanks for citing my ECG Blog #126, in which I review a practical approach for optimizing benefits of computerized interpretations. I am equally amazed as you in this case that the computer did not pick up on at least some abnormality … but the key for anyone who is less than a true ECG expert lies in your 1st suggestion = HIDE the computerized interpretation BEFORE you look at what the computer said. Had that been done, the WPW that is obvious on this tracing would not have been missed.
Often overlooked is the concept that patients who have an accessory pathway may conduct normally at some times and abnormally at other times. And sometimes, they may split the relative amount of conduction passing over normal and accessory pathways even from beat-to-beat (known as a “Concertina effect). The “good news”, is that finding a Concertina effect suggests a relatively longer refractory period for the accessory pathway — and therefore a relatively lower risk of sudden death (http://casereports.bmj.com/content/2013/bcr-2013-009328.full ).
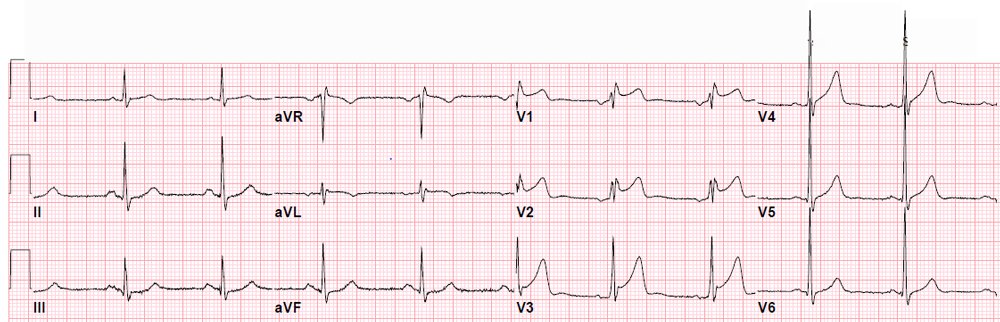
The interesting thing to me is how the 2nd beat in the long rhythm strip in your example would look relatively “normal” by itself. However, when compared to the 1st beat in the rhythm strip, we clearly see the difference. So there is FUSION between normal conduction (PQRST morphology of the 1st beat) — and purely conducted WPW beats ( = beats #3,4,5). Note how there once again is a different degree of fusion for the 6th beat in the long lead II rhythm strip. So we are alternating between normal and accessory-pathway conduction in this rhythm strip … Note also how differently delta waves appear in different leads. Delta waves are EASY to recognize in leads I and aVL (because they are positive). Delta waves are negative in leads III and aVF — and in lead II to we see a multiphasic almost isoelectric initial component to the delta wave. It is because of some fusion with normal conduction and this near isoelectric delta wave appearance that by themself, it would be difficult to identify WPW from beats that look like beat #2 and beat #6 in the long lead rhythm strip.