My very smart colleagues are getting very good at this!
A male in his 40’s with a significant history of coronary disease and stents called 911 for sudden onset “terrible” left sided chest pain radiating to the jaw, with diaphoresis and vomiting. He appeared very uncomfortable.
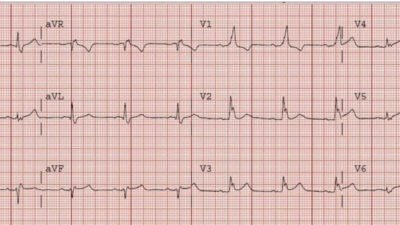
Here is his prehospital ECG, recorded approximately 15 minutes after onset of pain:
 |
| Normal |
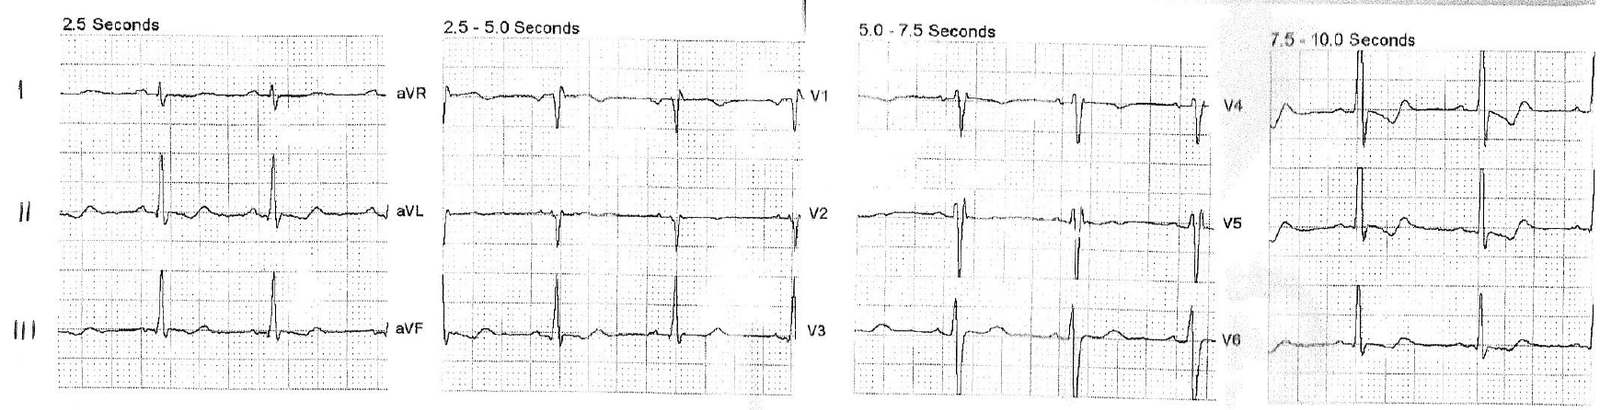
On arrival, another ECG was recorded 16 minutes after the prehospital ECG, approximately 30 minutes after the onset of pain:
 |
| There is a normal amount of ST elevation in V2-V4. However, it is greater than in the prehospital ECG. Upward concavity in all of V2-V6, no reciprocal ST depression, no Q-waves, no T-wave inversion. The computerized QTc is 387 ms. The LAD occlusion formula value, using: ST Elevation at 60 ms after the J-point = 3 mm Computerized QTc = 387 ms R-wave amplitude in V4 = 9.5 mm Formula = 23.32 This is just below the cutoff of 23.4, which would make LAD occlusion very likely. I consider any value above 22.0 as suspicious, and needing serious evaluation. |
_____________________________
Dr. Ken Grauer added the following nice points:
I would make the following points regarding serial ECGs in this case. ECG #1 is normal. One needs to compare serial tracings by going lead-to-lead. Even without use of the formula — there ARE changes that should be readily apparent from lead-to-lead comparison between ECGs #1 and 2. That is in V1 — the T wave is now positive in ECG #2; in V2 — the T wave is now disproportionately tall with respect to the QRS in this lead, and the J-point is now elevated; in V3 — both QRS complexes now show clear ST elevation with what looks like broadening of the T wave base, compared to relatively normal appearing ST-T waves in ECG #1. Given the history in this case — this lead-to-lead comparison should be more than enough to prompt immediate cath. That the formula has now become positive supports this clinical decision.
____________________________________
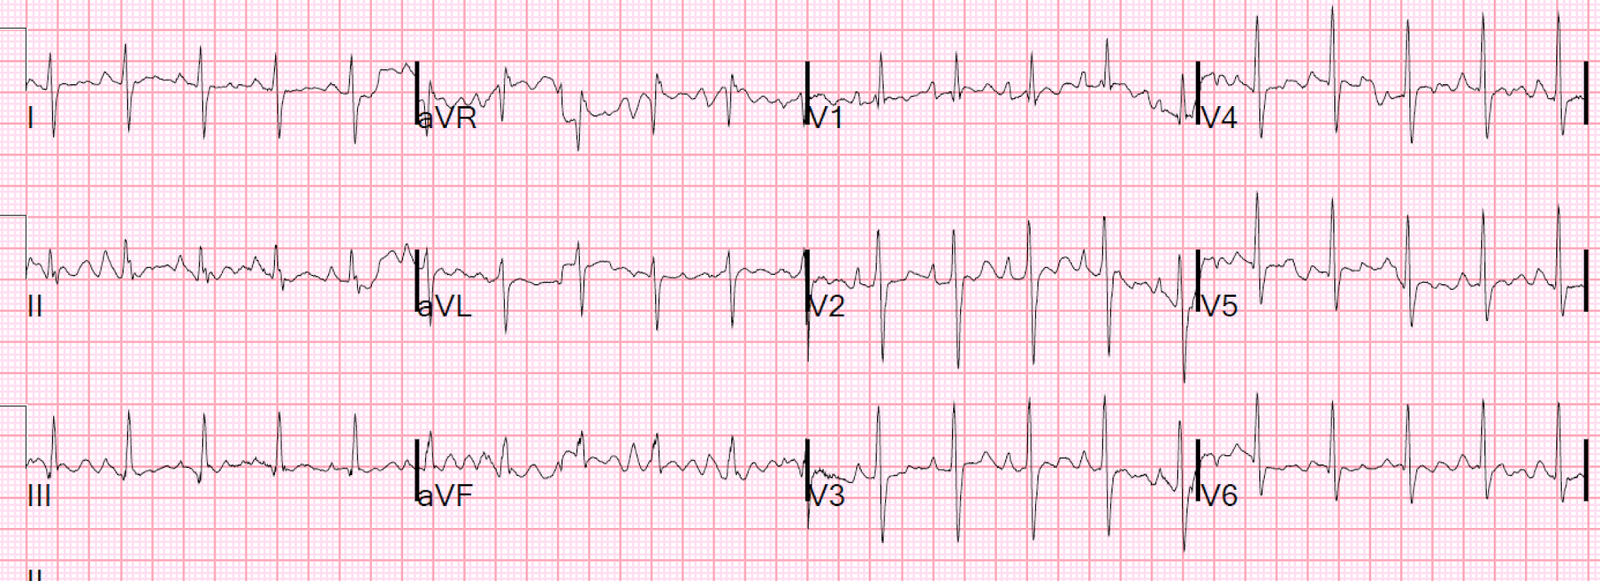
There was an old ECG for comparison from 8 months prior:
 |
| This has less than 0.5 mm STE in V2 and V3. This is a significant change. |
So there is a change in the ST elevation.
Kambara (see below) showed that early repolarization is dynamic; see this case and discussion:
Increasing ST elevation. STEMI vs. dynamic early repolarization vs. pericarditis.
However, in this case:
1. The formula is nearly diagnostic
2. There is definite increase in ST elevation
3. The patient has a classic clinical presentation for anterior MI
Possible Management Strategies:
1. It is very early in the patient presentation, and there has not yet been time for much ECG evolution. Therefore, serial ECGs may be particularly useful
2. Do bedside cardiac ultrasound. If there is clear wall motion abnormality, then activate cath lab. If none, then do formal contrast echo or, if unavailable, then speckle tracking echo cardiography.
3. The ACC/AHA does recommend emergent angiogram for patients with ongoing, refractory chest pain and high suspicion of coronary syndrome, even in the absence of ECG or biomarker evidence of ischemia. In this case, there is even very good ECG evidence.
As with 50% of STEMI, the initial troponin was negative (Initial cTnI = 0.028 ng/mL, 99% upper reference level = 0.030 ng/mL).
My very astute colleagues simply activated the cath lab after giving aspirin, heparin and ticagrelor. The interventionalist was skeptical but gladly took the patient to the cath lab.
Here is the cath report:
–Culprit Lesion (s): 90% ruptured plaque in mid LAD proximal to the previously placed stent; initial flow in distal LAD TIMI III
–The right coronary is occluded – in-stent – at the aortic ostium in the presence of L to R collaterals
The interventionalist remained skeptical even after the angiogram:
“Unstable angina/ACS with putative mid-LAD culprit (90% stenosis with TIMI III flow on initial angiography) – recommend continued troponin levels to define whether the current event represented an acute myocardial infarction. Suspect chronic total occlusion of the ostial RCA (instent)”
Post PCI ECG:
 |
| All the previously noted increase in ST Elevation has resolved.QTc = 379 ms This proves that the ST elevation was indeed due to ACS. At the time of the ECG, there would have been TIMI 0 or 1 flow, but spontaneous reperfusion occurred, aided by adjunctive pharmacotherapy (ASA, heparin, ticagrelor) What is the post-angiogram formula value? |
Here is the subsequent formal echo:
The estimated left ventricular ejection fraction is 67 %.
Normal estimated left ventricular ejection fraction .
Left ventricular hypertrophy concentric .
Regional wall motion abnormality-anterior hypokinetic.
Here is the next day ECG:
 |
| There was such rapid and complete reperfusion that no reperfusion T-waves (Wellen’s waves) did not evolve. This is somewhat unusual in patients who have a significantly elevated troponin. Troponin I peaked at 4.44 ng/mL |
Learning Points:
1. Pre-test probability is critical (here there is history of CAD and very typical presentation, with sudden onset, vomiting, and diaphoresis)
2. Use the Subtle LAD occlusion formula
3. Compare with previous ECG
4. Record serial ECGs
5. Compare with the prehospital ECG
6. Interventionalists’ opinions are important, but not the gold standard (see reference below).
References
1. McCabe JM. Physician Accuracy in Interpreting Potential ST-Segment Elevation
Myocardial Infarction Electrocardiograms. J Am Heart Assoc. 2013;2:
e000268 doi: 10.1161/JAHA.113.000268
http://jaha.ahajournals.org/content/2/5/e000268.full.pdf+html
Although interventionalists performed the best among physician groups, there sensitivity for coronary occlusion in this study was 70% (specificity 89%).
All EKGs are at the end of this article and you can test yourself. I had 93% sensitivity and 100% specificity.
2. Kambara H, Phillips J. Long-term evaluation of early repolarization syndrome (normal variant RS-T segment elevation). Am J Cardiol 1976;38(2):157-61.
Kambara, in his longitudinal study of 65 patients with early repolarization, found that 20 patients had inferior ST elevation and none of these were without simultaneous anterior ST elevation. Elevations in inferior leads were less than 0.5mm in 18 of 20 cases. Kambara also found that, in 26% of patients, the ST elevation disappeared on follow up ECG, and that in 74% the degree of ST elevation varied on followup ECGs.