Which of the following 6 ECGs of patients with chest pain represent inferior OMI?
The answer could be 1 or more than 1.
1.
2.

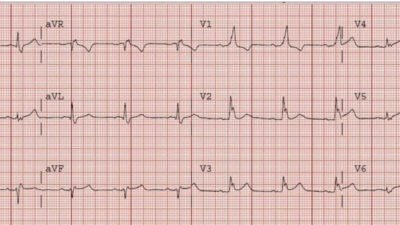
3.
![]()
4.
 |
| https://drsmithsecgblog.com/2011/10/inferior-st-elevation-what-is-diagnosis.html |
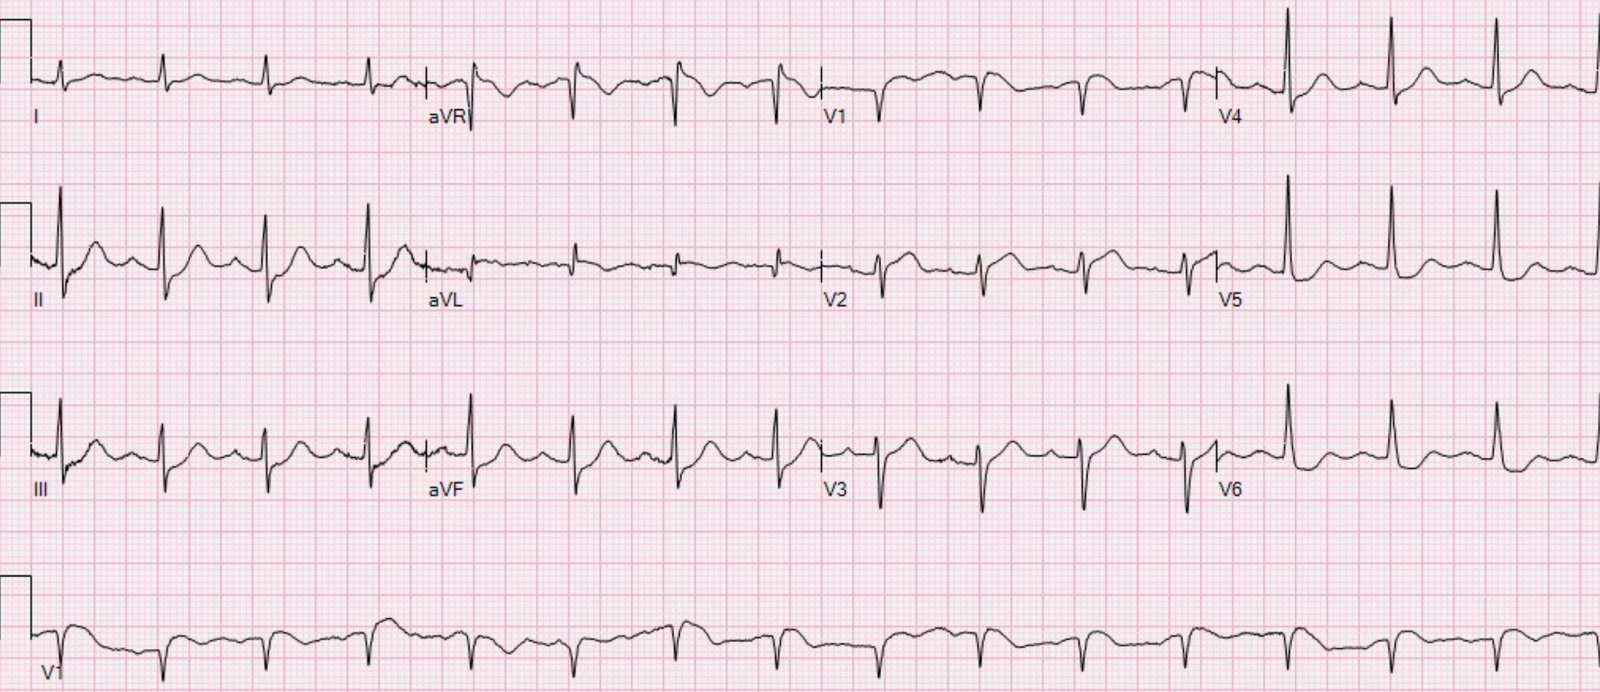
5.
 |
| https://drsmithsecgblog.com/2018/05/is-there-delayed-activation-wave.html |
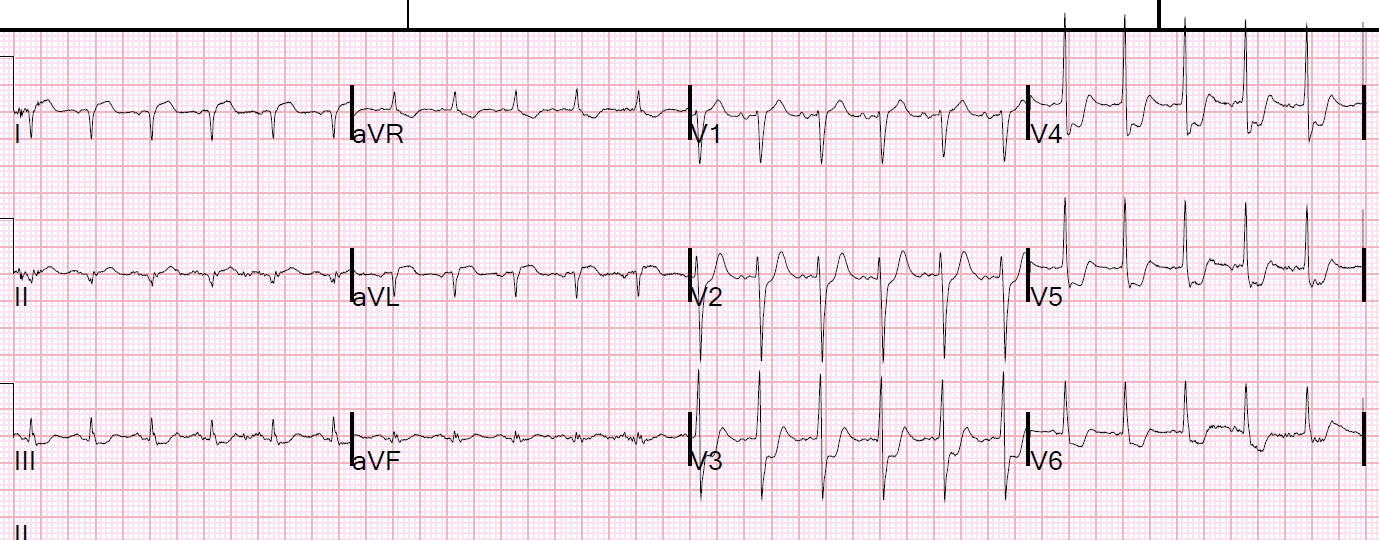
6.
 |
| https://drsmithsecgblog.com/2013/04/a-40-year-old-male-with-several-chronic.html |
Answer:
3. and 5. are inferior OMI
1., 2., 4., and 6. are limb lead early repolarization
Is it really possible to differentiate these?
Yes. Pendell did it easily getting 6/6 correct.
I put this post up because I just received number 3 from a former graduate. It is from an otherwise healthy middle-aged male with 2 episodes of brief stuttering epigastric and chest pain on the day before, then presented with 2 hours of constant pain.
Let’s look at it again:
![]()
Here is another from the same patient, slightly later, with arrows pointing out the hyperacute T-waves:

There is minimal inferior STE, but T-waves are massive in proportion to the QRS, there is ST depression, minimal, in aVL, and also some minimal ST depression in V4-V6.
The former resident activated the cath lab based on this ECG and, although the interventionalist was skeptical, he had experience with this ex-resident making some very good calls in the past and so he agreed.
There was a 95% thrombotic RCA lesion that was stented.
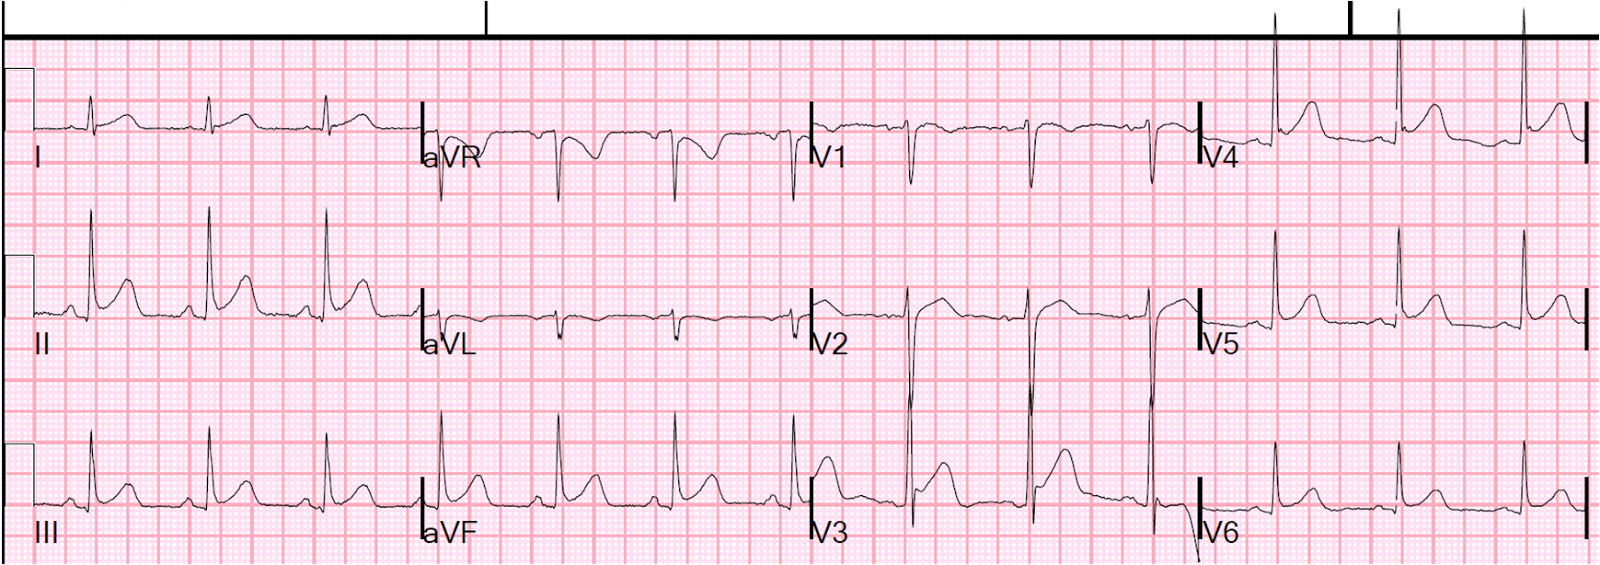
Finally, this is an extra one that I put on Twitter and Facebook to promote the post:
 |
| The answer, with Ken’s comments too, are at the post:An ECG sent to me with concern for hyperacute T-waves |
![]()
===================================
MY Comment by KEN GRAUER, MD (2/1/2020):
===================================
This is a challenging case. In it, we are shown 7 tracings (the first 6 are numbered — the 7th was added at the end by Dr. Smith as a final example). Each of these patients presented to the ED with chest pain. Of these 7 tracings — 3 represent acute inferior OMI; the other 4 do not.
- QUESTION #1: Which ECG findings are common among the 4 tracings that did not represent acute inferior OMI?
- QUESTION #2: Which ECG findings are common among the 3 tracings that did represent acute inferior MI?
ANSWER: I fully acknowledge that I was not certain that the 4 non-OMI tracings were the result of a repolarization variant. In particular — ECG #6 showed fairly dramatic ST elevation in multiple leads.
- We are not told details of the history in any of these cases — beyond knowing that these patients presented to the ED with chest pain.
- Sometimes, it simply is not possible to be 100% certain from a single ECG if it represents acute OMI or not.
- IF the clinical scenario in which the “chest pain” is experienced is “right” — then other diagnoses (ie, acute myopericarditis) may be possible — and acute myocarditis can present with an ECG picture virtually identical to acute OMI.
The above said — each of the 4 tracings that did not represent acute inferior OMI ( = ECGs #1, 2, 4, 6) have the following ECG findings in common:
- They lack the “magical” mirror-image reciprocal ST–T wave relationship that is usually seen between lead III and lead aVL in acute inferior OMI (See My Comment in the 8/9/2018 post and the 10/6/2018 post in Dr. Smith’s ECG Blog, among many other times we have emphasized this finding!).
- Leads V2 and V3 do not at all suggest acute posterior involvement.
- The shape of ST elevation is upward sloping.
- There is J-point notching or J-point slurring in at least a couple of leads.
- The QTc is relatively short.
- Large Q waves are absent.
- Even when ST-T wave elevation is fairly marked — it is not localized to the inferior leads in these 4 tracings that do not represent acute inferior OMI.
- KEY: None of the ECG findings in the above 7 bullets are absolute. Nevertheless — the points described in these 7 bullets highlight ECG findings we look for when trying to distinguish between repolarization variants vs acute inferior OMI.
WHAT ABOUT the 3 Tracings that DO represent Acute Inferior OMI? For clarity — I reproduce these 3 tracings in Figure-1.
- What ECG findings do these 3 examples of acute inferior OMI have in common?
- HINT: The same 6 KEY leads in each of these 3 tracings show similar abnormal findings!
 |
| Figure-1: The 3 tracings in this post that DO represent acute inferior OMI (See text). |
Each of the 3 tracings that do represent acute inferior OMI ( = ECGs #3, 5, 7) have the following ECG findings in common:
- The ST-T wave is abnormal in each of the 3 inferior leads. It should be noted that inferior MIs are sometimes quite subtle — a feature accentuated in ECG #3 and ECG #7, in which QRS amplitude in the inferior leads is quite modest. When the QRS complex is tiny (as it is in leads III and aVF in ECGs #3 and 7) — then the “amount” of ST elevation will not be great. This is why — SHAPE is more important than amount!
- Looking closer — the ST-T wave is clearly hyperacute in leads II, III and aVF in ECG #3 — and in leads III and aVF in ECG #7. By this, I mean that considering QRS amplitude — the T waves in these leads are taller-than-they-should-be and fatter-at-their-peak with a base that is wider-than-expected.
- Admittedly — the ST-T waves in ECG #5 do not look nearly as worrisome as they do in ECGs #3 and #7. That said — there is ST elevation in each of the 3 inferior leads in ECG #5 — and there are other clearly worrisome findings on this tracing.
- The “magical” mirror-image opposite ST segment picture is seen between leads III and aVL in all 3 of these tracings with acute inferior OMI ( = ECGs #3, 5 and 7). This is true even in ECG #5 — in which the shallow-but-real depressed ST segment in lead aVL is the mirror-image opposite of the subtle-but-real ST elevation in lead III.
- Finally — Leads V2 and V3 in each of the 3 tracings in Figure-1 with acute inferior OMI show clear abnormalities that strongly suggest associated acute posterior involvement. Although subtle — there is slight-but-real J-point ST depression (or at least ST segment flattening) in each of these leads, whereas normally there should be slight gently-upsloping ST elevation. In addition, the T waves in leads V2 and V3 in both ECG #3 and ECG #5 look hyperacute. Lastly — the QRS complex in lead V3 in each of these 3 tracings shows a taller-than-expected R wave, which is another finding consistent with posterior infarction (CLICK HERE — for illustration of this concept).
BOTTOM LINE: When looking to determine IF there is acute inferior OMI — the 6 KEY leads that I focus on are the 3 inferior leads ( = leads II, III and aVF) — lead aVL (looking for reciprocal ST-T wave depression that is the mirror-image opposite of what we see in lead III) — and anterior leads V2 and V3 (looking for suggestion of acute posterior involvement(.
- Each of the 3 tracings in Figure-1 show abnormal findings in each of these 6 KEY leads.
- Abnormal (more subtle) findings are also found in some additional leads — but it is the 6 KEY leads that provide the most important information when looking to determine IF there is acute inferior OMI.
- The more leads that are clearly abnormal — the greater the likelihood that a patient with chest pain is having an ongoing acute cardiac event. With the exception of leads aVR and V1 — virtually all of the other 10 leads in each of the 3 tracings in Figure-1 show at least ST-T wave flattening, straightening, or slight depression — and, some of these other leads also manifest hyperacute T waves.
Our THANKS to Dr. Smith for posting this illustrative case!
![]()