This was contributed by Amandeep Singh, from Highland Hospital In Oakland CA.
A 54yo male presented to the ED with severe substernal chest pain lasting 15-20 min, associated with general weakness, mild dyspnea, and diaphoresis.
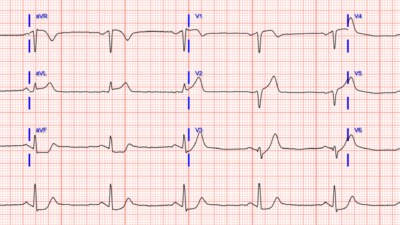
Here is the initial 12-lead ECG:
What do you think?
There is STE in V1, V2, aVR, and aVL. (There is also a hyperacute T-wave in V3). Otherwise, there is diffuse ST depression: in inferior leads and in V4-6. So there is a superior ST vector.
There is no question that this is a STEMI-OMI. But it is unusual in that the STE vector is directly superior, with reciprocal STD in inferior areas (V5-6 are at the level of the inferior part of the heart, at the apex).
There is a vaguely defined pattern here called “Northern OMI”. It is a STEMI pattern that is associated with subepicardial (“transmural”) ischemia of the BASE of the heart (the base is the top, just under the atria). In particular, it may be the base of the septum.
Key Features of Northern OMI
- ECG Findings: ST elevation in lead aVR and aVL, often with negative T-waves, combined with ST depression in inferior (II, III, aVF) and lateral (V4-V6) leads with positive or biphasic T-waves.
- Underlying Cause: Suggests acute occlusion of the left main coronary artery or proximal Left Anterior Descending (LAD) artery.
- Clinical Significance: Represents a severe form of acute coronary syndrome (ACS) where a significant portion of the heart muscle is at risk, often missed by traditional STEMI criteria.
- Diagnostic Importance: Aims to identify high-risk patients who need immediate cath lab activation for reperfusion, improving outcomes.
Amandeep (Deep) writes:
“This ECG is consistent with the recently described “northern occlusion myocardial infarction” pattern (1). When the ST vector points straight up (-90 degrees, or north), it can signify infarction of the upper northernmost portion of the heart with subendocardial ischemia in the inferior and low lateral regions of the heart. This pattern can be due to left main coronary occlusion, proximal left anterior descending artery occlusion, or multivessel coronary artery disease. The terminology “northern occlusion myocardial infarction” refers to the unique ST vector orientation associated with this OMI pattern.”
In this example, there is ST segment elevation in aVR, V1, and V2. Lead aVL has subtle ST segment elevation with T wave inversion and there is ST segment depression with an upright T wave in the inferior and low lateral leads.
The cath lab was activated.
Case Outcome/Cardiology Note:
Patient arrived to ED diaphoretic, clammy and altered. He was emergently taken to the cardiac catheterization laboratory where he had a weak thready pulse. He was found to have 100% occlusion of the left-main coronary artery with TIMI 0 flow. Flow was restored in the left-side, however, patient proceeded to have emesis and not protect his airway. He was intubated, but lost his pulse. He underwent CPR, but ultimately had PEA arrest and was pronounced at 12:06am.
1. Ricci F, Martini C, Scordo DM, Rossi D, Gallina S, Fedorowski A, Sciarra L, Chahal CAA, Meyers HP, Herman R, Smith SW. ECG Patterns of Occlusion Myocardial Infarction: A Narrative Review. Ann Emerg Med. 2025 Apr;85(4):330-340. doi: 10.1016/j.annemergmed.2024.11.019. Epub 2025 Jan 17. PMID: 39818676.
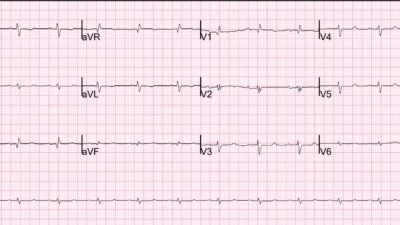
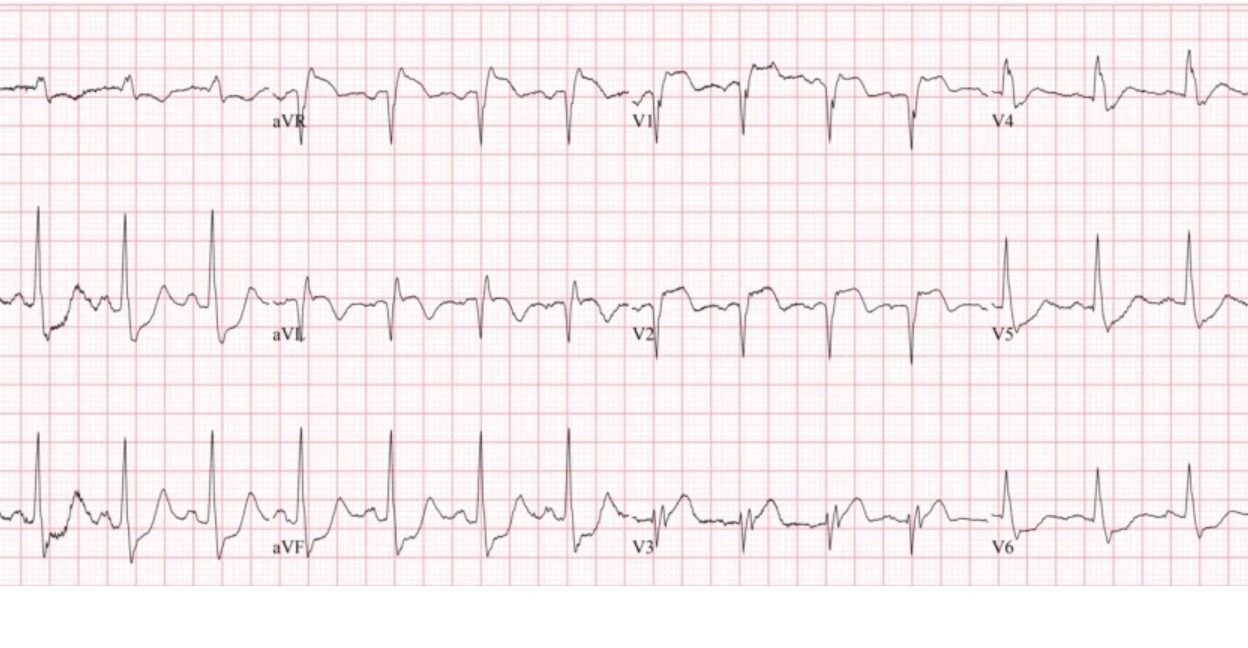
See here 9 examples of total left main occlusion (includes this one):
How does Acute Total Left Main Coronary occlusion present on the ECG?
= = =
======================================
MY Comment, by KEN GRAUER, MD (12/18/2025):
Predicting the “culprit” artery in an acute OMI can be challenging. Although in many cases — determination of the specific acutely occluded coronary artery does not alter management (ie, If you clearly know based on history and the initial ECG that regardless of which artery is the culprit — prompt cath will be needed!) — in selected cases, being able to accurately predict the “culprit” artery may be of tremendous assistance to the interventionist for determining where to look during the cath procedure for the vessel that needs reperfusion!
- We’ve shown too-numerous-to-count cases in Dr. Smith’s ECG Blog of tracings in which we can confidently predict acute RCA, LAD, or LCx occlusion (with us often being able to predict which LAD occlusions are proximal — and when RCA occlusions are also associated with acute RV involvement).
- PEARL: I’ve learned that when the initial ECG shows obvious acute occlusion — but with conflicting findings suggesting no clear indication as to which vessel is “the culprit” — that much of the time, the reason is that the patient has significant multi-vessel disease.
- The same is true for the uncommon acute LMain occlusions that survive to make it to the hospital — for which the multiple anatomic areas affected by difficult-to-predict contributions of ischemic myocardium, often attenuated (and sometimes completely cancelled out) by oppositely situated areas — make prediction by ECG of acute LMain occlusion so very challenging.
- The fact that the number of LMain occlusion cases that we see is so small (ie, in which the patient survives long enough to record an ECG) — makes collecting data exceedingly difficult.
The above said — I’ve synthesized the ECG findings collected by Dr. Smith from 9 anecdotal cases of complete LMain occlusion (published in the August 9, 2019 post) — into a summarizing Table in Figure-1.
- KEY Summarizing Points: It’s virtually impossible to predict what the ECG will look like in a patient with acute LMain occlusion.
- Lead aVR does not provide the answer.
- The above said — at least the findings in Figure-1 give us an idea of the possibilities.
= = =
Figure-1: Reasons for the varied ECG presentation of acute LMain occlusion — excerpted from Dr. Smith’s 8/9/2019 post (See text).

= = =
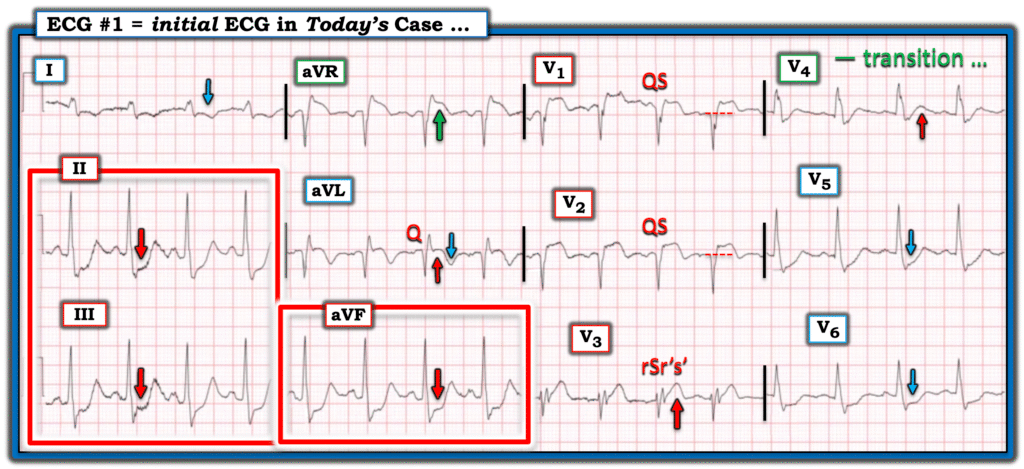
What about Today’s Initial ECG?
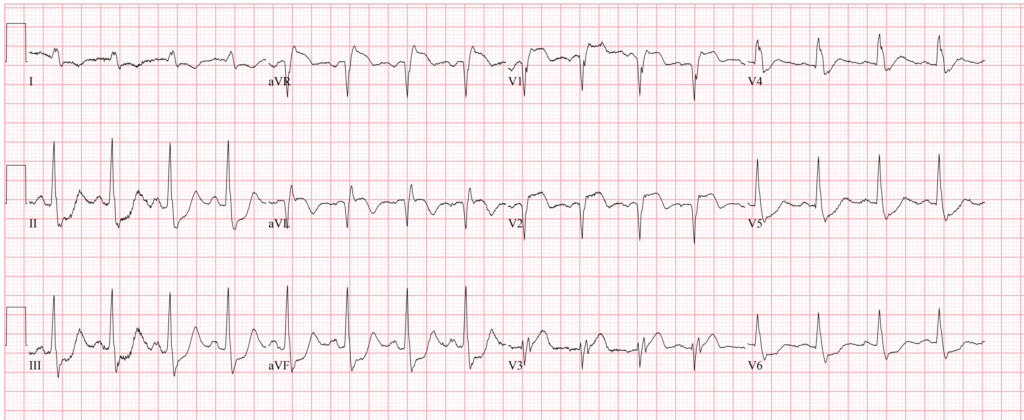
For clarity in Figure-2 — I’ve reproduced and labeled today’s initial ECG. As per Dr. Smith — there is an obvious acute STEMI.
- ECG #1 shows sinus tachycardia (which is always a worrisome sign with acute MI — often suggesting associated heart failure or shock).
- What I find especially remarkable about this tracing — is that all 12 leads show marked ST-T wave abnormalities, with lots of what I call, “transition leads”. By this I mean that the modest size of the hyperacute T wave in lead V4 most likely reflects transition from a much more obvious hyperacute T wave in preceding lead V3 — to the marked ST depression that begins in subsequent lead V5.
- Another “transition area” is seen in lead V3, in which the multi-directional (rSr’s’ ) QRS complex in this lead most likely reflects transition from the QS wave in preceding lead V2 — to the abruptly all-positive QRS deflection that we see in subsequent lead V4.
- PEARL: I interpret seeing a multi-fragmented QRS complex as we do in lead V3, that follows QS complexes in preceding leads V1,V2 — as a Q wave equivalent (especially given tiny size of the initial r wave in lead V3).
- My “eye” was immediately drawn to the massive ST depression in each of the inferior leads (within the RED rectangle).
- Marked ST depression is seen in multiple lateral leads (BLUE arrows in leads I,V5,V6) — with terminal T wave inversion in lead I — and a mixed picture in lead aVL (with deep Q wave, coved ST elevation, and deep terminal T wave inversion).
- Acute anteroseptal infarction is heralded by ST elevation and those QS waves in leads V1,V2 (with “Q wave equivalent” and hyperacute T wave in neighboring lead V3).
- Finally — there is marked ST elevation in lead aVR (GREEN arrow), which in this context undoubtedly reflects diffuse ischemia in multiple anatomical areas.
BOTTOM Line: The ECG in Figure-2 is consistent with the Northern OMI pattern of acute LMain occlusion.
- Unfortunately (but not surprisingly) — this tachycardic patient with acute LMain occlusion did not survive.
= = =
Figure-2: I’ve labeled the initial ECG in today’s case.
= = =
= = =
= = =