I’m going to show you this one without history.
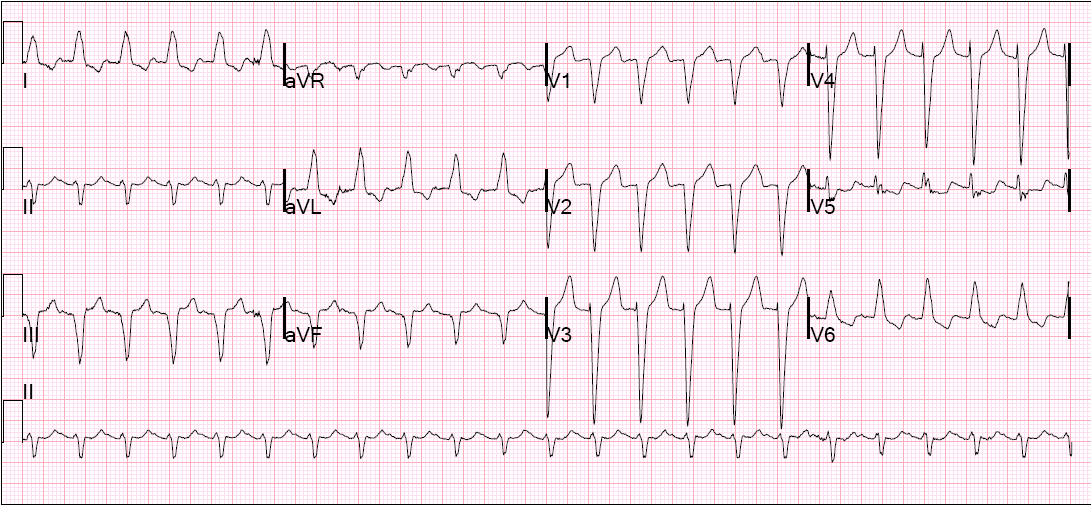 |
| Rate is 133. There are no definite p-waves. The QRS is only 126 ms. See answer below |
When the QRS duration is less than 140 ms, it is more likely SVT. Furthermore, there is a left bundle branch block morphology, supporting SVT. A rate of 130 – 170 should make you think of atrial flutter with 2:1 block and prompt a search for flutter waves, best seen of course in leads II and V1. Of course PSVT is also possible.
In this case, the flutter waves are best seen in lead aVR (usually leads II and V1 are easiest. I have annotated this with lines below. I found the waves in aVR and drew red lines down to the lead II rhythm strip across the bottom. Then I can find the same bumps on lead II across the entire ECG and draw black lines up.
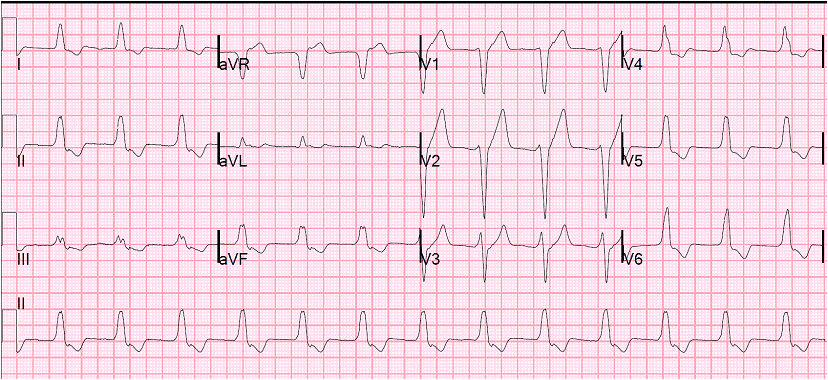
Wide complex? Left bundle branch block (LBBB), possibly rate related

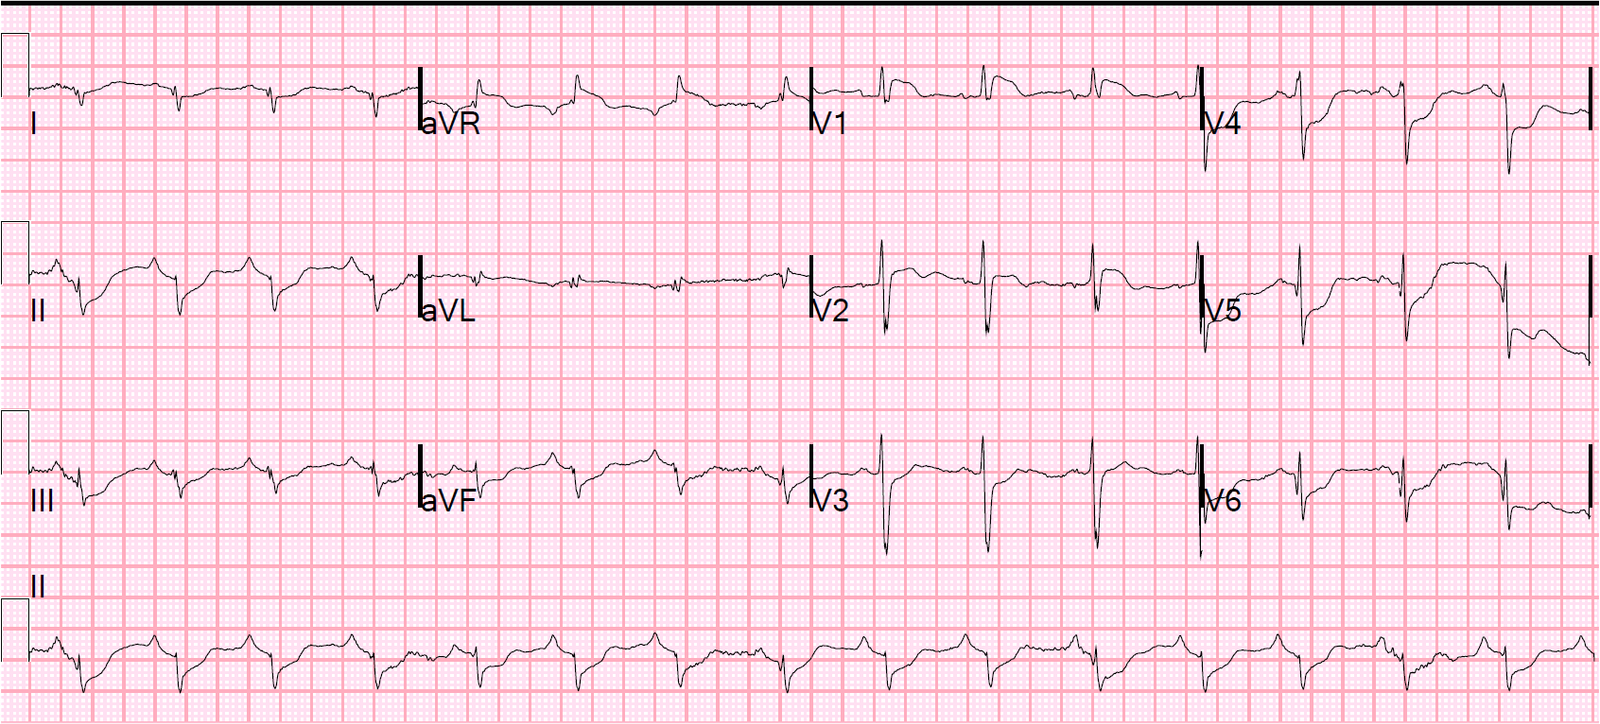
Here is the obvious atrial flutter rhythm after AV nodal blocking with Diltiazem.
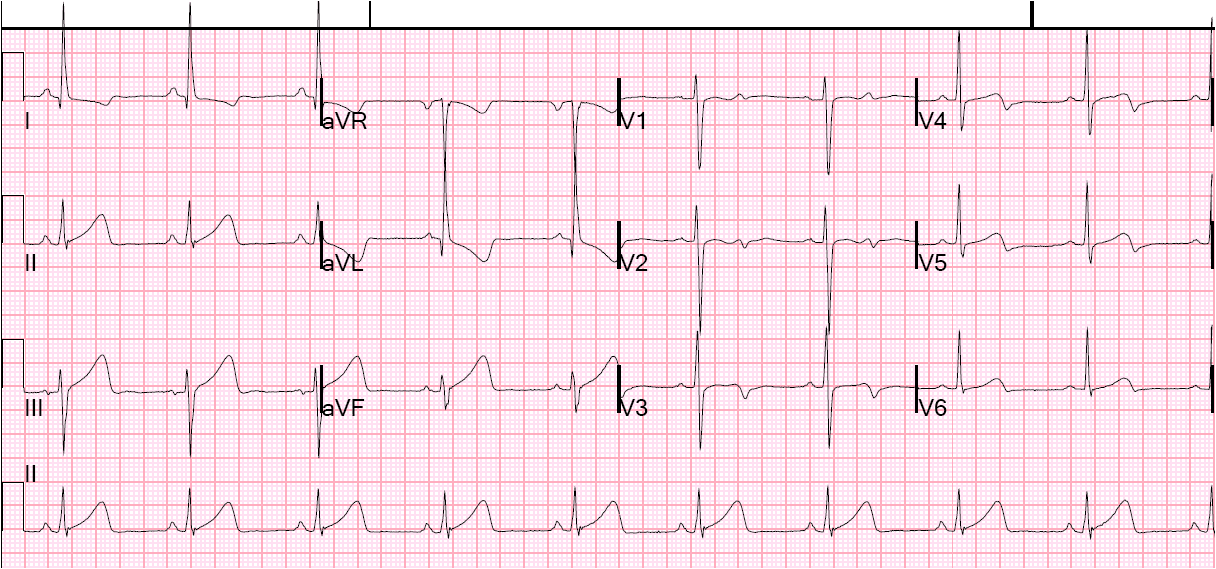
 |
| Atrial flutter with variable (3, 4, and 5) to 1 block. LBBB persists, so it is NOT rate related |