An elderly woman with history of coronary disease presented with CP and SOB and hypotension by EMS. EMS had attempted adenosine x 2 without success.
Here is her ED ECG:
 |
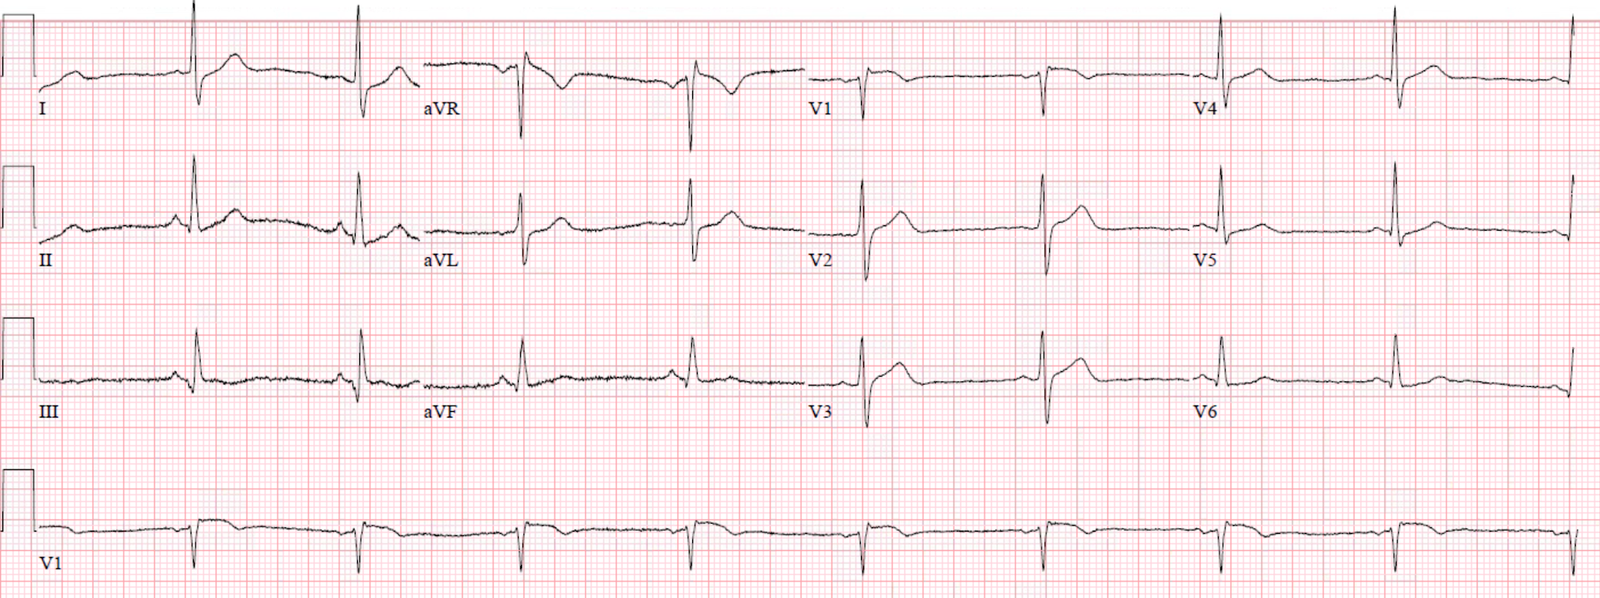
| Here is the ED physician’s interpretation:
IMPRESSION UNCERTAIN REGULAR RHYTHM, wide complex tachycardia, likely p-waves. LEFT BUNDLE BRANCH BLOCK [120+ ms QRS DURATION, 80+ ms Q/S IN V1/V2, 85+ ms R IN I/aVL/V5/V6] Comparison Summary: LBBB and tachycardia are new. What do you think? |
Smith: This is indeed a regular wide complex tachycardia. I do not see P-waves. Retrograde P-waves after the R-wave are possible (see lead II across the bottom). This is clearly ventricular tachycardia. It has a left bundle branch block morphology (small r-wave in V1 with deep S-wave), but the r-wave is wide and the RS interval is almost 100 ms. LBBB should have a narrow r-wave and the RS interval should be no longer than 60-70 ms, unless there is also some other entity which widens the QRS, such as hyperkalemia or Na channel blocking medications.
That the VT is “LBBB-type” indicates that it originates in the right ventricle. Since all inferior QRS axes are negative (going away from the inferior wall) and positive in I and aVL, (going towards I and aVL), the point of origin can be predicted to be in the inferior part of the right ventricle or the inferior and right side of the septum.
Course
The medics had already tried adenosine x 2, which is safe and not contraindicated. But, predictably, it did not have any effect.
The patient was given a small dose of etomidate and electrically cardioverted in the ED.
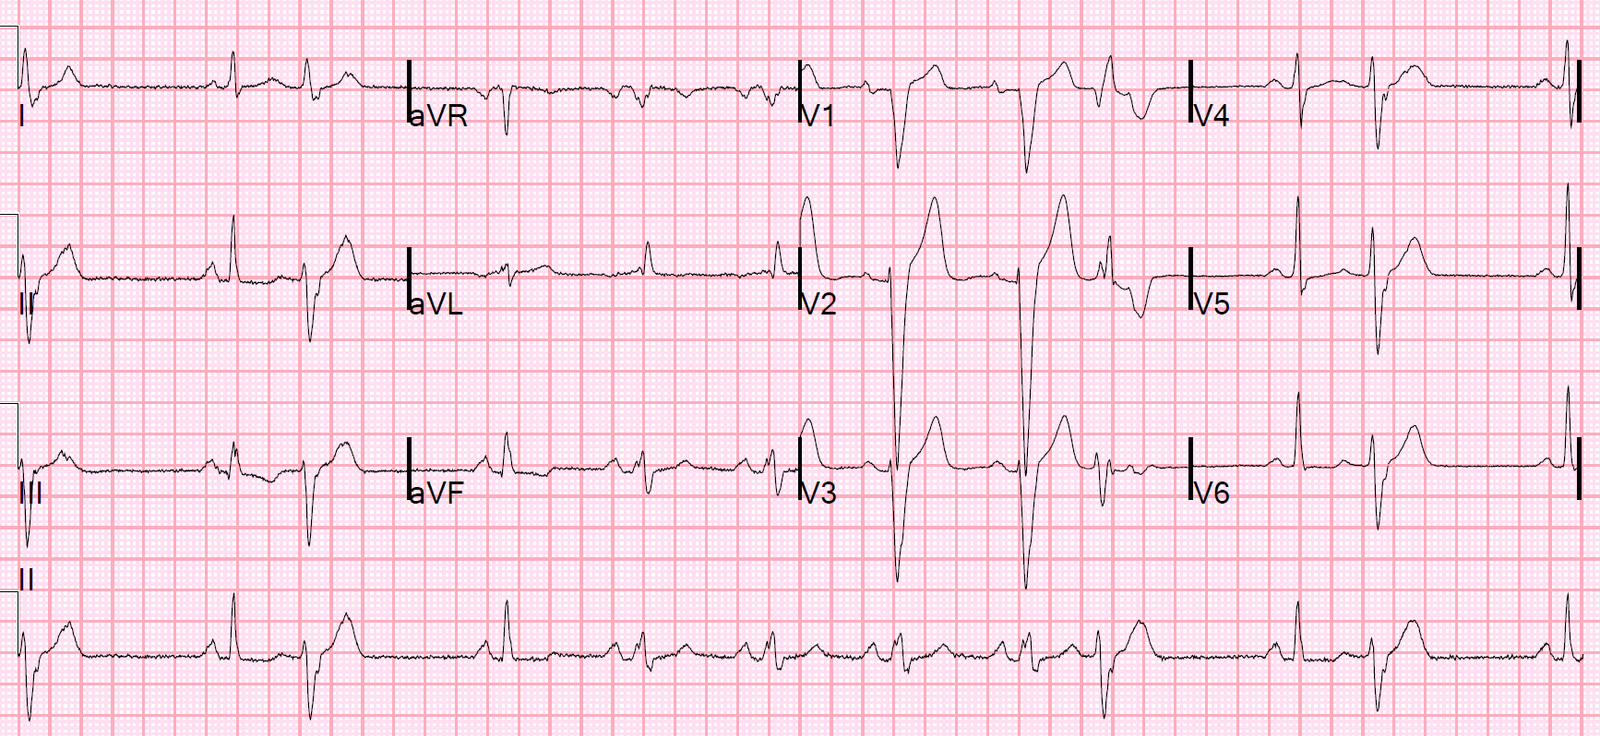
Here is the post-cardioversion ECG:
 |
| There is sinus with RBBB There are inferior Q-waves suggesting old inferior MI. Inferior MI results in scar tissue which is a likely source of a re-entrant ventricular dysrhythmia. |
Angiogram:
Severe coronary artery calcification
Moderate to severe distal small vessel disease mainly seen in RPL1, 2
Otherwise, Mild plaque, no angiographically significant obstructive coronary artery disease.
Note of electrophysiologist
PRESENTING EKG: Wide complex tachycardia with atypical left bundle branch block, slurred deflection in AVR and V6 at onset of QRS to the deflection of 100 ms, fusion beats noted in aVR on EKG reading station, consistent with ventricular tachycardia with inferoseptal origin.
Tele Monitor: Normal sinus rhythm throughout, no ectopic atrial or ventricular beats.
Echocardiogram:
Estimated left ventricular ejection fraction, lower limits of normal; 45-50%.
Regional wall motion abnormality-inferior/inferoseptum: akinetic.
Regional wall motion abnormality-inferolateral.
Regional wall motion abnormality-apex, probable.
Evidence for dense scar involving the inferior and inferoseptal walls
Impression
Wide complex tachycardia in the setting of structural heart disease, known inferior and inferoseptal dense scar from previous MI, with symptoms of palpitation and diaphoresis, morphology based on Brugada and Vereckei for aVR most consistent with ventricular tachycardia origin inferoseptal region.
However, due to LBBB with some typical feature, difficult to rule out SVT completely.
EP study:
–SVT could not be induced
–LBBB aberrancy could not be induced
–Therefore, it is ventricular tachycardia
–ICD placed
![]()
===================================
MY Comment by KEN GRAUER, MD (4/15/2020):
===================================
The patient in this case presented with a regular WCT (Wide-Complex Tachycardia). As always — it’s nice when we have “the Answer”, here in the form of an EP study documenting the absence of any SVT — with confirmation that the rhythm is VT. That said, because of uncertainty in the initial ED diagnosis (with apparent strong consideration of an SVT etiology + thinking that P waves were present) — I’ll add to the points brought out by Dr. Smith’s comments, and from data in the EP cardiologist’s report.
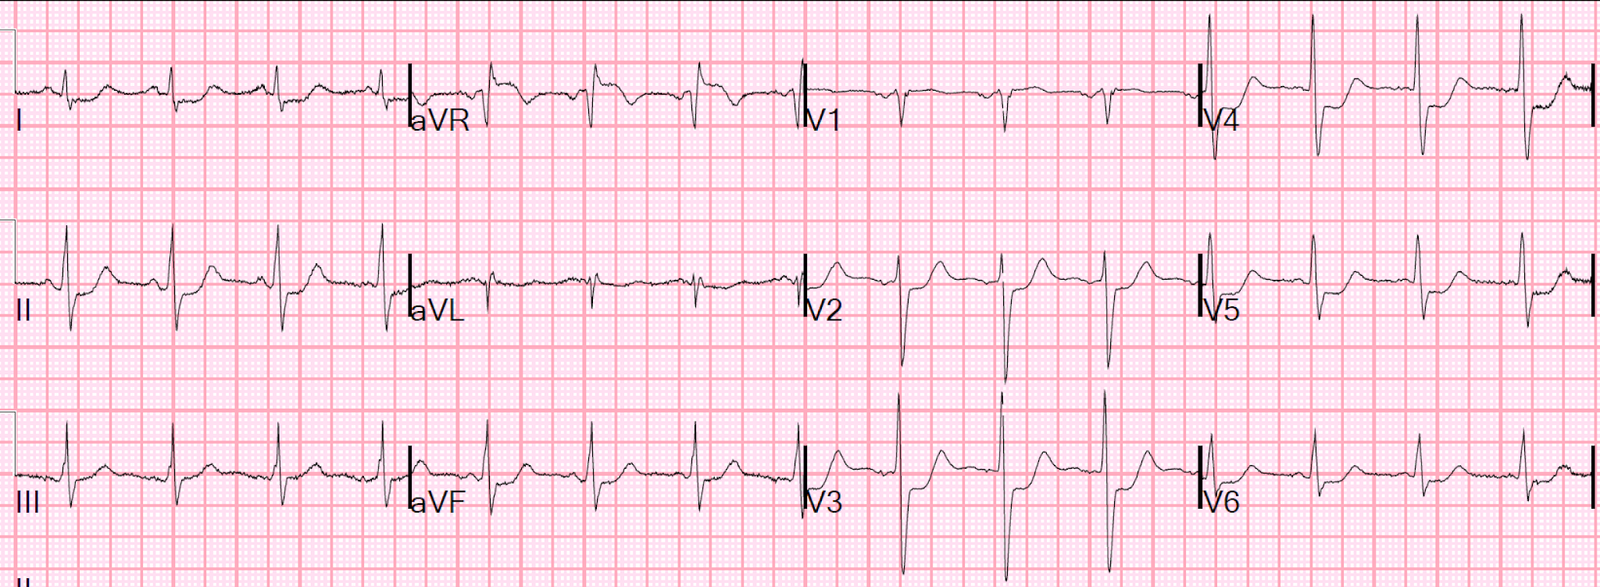
- For clarity — I’ve reproduced and labeled the initial ECG with the post-conversion tracing below it in Figure-1.
 |
| Figure-1: The 2 ECGs in this case (See text). |
MY THOUGHTS: I have previously reviewed my Systematic Approach to Rhythm Interpretation (See My Comment in the October 16, 2019 post).
- There are 6 KEY parameters to consider in systematic assessment of any arrhythmia. The 1st (and most important) parameter — is whether or not the patient is hemodynamically stable. Although not expressly stated in the presentation here — I’ll assume that despite palpitations that awakened this nursing home patient + diaphoresis and some shortness of breath — that the patient was still hemodynamically stable — since Adenosine was given by EMS.
- While specific criteria to assess hemodynamic stability include the presence (or absence) of arrhythmia-related hypotension, chest pain, shortness of breath, and/or mental status changes — an overall “Gestalt” assessment from “being there” (ie, at the patient’s bedside) needs to be consciously made. This is because IF the patient is hemodynamically unstable as a direct result of the tachyarrhythmia — then immediate cardioversion will be indicated regardless of whether the rhythm is an SVT or VT.
- Once you ensure that the patient is hemodynamically stable — the other 5 parameters to assess can be easily remembered by the saying, “Watch Your Ps and Qs, and the 3 Rs” (ie, presence of P waves — QRS width — and the Rate + Regularity of the rhythm + determination if P waves are Related to neighboring QRS complexes).
- It does not matter in what sequence these 5 parameters are looked at — as long as each of the 5 are looked at! This is relevant to this case — because there is no mention above as to what the rate of this WCT is — and no mention in the initial ED interpretation of the possible relation that suspected P waves might have to neighboring QRS complexes.
NOTE: We define the rhythm in ECG #1 as a regular WCT — because the rate is rapid, and QRS complexes are both regular and wide.
- Looking closer — the QRS complex is very wide. Measurement of any interval should be made in that lead where you clearly see onset and offset of the interval — and, in which the interval is longest. When measuring — I look for a QRS complex that either begins or ends on a heavy line. In ECG #1 — I chose to use lead V1. Vertical PINK lines show the last QRS complex in this lead to begin on a heavy line — and end on the next heavy line. Thus, the QRS complex in ECG #1 measures 0.20 second (which turns out to be significantly wider than the wide QRS in the post-conversion tracing). A “soft” criterion in favor of VT — is the presence of an extremely wide QRS complex, as we see in ECG #1.
- The QRS complex in the long lead II rhythm strip of ECG #1 is precisely regular. Knowing the rhythm is precisely regular rules out any possibility of atrial fibrillation — and facilitates calculation of heart rate.
- When the rhythm is fast and regular — the Every-Other (or Every-Third) Beat Method allows rapid and accurate rate estimation. Find a QRS complex that begins on a heavy line. In ECG #1 — I chose the 2nd beat in lead II (See the 1st vertical RED line under this beat). Using the Every-Third Beat Method — the amount of time that it takes to record 3 beats (RED numbers in lead II) is just under 5 large boxes (BLUE numbers in this Figure). Therefore — ONE THIRD the rate is a little faster than 300/5 ~60-65/minute.
- The actual rate for the rhythm in ECG #1 is therefore ~60-65 X 3 ~185-190/minute. Knowing the actual rate of the WCT in ECG #1 is relevant to this case — since while not impossible, sinus tachycardia is extremely unlikely at this fast of a rate. (In my experience — sinus tach rarely exceeds 170/minute in a non-exercising adult patient.)
- CLICK HERE — if interested in brief video review of this Every-Other-Beat Method.
NOTE: Mention was made in the initial ED interpretation of ECG #1 of “likely P waves”. Neither myself nor Dr.Smith thought P waves were present in ECG #1 — but it is often difficult to determine with certainty if atrial activity is present in a wide-complex rhythm as fast as we see here.
- I suspect the ED provider thought the rounded deflections at the onset of the ST segment in each of the inferior leads represented atrial activity (RED arrowheads). These positive, rounded deflections correspond temporally to the negative deflection we see just after the QRS complex in lead aVL (highlighted by the thin purple double-arrow). But IF these deflections were P waves — then they are not retrograde P waves, because they are upright (instead of negative) in the inferior leads.
- IF instead, these rounded, positive deflections in the inferior leads are forward-conducting P waves — this would make the rhythm sinus tachycardia. But that is highly unlikely because: i) Sinus tach rarely occurs at 185-190/minute! — and, ii) These deflections are huge in leads III and aVF. Therefore — I didn’t think P waves were present in ECG #1. Instead, I thought the rounded inferior lead deflections and the negative deflection in lead aVL represented the onset of the ST segment after the wide QRS.
In summary — this leaves us with the abrupt onset of a regular WCT rhythm at ~185-190/minute (that woke this nursing home patient up from a sound sleep) — without any clear sign of atrial activity.
- PEARL #1 — Remember statistical likelihoods. The literature suggests that over 80% of new-onset regular WCT rhythms without clear sign of atrial activity are VT. Even before you look at the ECG — this statistic increases to over 90% if the patient in question is older and has underlying heart disease. Therefore, our mindset always needs to be to Assume VT until proven otherwise — and treat the patient accordingly.
- The principal differential diagnosis of a regular WCT rhythm without clear sign of atrial activity is VT vs SVT. Remember that SVT rhythms may present with a wide QRS complex not only because of aberrant conduction — but also because of preexisting bundle branch block. Less commonly, other causes of a regular WCT rhythm might include: i) AVRT, with anterograde conduction down the AP (accessory pathway) producing a regular wide SVT rhythm; and/or, ii) Some toxicity (ie, tricyclic overdose or other sodium channel blocker toxicity, hyperkalemia, etc.).
- Regarding the regular WCT rhythm in ECG #1 — QRS morphology superficially resembles LBBB (Left Bundle Branch Block) — because the QRS complex manifests a monophasic (all upright) QRS complex in left-sided leads I and V6 — and a predominantly negative QRS in the anterior leads.
PEARL #2: Despite the above noted superficial resemblance to LBBB — QRS morphology in ECG #1 is not “typical” for LBBB!
- With typical LBBB morphology — there is either no initial positive deflection (r wave) in the anterior leads — or — the initial positive deflection in anterior leads is very narrow. Instead, BLUE arrows in leads V1, V2 and V3 of ECG #1 highlight a surprisingly wide initial r wave deflection! Starting with a statistical ~90% likelihood that the regular WCT rhythm in ECG #1 of this nursing home patient is VT — the finding of atypical QRS morphology (ie, that does not resemble any form of BBB or hemiblock) increases the likelihood that this rhythm is VT to over 95%.
- NOTE — an over 95% likelihood of VT is not 100%. Exceptions are always possible (ie, the patient may have had an extremely abnormal baseline ECG — which we could not know unless we had access to a prior tracing). That said, there is more than enough convincing evidence to assume that the rhythm in ECG #1 is VT (and to treat accordingly) until we prove otherwise.
- CLICK HERE — if interested in more on “My Take” regarding ECG assessment of the regular WCT.
This patient was electrically cardioverted in the ED. The post-conversion tracing is shown in Figure-1 as ECG #2.
- How would you interpret the 12-lead tracing shown in ECG #2?
- Does ECG #2 support or refute our conclusion that the regular WCT in ECG #1 was VT?
ANSWER: Normal sinus rhythm has been restored in ECG #2. The QRS complex is wide — though as noted earlier, not as wide as it was during the WCT.
- QRS morphology in ECG #2 is consistent with RBBB because: i) The QRS complex is wide (I measure a QRS duration ~0.14 second); ii) There is an rsR’ complex in right-sided lead V1; and, iii) There are terminal S waves in left-sided leads I and V6.
- There also appears to be LPHB (Left Posterior HemiBlock) — as the straight downward deflection of the S wave in lead I is predominantly negative + there are qR complexes in the inferior leads. The presence of RBBB/LPHB qualifies as bifascicular block — and is a marker of significant underlying heart disease.
- There are inferior Q waves, that especially in leads III and aVF are deeper and wider than normally expected. Considering the modest QRS amplitude of the complexes in leads V5 and V6 — the Q waves in these leads are also larger-than-expected. These findings are consistent with prior infero-lateral infarction.
- There is marked fragmentation in multiple leads. This is best seen in leads V1 (the double notch in the R’ wave) — V2 (marked notching at the nadir of the S wave) — and in leads V3 and V4 (notching on the upstroke and downstroke of the R wave, respectively). The presence of marked fragmentation in ECG #2, in association with bifascicular block + infarction Q waves further solidifies the conclusion that this patient has severe underlying heart disease. Knowing this, and seeing how different QRS morphology is in ECG #2 (compared to what it was during the regular WCT rhythm in ECG #1) — adds virtual certainty that the WCT in ECG #1 was VT.
- IF interested in more on the topic of fragmentation — See My Comment in the January 31, 2020 post.
![]()