Written by Magnus Nossen
Today’s patient is an overweight 77-year-old male with COPD and Stage 5 CKD (Chronic Kidney Disease) — who is being evaluated for kidney transplantation. His medical history includes an obtuse marginal OMI treated with PCI four years ago. Following the myocardial infarction, an echocardiography was done and an apical left ventricular thrombus was noted. After treatment with warfarin, the thrombus resolved.
As part of this patient’s pre-transplant assessment — he was referred for coronary angiography (CAG). He reported no chest pain — and was asymptomatic at the time his admission ECG (shown below) was recorded.
What do you make of these T wave inversions?
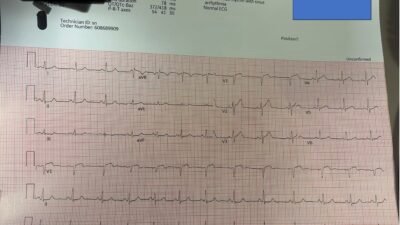
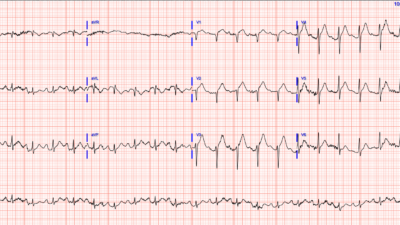
ECG recorded on admission
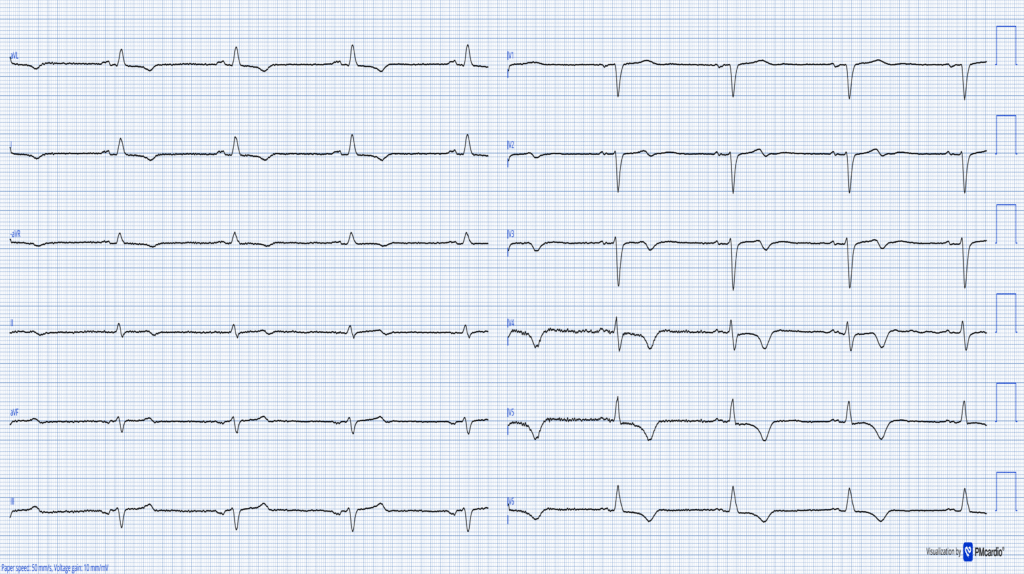
The ECG was originally recorded with a paper speed of 50mm/s. Here it has been “compressed” on the X-axis so that it appears that it was recorded at 25mm/s. The layout is in the Cabrera Format (See Dr. Grauer Comment in the October 26, 2020 post of Dr. Smith’s ECG Blog for review on the Cabrera Format).
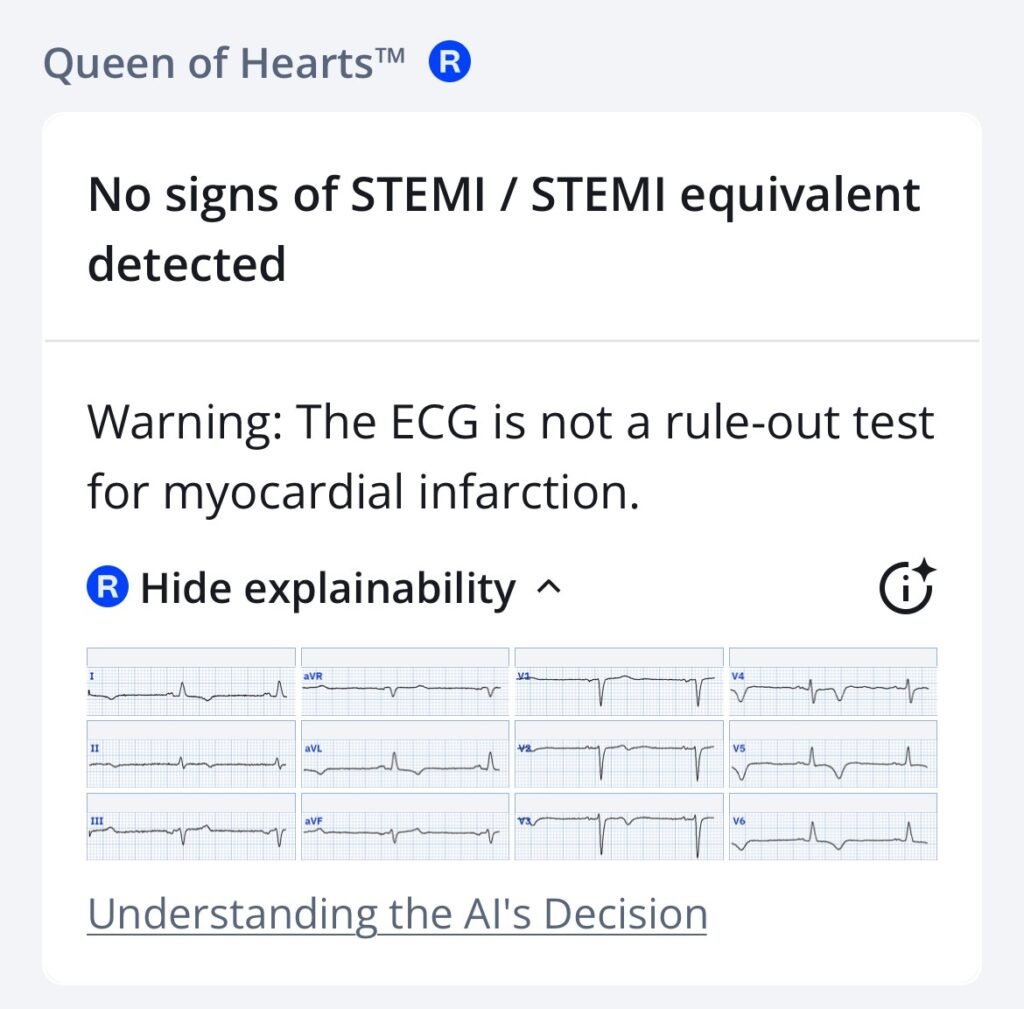
Today’s clinical findings are not indicative of an occlusion myocardial infarction (OMI). The above ECG shows extensive TWI as can be seen in reperfused OMI. The Queen of Hearts AI flags ‘Reperfused OMI’ when she thinks the TWI are due to reperfusion. In this case the AI model correctly identifies that these TWI’s are NOT consistent with reperfusion.
Smith: importantly, one should only be suspicious for reperfusion in the right clinical context, usually resolved or resolving chest pain. This ECG was only recorded as part of a pre-operative evaluation.
Smith: contrast the above T-wave inversions with this classic evolution of Wellens waves:
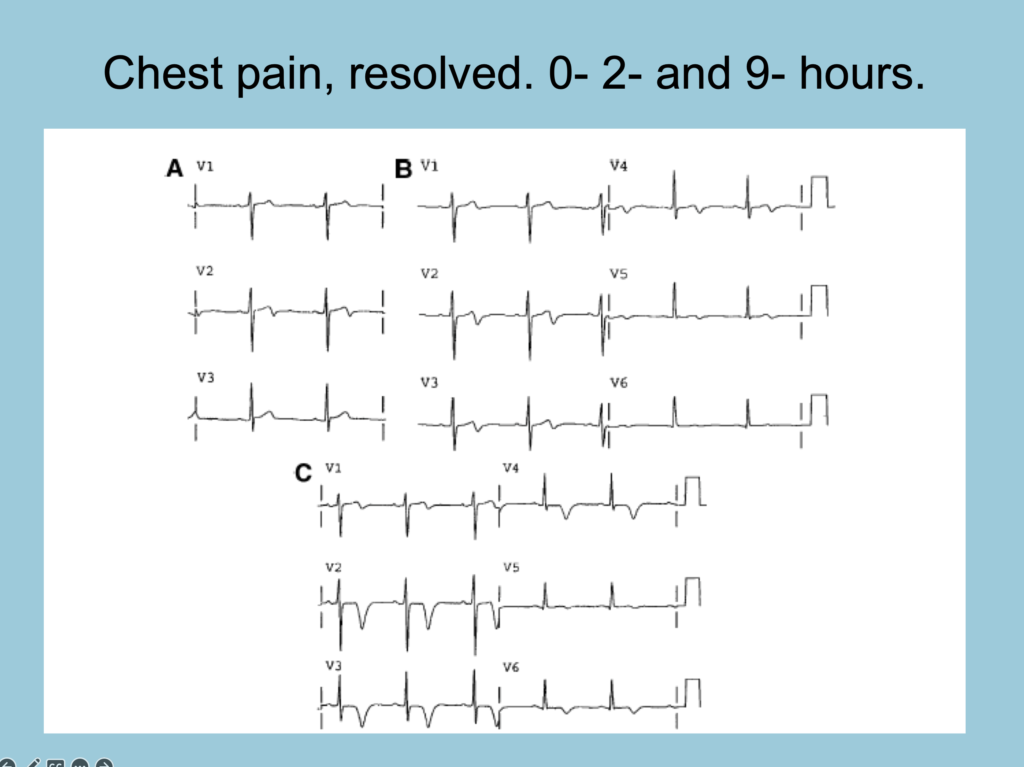
What is the most likely explanation for the ECG changes and the patient’s medical history?
The ECG in today’s case shows sinus bradycadia @50 bpm. The QRS is narrow. Of note are T-wave inversions in many leads, most pronounced in anterolateral leads V4-V6. It is not uncommon for patients with CKD to have TWI as part of secondary repolarization changes from left ventricular hypertrophy. As a result — it could be easy to dismiss the TWI as non-specific and explain them by LVH.
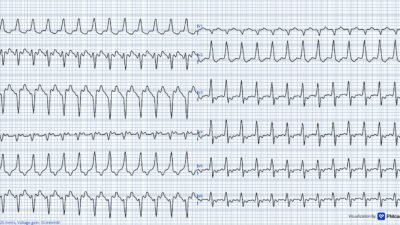
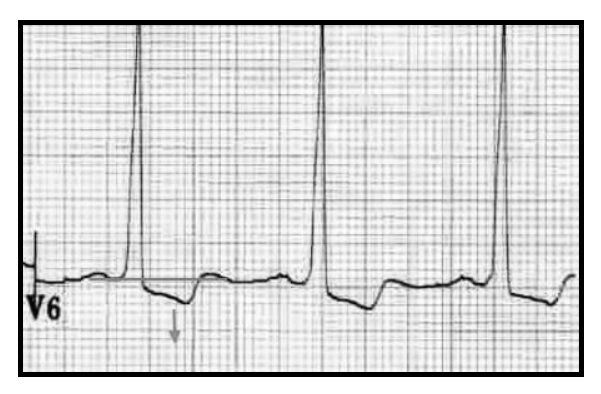
In my experience, patients with LVH from concentric hypertrophy do not have the ST-T wave morphology seen in today’s case. See the image below for a typical LVH strain pattern.
Typical “strain” pattern seen in LVH
This patient had a previous obtuse marginal OMI. However, since the marginal branch of the left circumflex artery does not supply the apex of the left ventricle, an infarct in this artery would not be expected to cause apical hypokinesis leading to thrombus formation in that location.
Intraventricular thrombi typically develop in areas with hypokinesia, akinesia, or dyskinesia of the ventricular wall. The most common causes include OMI or stress cardiomyopathy, both of which lead to regional wall motion abnormalities and may predispose for subsequent thrombus formation. In addition, severe systolic dysfunction with markedly reduced intraventricular flow may also predispose to thrombus development.
There are a few other conditions associated with intraventricular thrombus. Interestingly, the ST-T wave changes seen in today’s case are highly suggestive of one of these less common etiologies.
- Following chart review and evaluation of the presentation ECG — the patient was referred for echocardiography. Below, I have included a focused apical view of the left ventricle. What do you observe?
Left ventricle seen from the apical view
This echo-loop shows a focused view of the left ventricle. The apex of the left ventricle is at the top of the image (closes to the transducer), with the base of the left ventricle and the mitral valve seen closer to the bottom of the image. As you can see, the myocardium is NOT diffusely hypertrophic as one would expect if the hypertrophy was secondary to HTN form CKD. Rather — there is asymmetric hypertrophy located in the apical region.
Discussion
The echocardiogram confirmed the suspected diagnosis in today’s case. This patient has Apical Hypertrophic CardioMyopathy (ApHCM). When I saw the ECG — I immediately thought of this condition because of “pattern recognition”. I became more convinced that ApHCM was likely on reviewing the history — as development of an apical thrombus following an obtuse marginal-OMI would not be expected. ApHCM on the other hand is associated with apical thrombus.
Apical HCM has a very distinct ECG pattern owing to the hypertrophy being concentrated in the apical region of the LV. Usually voltage criteria are present. The patient in today’s case had COPD and was overweight which likely contributed to lower QRS amplitude than expected for a patient with ApHCM. For more cases of ApHCM see the December 26, 2023 post in Dr. Smith’s ECG Blog — as well as this CASE. For another example of LVH see the October 8, 2009 post.
Some information on (Apical) HCM
Hypertrophic CardioMyopathy (HCM) refers to a diverse group of heart muscle disorders, traditionally identified by left ventricular hypertrophy (LVH) on Echo, without abnormal cardiac loading conditions. While originally described morphologically — HCM is now recognized as mainly resulting from autosomal dominant mutations in sarcomeric protein genes. Apical hypertrophic cardiomyopathy (ApHCM) is a variant of HCM, in which the thickening occurs mainly at the heart’s apex. It is more common in Asian populations (up to 40% of HCM cases) and less frequent in Western populations (~8% of HCM cases).
ApHCM tends to be diagnosed later in life. Its outcome is variable — generally with a lower mortality risk than for typical HCM. Male patients are more often affected, and symptoms can range from mild to severe. Multiple LVH patterns exist in HCM — including but not limited to classic asymmetric septal HCM (also known as Obstructive HCM), concentric HCM, and apical (ApHCM) forms. Rare variants like isolated lateral or inferoseptal LVH also exist.
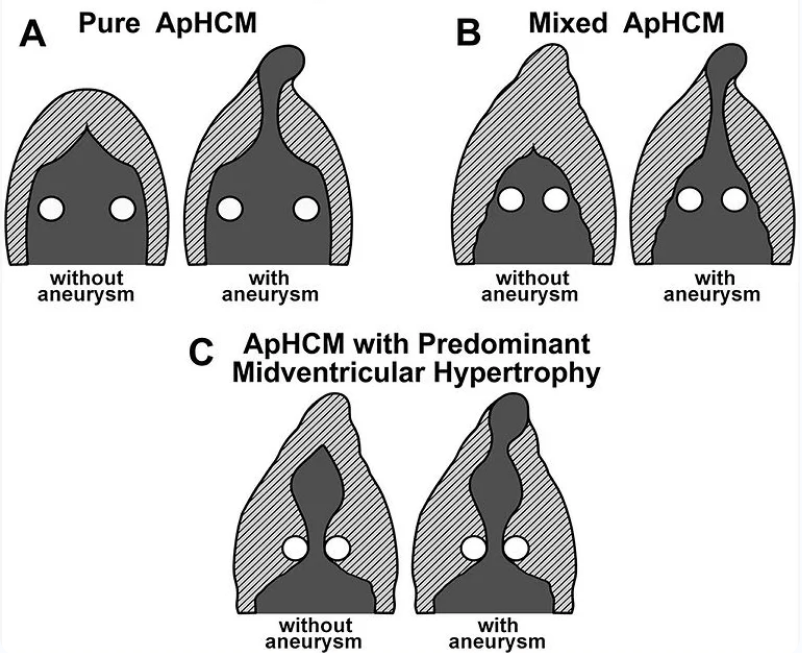
Schematic Illustration of various ApHCM types
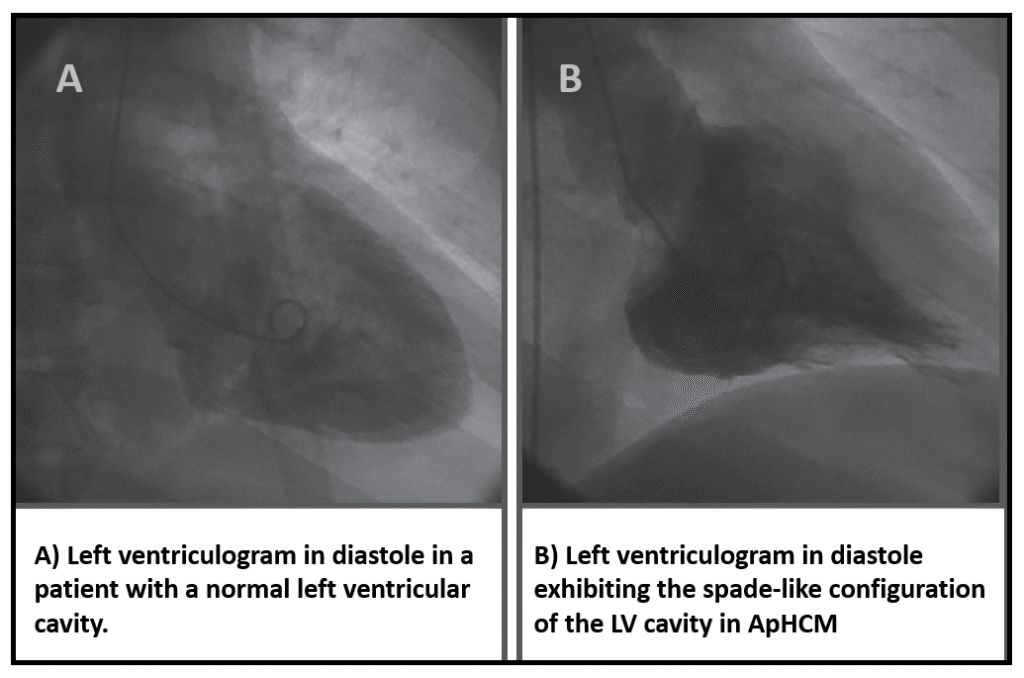
ApHCM, was first described in 1979, by Yamaguchi et. al.(1) Yamaguchi reviewed ventriculography in patients with this disorder, and found a spadelike left ventricular cavity in a series of patients whose ECGs were characterized by “Giant” negative T-waves on ECG. ApHCM is eponymously sometimes referreed to as Yamaguchi cardiomyopaty. Compared with classic HCM, ApHCM occurs more sporadically, shows fewer sarcomere mutations, and has a higher incidence of atrial fibrillation. ApHCM is not as rare as first thought — accounting for up to 25% of HCM in Asian populations, and 1% to 10% in non‐Asians (2).
In one ApHCM study of 105 patients — 94% had abnormal ECGs with voltage criteria for LVH (65%) and T‐wave inversion (93%), but only 47% had giant negative T‐waves (3).
Ventriculography with spade-like ventricular cavity
Spade symbol and still image from the above Echo.
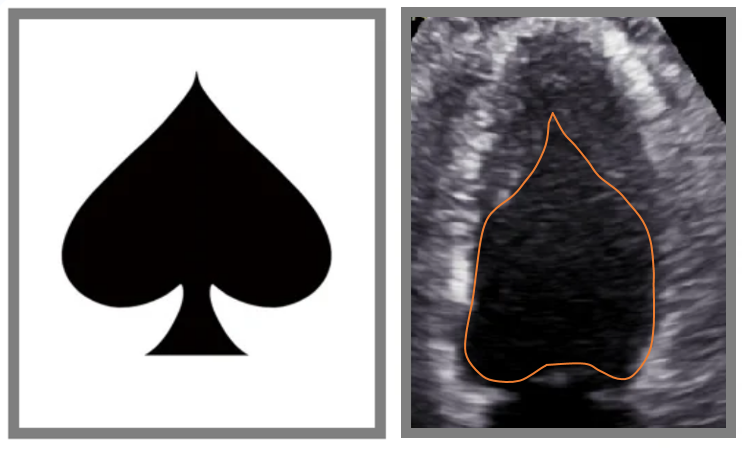
Above: Left: Spade symbol. Right: Still image from the above echocardiopgraphy. The internal left ventricular lumen is outlined in orange. Classically the spade shape is seen in end diastole, but some patients with ApHCM have significant endomyocardial fibrosis and blunting of the ventricular apex making the spade shape more apparent during systole (This is the case for our patient).= = =
Summary:
The patient was informed about his diagnosis, and genetic testing was performed, with results pending. Approximately one-quarter of apical hypertrophic cardiomyopathy (ApHCM) cases are familial, which is lower than in the classic form of the disease.
This patient’s ApHCM was not noticed during echocardiography following the obtuse marginal OMI four years prior. The ApHCM was the cause of the ventricular thrombus. Warfarin therapy has been continued since resolution of the ventricular thrombus, and lifelong anticoagulation is indicated.
- In patients with HCM, anticoagulation is recommended if atrial fibrillation is detected regardless of the CHA2DS2-VASc score. As a result — Holter monitoring should be considered to screen for atrial fibrillation in this patient group.
I also favor Cardiac MRI in selected cases — as it may detect apical aneurysms not easily seen on echocardiography. In today’s patient — ventriculography was performed while undergoing CAG as part of the pre-transplant work up. The ventriculography ruled out apical aneurysm.
Follow-up in ApHCM should be personalized based on patient risk factors. Typically, echocardiography is performed every 1–2 years. Holter monitoring is recommended to detect atrial fibrillation or ventricular arrhythmias, and consideration should be given to implantable cardioverter-defibrillator (ICD) placement when appropriate.
Learning Points:
- The morphology and distribution of T-wave inversion matters. ApHCM has a characteristic morphology for ST-T wave appearance.
- Apical thrombus and apical aneurysms are associated with this variant of hypertrophic cardiomyopathy.
- Thrombus in the LV is rare outside ACS/stress cardiomyopathy and severe systolic dysfunction.
- ApHCM in general is thought to have a better prognosis than obstructive HCM. That said, arrhythmias and adverse cardiac events do occur — especially in those patients with apical aneurysm.
For more on ApHCM this overview article is excellent.
Referrences:
- Yamaguchi H, et. al. Hypertrophic nonobstructive cardiomyopathy with giant negative T waves (apical hypertrophy): ventriculographic and echocardiographic features in 30 patients. Am J Cardiol. 1979;44:401–412.
- Hughes, R. K. Et. al. (2020). Apical hypertrophic cardiomyopathy: the variant less known. Journal of the American Heart Association, 9(5). https://doi.org/10.1161/jaha.119.015294
- Eriksson MJ. Et.al. Long‐term outcome in patients with apical hypertrophic cardiomyopathy. J Am Coll Cardiol. 2002;39:638–645
= = =
======================================
MY Comment, by KEN GRAUER, MD (4/27/2026):
I found today’s post by Dr. Nossen especially interesting — because I was not as convinced as he was from today’s initial ECG that this patient had ApHCM (Apical Hypertrophic CardioMyopathy). As a result — I’ll offer another perspective on ST-T wave morphology and the ECG appearance of LV “strain” and ApHCM.
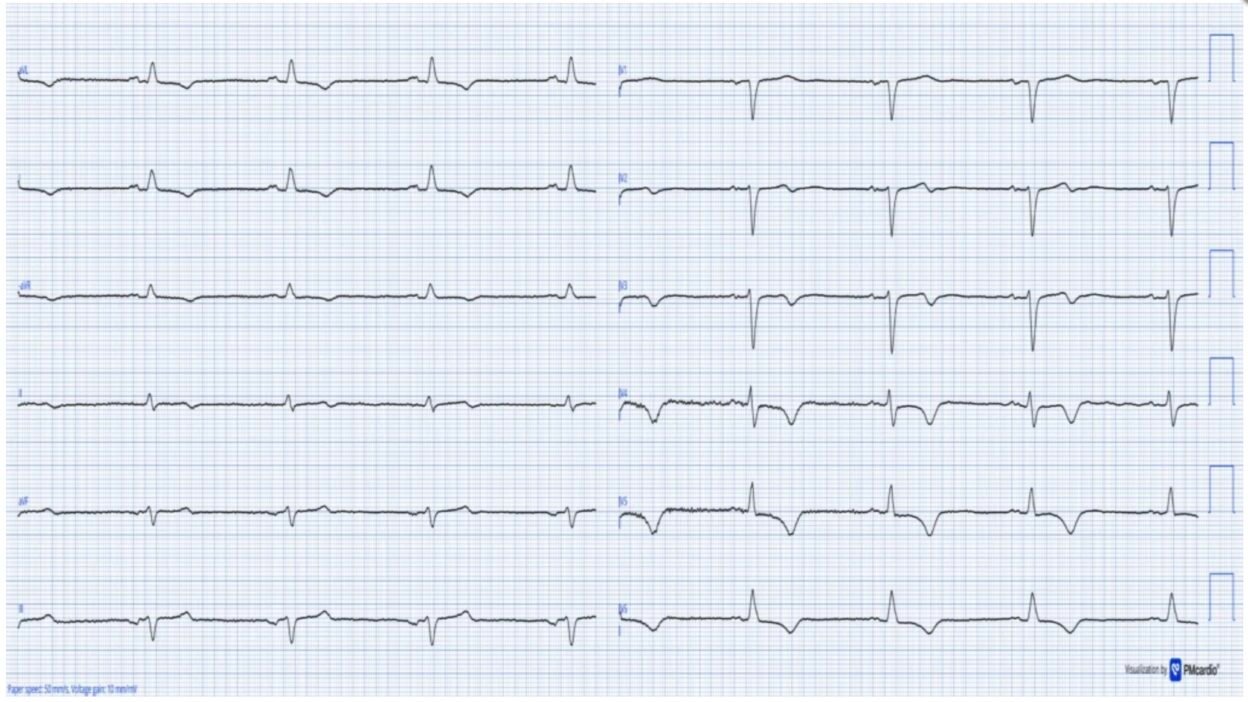
- For clarity in Figure-1 — I’ve reproduced and labeled today’s initial ECG — and compare this tracing with another example of ApHCM that was published in the December 26, 2023 post in Dr. Smith’s ECG Blog.
- As per Dr. Nossen — Today’s initial ECG was recorded in Cabrera Format at 50 mm/sec. speed, and then narrowed by 50% to appear as if recorded at 25 mm/sec. speed. The BOTTOM tracing is recorded at 25 mm/sec. speed.
= = =
The Initial ECG in Today’s CASE:
To realize — that we only see 4 beats in today’s initial ECG — as the same 4 beats are shown in all 12 leads (TOP tracing in Figure-1).
- The rhythm in ECG #1 is sinus bradycardia at ~50/minute.
- There is generalized Low Voltage (For review of Criteria and the Causes of Low Voltage — CLICK HERE ). Note within the RED rectangle in ECG #1 that with normal standardization — chest lead (as well as limb lead) QRS amplitudes are greatly reduced.
- The frontal plane axis is leftward — but not sufficiently to qualify as LAHB (Lead II still manifests a net positive QRS deflection).
- Although the r waves are extremely small in leads V2,V3 — these initial positive deflections are present (ie, other than the QS in lead V1 — there are no Q waves).
- As per Dr. Nossen — there is diffuse T wave inversion, being most marked in lateral chest leads V4,V5,V6 (RED arrows in these leads).
- BLUE arrows highlight leads with a lesser degree of T wave inversion (some leads showing biphasic T waves with terminal negativity).
My Clinical Impression of ECG #1:
In view of this patient’s history (ie, an older, overweight man with COPD, known coronary disease, and severe CKD) — many of the potential Causes of Low Voltage could be contributing (ie, pleural and/or pericardial effusion, body habitus, COPD, cardiomyopathy, depressed LV function).
- While I completely agree with Dr. Nossen that the distribution of deepest T wave inversion in the lateral chest leads would be unusual for post-MI reperfusion — the vast majority of ApHCM cases I’ve seen had far greater QRS amplitudes that those seen in ECG #1.
- I thought the size, shape and distribution of ST-T wave changes in ECG #1 was consistent with several of the potential causes of low voltage listed above.
- Especially in view of the absence of chest pain — I suspected the T wave inversion in ECG #1 was unlikely to represent an acute or recent cardiac event.
- Clearly, the cause of the ST-T wave abnormalities in ECG #1 needed to be established — for which I thought an Echocardiogram would almost certainly provide the key answers.
= = =
The More Typical ECG Picture of ApHCM:
I’ve added the BOTTOM tracing to Figure-1 — as an illustration of the type of ECG that immediately prompts me to consider ApHCM until proven otherwise.
- As per the excellent article by Hughes et al that Dr. Nossen cited in his discussion — not all cases of ApHCM manifest Giant T waves and markedly increased QRS amplitudes (The 8 and 9 mm T waves in leads V4 and V5 fall shy of the ≥10 mm Giant T wave criterion — and voltage for LVH in this bottom tracing is only satisfied in lead aVL).
- Despite limitations of the above bullet — the BOTTOM tracing in Figure-1 just “looks like” ApHCM because: i) Although a bit short of the ECG voltage criteria for LVH in the chest leads — chest lead R wave amplitude still “looks” generous, the QRS appears slightly widened — and lead aVL does satisfy voltage criteria; and, ii) The coved (but not elevated) ST segment shape with disproportionately deep, symmetrically inverted T waves in leads V4,V5,V6 is much more pronounced than what is typically seen with simple LVH.
Figure-1: I’ve labeled today’s initial ECG — and compare it with the initial ECG from the December 26, 2023 post in Dr. Smith’s ECG Blog.
= = =
What about the ST-T Wave Shape with LV “Strain”?
I conclude my thoughts about today’s fascinating case with the schematic illustration in Figure-2 — that I first drew decades ago to simplify the range of ST-T wave possibilities for how LV “strain” or a strain “equivalent” pattern may look.
- The legend to Figure-2 tells all.
- The point I would emphasize is described in the Caveat at the bottom of the figure legend. Although “pure LVH” will in theory manifest a more asymmetric ST-T wave morphology as seen in “C” (with slow downslope and more rapid upslope) — I have seen countless patients with marked hypertension and/or various cardiomyopathy forms manifest increased voltage for LVH with perfectly symmetric lateral lead T wave inversion as seen in “D”. In my experience — an ST-T wave appearance like “D” does not exclude LV “strain” and/or LV strain combined with an ischemic component.
Figure-2: Illustration and description of LV “strain” and a strain “equivalent“ pattern (from Figure-4 in My Comment on the LVH Criteria post under Resources in the upper Menu on every page in Dr. Smith’s ECG Blog).

= = =
= = =