Written by Magnus Nossen
I was reviewing ECGs at my computer when I came across today’s case. I have limited outcome information. I only know that the patient is in his 30s and underwent PCI of the LAD. There was a moderate troponin elevation.
The ECG below was recorded after PCI. How would you describe the observed changes, and would you expect these changes to gradually resolve over time or persist?
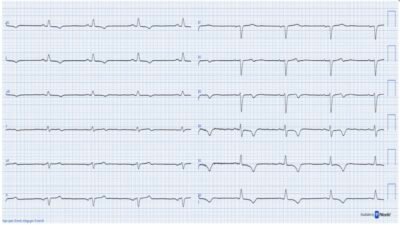
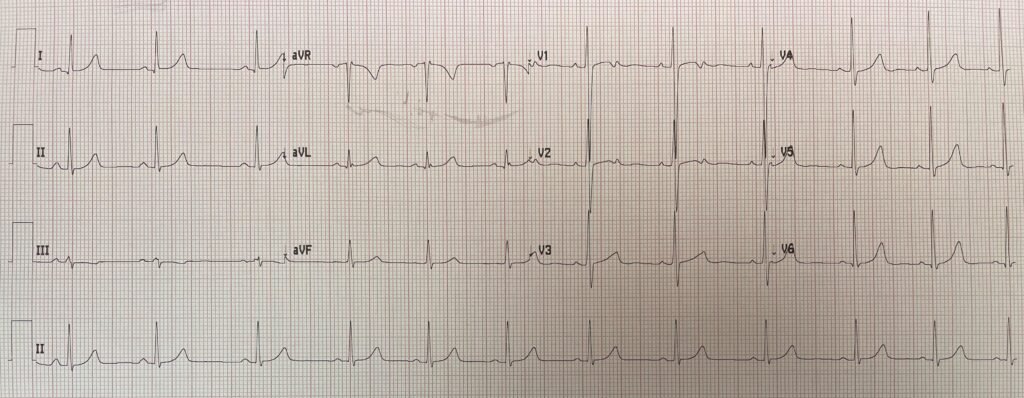
ECG #1
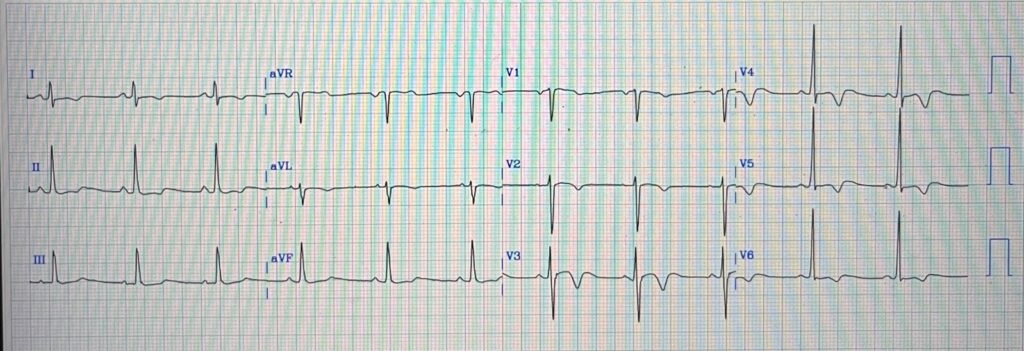
The ECG shows sinus rhythm at approximately 65 beats per minute with a narrow QRS complex. There are T‑wave inversions in the precordial leads, most prominent in V3-V4.
After reading this, see Dr. Smith’s interpretation at the bottom.
After a reperfusion procedure, the most probable explanation for the appearance of presumed new T-wave inversion (TWI) is that it represents reperfusion-related changes.
However, there are many potential causes of T‑wave inversion. TWI patterns can be hard to distinguish from one another and you need to be a skilled ECG interpretor to be able to do so with confidence. Sometimes serial ECGs and comparison to prior ECGs is very helpful. Sometimes TWI are truly non-specific or non-diagnostic.
Some info and examples of various causes of TWI
TWI can be predominant in right sided leads, left sided leads or they may be widespread and globally distributed on the ECG. In general terms, one can say that TWIs seen predominant in the right sided leads V1-V3 are more likely to reflect RV pathology, whereas TWIs predominantly observed in the lateral leads are more likely to represent left ventricular pathology. Widespread TWIs may have many causes some of which are “external” to the heart.
External causes of TWI include among others intracranial pathology which may give rise to giant T wave inversions, including the “spiked helmet sign”. Another external cause of TWI is stress-induced cardiomyopathy, also called takotsubo cardiomyopathy. This clinical entity is caused by an exaggerated cardiac response to catecholamines and autonomic activation.
Reperfusion T waves can be seen in different leads as they follow coronary distribution. Reperfusion T waves are dynamic, gradually evolving and generally disappear after hours to days. For an example of the dynamic nature of ACS and evolution of reperfusion T waves, have a look at this recent case. And here is a recent example of pseudonormalization.
Predominantly right‑sided (V1–V3) T‑wave inversions are common in the pediatric population and is a physiological finding for this patient group. This pattern can be seen in adults and is called persistent juvenile T‑waves. Right sided TWI may also be seen with acute right‑ventricular strain, most typically from acute pulmonary embolism. Right sided TWIs are also seen also other causes such as fat embolism or acute hypoxic vasoconstriction in COPD or asthma exacerbation. Chronic right sided TWI is seen with right ventricular hypertrophy (RVH) and are also seen in arrhythmogenic cardiomyopathy, chronic RV pressure overload, and chronic RV volume overload.
Predominantly left‑sided T‑wave inversions (V4–V6 and lateral leads I, aVL) are seen with LVH and (apical) hypertrophic cardiomyopathy. More widespread T‑wave inversions can be seen with Stokes–Adams attacks, Takotsubo cardiomyopathy, artifact, or cerebrovascular accidents. In addition, T‑wave inversion may be secondary to wide QRS complexes, including bundle branch block, paced rhythms, PVCs, and pre‑excitation.
Back to the case. When I first saw ECG #1, I was not convinced the ECG was specific for reperfusion. It is difficult to exactly why into words. The T wave inversions occurs early in the QT interval and the QRS complex has quite a bit of voltage. I did not think the ECG represent Wellens reperfusion T waves and that the stenosis treated in the cath lab was probably unrelated to the ECG findings. I shared the tracing with Dr. Herman and Dr. Smith, both of responded that they too, thought this was likely a Wellens mimic. The Queen of Hearts AI model also did not classify this as a reperfusion pattern, giving a very low reperfusion prediction score.
QoH prediction scores
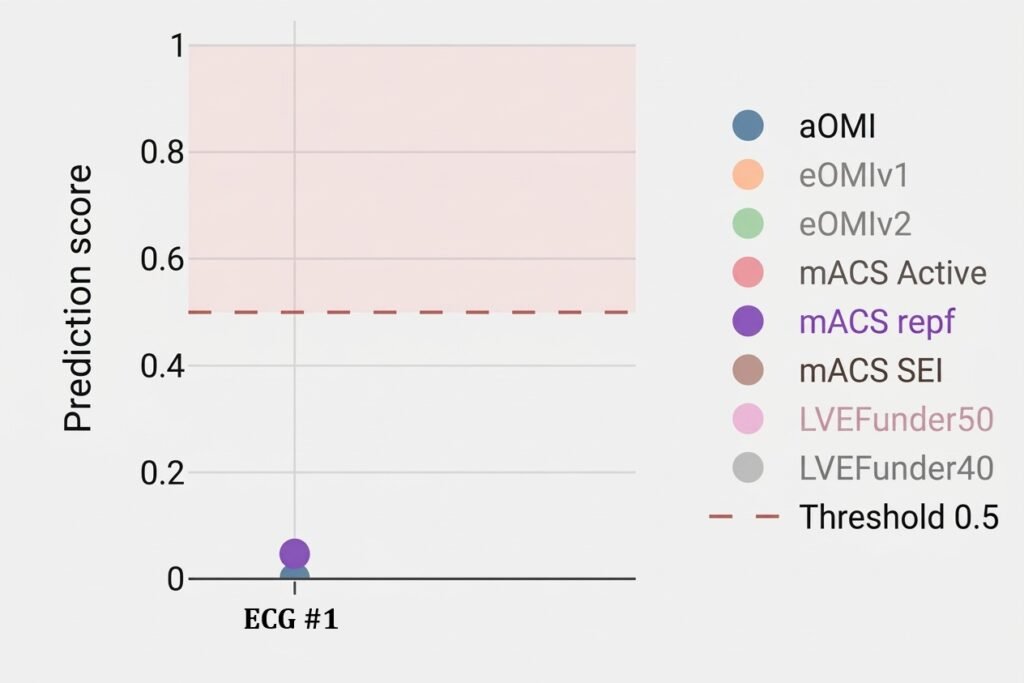
Various model outputs for ECG #1. The aOMI value is represented by the blue-gray dot. If prediction score for aOMI is >0.5 the QoH will give a reading of active OMI. As you can see the value is close to zero. If the prediction score for mACS repf (purple dot) is >0.5 the model will adjudicate the ECG as High risk NSTEMI (=reperfused OMI). As you can see the reperfused OMI score is < 0.1
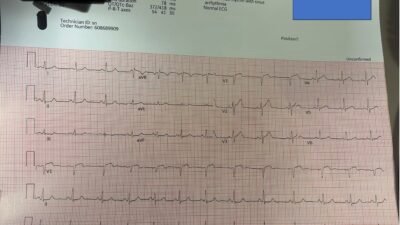
Coincidentally, while we were discussing ECG #1, Dr. Smith received another tracing with a similar pattern. Here is the clinical information he received: “a 20‑year‑old man with no previous medical history presented with 3 days of epigastric pain. ECG in triage”.
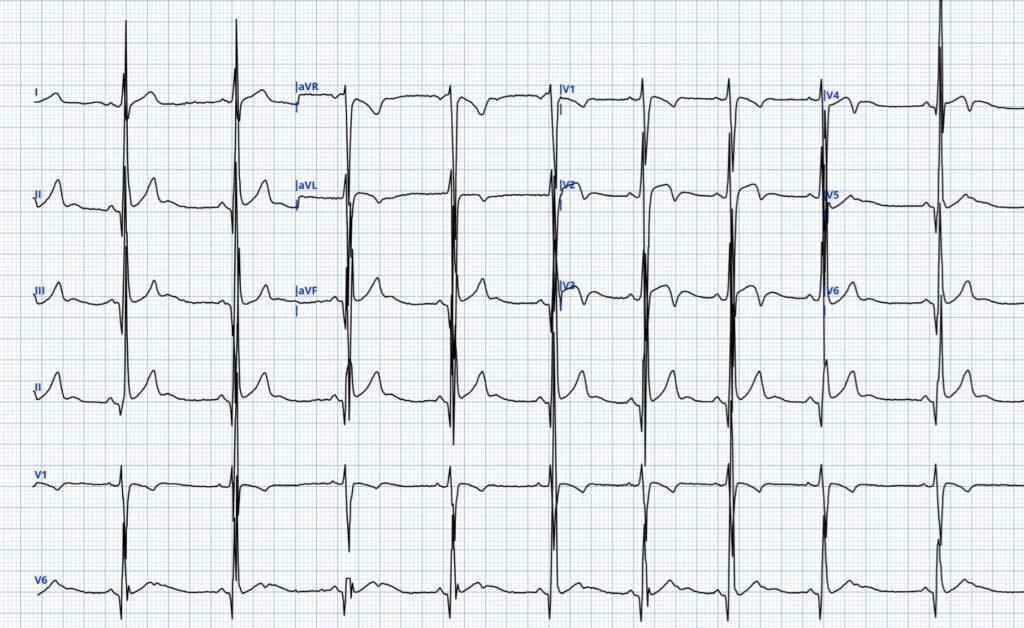
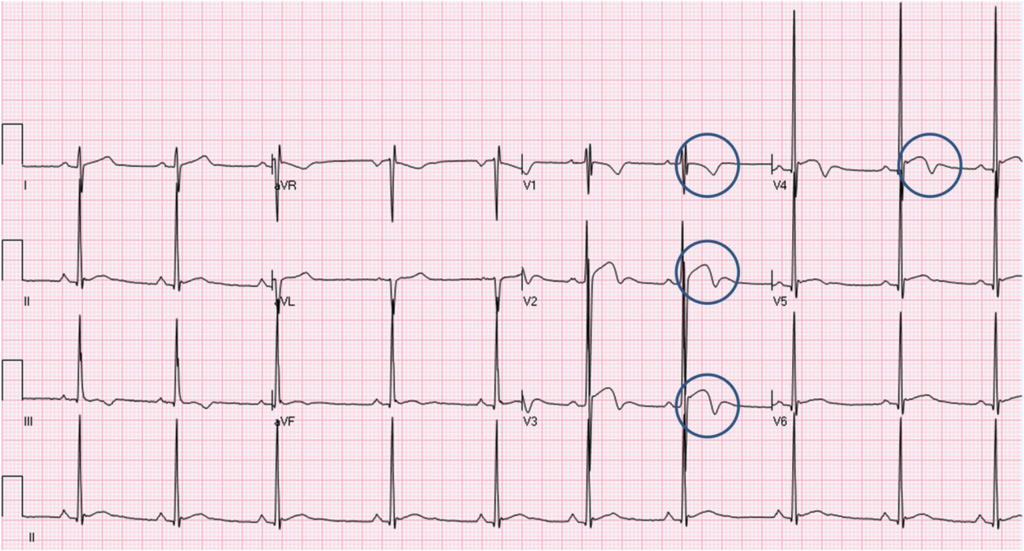
ECG # 2 (different patient)
The sender was using the QoH for ECG interpretation and was very surprised the AI model did not flag the TWI in this ECG as “High-risk NSTEMI”.
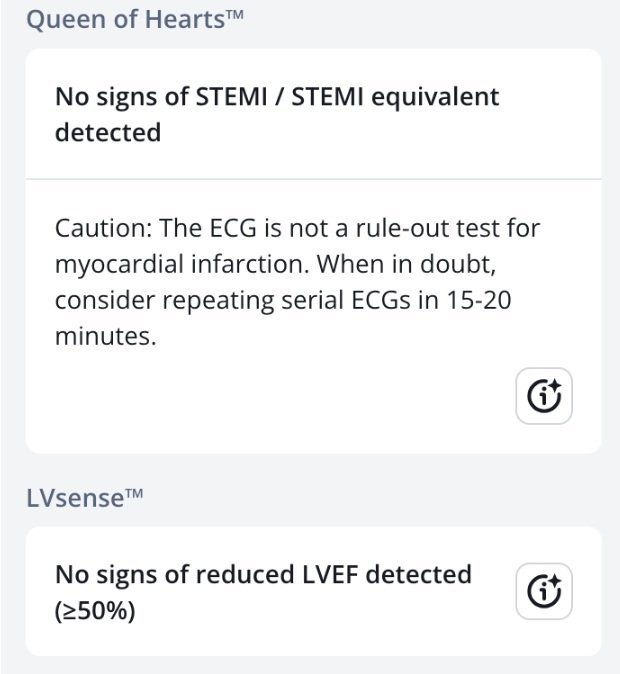
Below is the Queen of Hearts interpretation of ECG #2. The AI model does not interpret this ECG as concerning for active or reperfused OMI.
Why don’t either of these ECGs represent reperfusion?
The ECGs presented in today’s case look a bit like BTWI, but they differ slightly. First off BTWI usually has prominent J waves which are not really striking in todays ECG examples.
For the first patient, prior or serial ECGs would have clarified whether the T-wave inversion had some reperfusion component. I expect the ECG would have remained largely unchanged, but to be certain, one would need serial ECGs. I think this would be the only way to assess whether reperfusion did contribute to the ECG findings. Unfortunately, neither serial tracings nor a previous ECG were available for comparison. What made me think this is likely not caused by reperfusion is the morphology of the ST segment and T wave, and the large positive deflection occuring after the TWI in leads V3-V5. These positive deflections likely represents U waves. In my experience such large U waves are uncommon and I have not seen it with reperfusion.
The ECG pattern shown in today’s second case is more clearly benign. This pattern is usually seen in young adult males and is characterized by high voltage. Once again, there are prominent U waves and a short QTc interval, with the T wave inversions occurirng “early”. Of note, these TWI are asymmetric. Reperfusion T waves, especially in the later stages are usually more symmetric than observed in the ECGs presented in this post. The second patient ruled out by serial troponins. This ECG pattern does not require additional work-up.
Smith: what makes me very skeptical of Wellens’ waves are: 1) the large U-wave and 2) the large R-wave voltage in V4-5. I have seen this pattern many times, and I believe have posted on it before (see below).
Smith: Why is this important? Didn’t the elevated troponin and the LAD lesion prove that this is Wellens’ syndrome? Not necessarily! The troponin could be elevated for many reasons, including both non-ACS etiologies and also from a culprit in a different artery. The ECG suggested to the interventionalist that it was the LAD. But the lesion in the LAD that was intervened upon might have been an “innocent bystander.” An innocent bystander is a stenotic lesion that the interventionalist believes is the culprit when it is not. This is why it is important to recognize these patterns — they might change your management. The only thing that would convince me that this ECG represents reperfusion of the LAD is if there were evolution on subsequent serial ECGs (which we don’t have).
What is an “Innocent Bystander”? See this post: Anterior OMI. What does the angiogram show?
This type of T-wave inversion is not to be confused with BIFID T-waves (see lead V2).
Smith: Finally, one more example that I think is from Smith ECG Blog (It is possible I found it on someone else’s site. If so, please let me know.)
= = =
Learning points
- Even though T wave inversions can be non-specific, learning the different TWI patters will greatly help you managing you patients in the best possible way.
- Learning what TWI patterns are benign will reduce unnecessary investigations and follow up.
- Many types of TWI are dynamic in nature. Serial ECGs, comparison to prior ECGs on the patient, and evaluation with echocardiography will often be very helpful in assessing TWI patterns.
= = =
======================================
MY Comment, by KEN GRAUER, MD (4/23/2026):
Imagine you are shown the ECG in Figure-1 — and told this tracing was taken as part of a pre-employment physical examination, obtained from an otherwise healthy, asymptomatic young adult male. Given that clinical scenario:
— How would YOU interpret this tracing? —
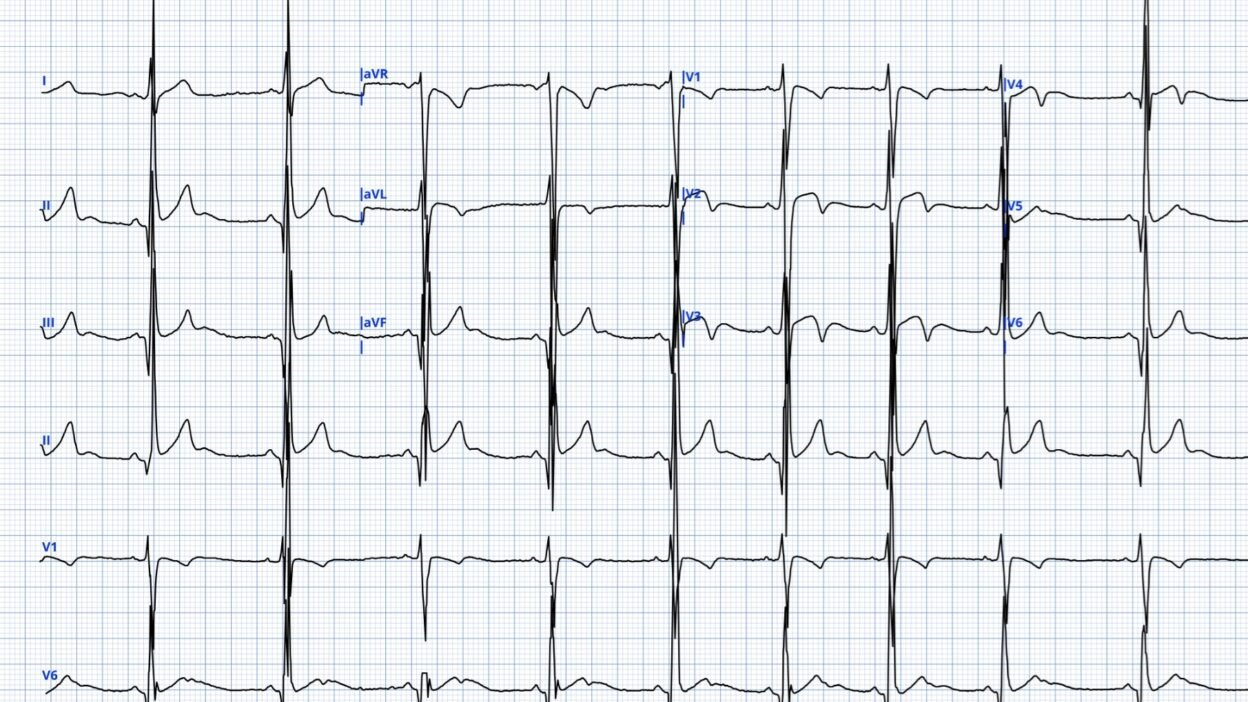
= = =
Figure-1: Today’s ECG. (To improve visualization — I’ve digitized the original ECG using PMcardio).
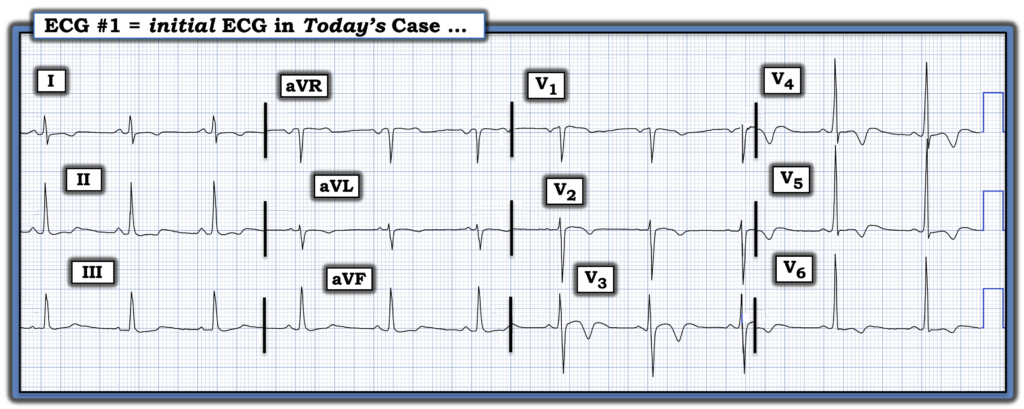
= = =
MY Thoughts:
If told the ECG in Figure-1 was recorded on an otherwise healthy, young adult male without symptoms — I’d suspect this tracing represents a benign repolarization variant because:
- It “looks like” a benign repolarization variant.
- The rhythm is sinus. The PR interval is normal, the QRS is narrow — and if anything, the QTc looks relatively short. The frontal plane axis is normal. Depending on the age of this patient — the relatively generous R wave amplitudes in lateral chest leads may (or may not) qualify as voltage for LVH.
- Q waves are absent and R wave progression is completely normal (with a prominent R wave by lead V3 — and transition occurring normally between leads V3-to-V4).
- Most remarkable is the finding of T wave inversion in multiple leads — but this is associated with:
- A benign appearance in lead V3 — in which this lead with deepest T wave inversion manifests very smooth ST segment coving with slight ST elevation (and terminal U wave elevation).
- An equally benign appearance in lead V4 — in which the deep TWI is accompanied by generous R wave amplitude, a minimal s wave (and terminal U wave elevation).
- Smooth “transition” in neighboring leads leading up to and away from these benign-appearing leads V3,V4 (ie, in leads V1,V2; and V5,V6).
- No more than modest nonspecific ST-T wave abnormalities in the limb leads.
- My Impression of Figure-1: Given the above history, if this ECG passed my desk — I’d suspect this tracing represents a form of BTWI (Benign T Wave Inversion). That said — I would clearly suggest clinical correlation (ie, specific questioning to ensure that the patient is active and truly without symptoms — and careful cardiac auscultation to ensure no murmur). I might recommend an Echo to verify the absency of underlying structural abnormality — but I’d suspect BTWI (See below in my ADDENDUM).
= = =
Back to Today’s CASE:
Now imagine that you are told that this same ECG (that I’ve again reproduced in Figure-2) — was obtained for a man in his 30s who presented to the ED for CP (Chest Pain) — and who was found to have moderate Troponin elevation that prompted cardiac cath with PCI for an LAD “culprit” lesion. You are not given any additional clinical information — other than that the ECG in Figure-2 was obtained after PCI. Given this clinical scenario (which is essentially the history provided by Dr. Nossen for the 1st patient he presented).
— How would YOU now interpret the ECG in Figure-2? —
= = =
Figure-2: Take another LOOK at today’s ECG — now considering that this man in his 30s presented for CP — that he had moderate Troponin elevation — and that he underwent PCI for an LAD “culprit”, with this ECG representing the initial post-PCI tracing.
= = =
My Thoughts on the ECG in Figure-2:
This is the same ECG presented in Figure-1 — but given the alternative history we are provided (in which this patient had CP, moderate Troponin elevation, and underwent PCI for an LAD “culprit” — with this ECG being the post-PCI tracing) — I’d suspect the at least some of the chest lead T wave inversion to represent a component post-PCI reperfusion.
- I’d still think that the overall appearance of the ECG in Figure-2 looks a bit unusual for reperfusion of an LAD “culprit” given the normal R wave progression with generous R wave amplitude and these diffuse ST-T wave changes so soon after PCI — but the inferior lead findings might represent reciprocal changes — and given the description of clinical and cath findings, this patient had to have had an LAD lesion that was reperfused by PCI — so at least some of this T wave inversion may represent reperfusion changes
- I’d do my utmost to look in the patient’s records for a prior tracing recorded before today.
- I’d search today’s medical record (ie, There must have been an earlier ECG recorded in triage or in the ED before cath was performed!).
- My Impression of Figure-2: I would probably suspect that this young adut male may have some form of preexisting repolarization variant — on top of which some of the T wave inversion that we see in Figure-2 represents superimposed post-PCI reperfusion changes.
= = =
ADDENDUM: Key ECG Features suggesting BTWI
I’ve excerpted below from My Comment in the JUNE 30, 2023 post of Dr. Smith’s ECG Blog — the 9 Criteria derived over the years by Drs. Wang and Smith as suggestive of BTWI. With experience — recognition of these criteria becomes automatic — but until that experiential point is attained, referral to the following bulleted list of these 9 Criteria may prove invaluable. (NOTE: I’ve enclosed in parentheses after each criterion which findings are relevant to today’s ECG):
- Criterion #1: There is a relatively short QT interval (Assuming the rounded elevated positive deflection following T wave inversion in leads V3,V4,V5 represents a U wave — the QTc looks to be barely 400 msec.).
- Criterion #2: The leads with T-wave inversion often have very distinct J-waves (Not seen in today’s ECG …).
- Criterion #3: The T-wave inversion is usually in leads V3-V6 — which is in contrast to Wellens’ syndrome, in which T-wave inversion is usually in leads V2-V4 (T-wave inversion in today’s ECG is maximal in leads V3,V4,V5).
- Criterion #4: The T-wave inversion does not evolve and is generally stable over time — which is in contrast to Wellens’ Syndrome, which always evolves. (We unfortunately lack this information in today’s case …).
- Criterion #5: Chest leads with T-wave inversion often have some ST elevation (Slight ST elevation is seen in leads V2,V3 of today’s ECG).
- Criterion #6: Right chest leads often have ST elevation typical of classic early repolarization (Not present in today’s ECG …).
- Criterion #7: The T-wave inversion in leads V4-V6 is preceded by minimal S-waves (No more than very small S waves are seen in leads V5,V6 of today’s ECG).
- Criterion #8: The T-wave inversion in lateral chest leads V4-V6 is preceded by high R-wave amplitude (There is normal R wave progression in today’s ECG — and the R waves in leads V4-V6 are quite tall! ).
- Criterion #9: Leads II, III, and aVF also frequently have T-wave inversion (The inferior leads in today’s ECG show ST segment straightening with slight depression — but not T wave inversion comparable to that seen in the chest leads; Instead — it is leads I,aVL that show some ST coving and T wave inversion …).
- = = =
- Criterion #10: Based on today’s ECG and commentary above by Drs. Nossen and Smith — I’ll add a 10th Criterion in favor of BTWI = large positive U Waves in an ECG from a younger adult in association with larger QRS amplitudes and “benign-looking” ST-T waves (as large positive U waves in this context are generally not associated with reperfusionT waves).
= = =
= =