A man in his late 60s was convalescing in the hospital following bilateral lung transplantation for pulmonary fibrosis. Medical history is also significant for rheumatoid arthritis and chronic steroid use (a risk factor for coronary artery disease). On postoperative day 2, ECG was obtained.
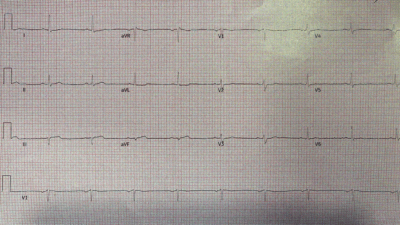
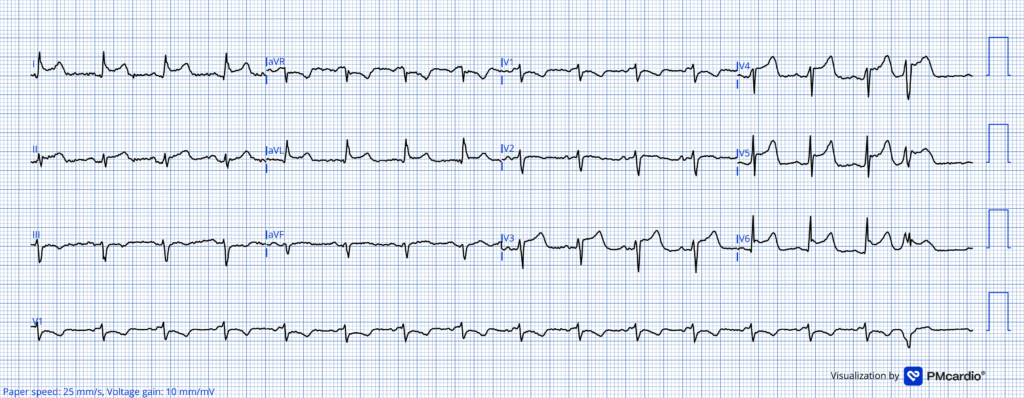
ECG 1
What do you think?
The GE algorithm interpretation was ** ** ACUTE MI / STEMI ** **
Looking closely at this ECG we see:
- Sinus tachycardia (uncommon in OMI in the absence of cardiogenic shock)
- Concave ST segments, even with an initial downslope in some leads
- Marked asymmetry to the T waves (more gentle upslope, sharper downslope)
Smith: Unfortunately, in LAD OMI, concavity can be present in all leads with ST elevation. So that alone does not rule out the diagnosis. However, in this case, the concavity is extreme, as it is preceded by a very flat ST segment that rapidly turns upward, creating a narrow base to the T-wave. Although there is a lot of area under the curve of the T-wave, if measured from the J-point, there is NOT a lot of area under the curve if measured from the point where the complex turns upward into the T-wave. In fact, from this point, the T-wave has a very narrow base. Moreover, the STE in I and aVL, which might indicate proximal LAD occlusion, is not associated with inferior ST depression; in fact, there is STE in lead II. This would be very unusual in proximal LAD OMI. When I was shown this with no information, I said “pericarditis”
When I run this ECG through the Queen of Hearts, she says No OMI but with low confidence. (Low confidence means the diagnosis of OMI must still be pursued aggressively).
Smith: the Queen is amazing at recognizing false positives. This recent study showed a decrease in false positive cath lab activations from 42% to 8%, while identifying OMI correctly on the first ECG in 92% (vs. 70% for standard of care). AI-Enabled ECG Analysis Improves Diagnostic Accuracy and Reduces False STEMI Activations: A Multicenter U.S. Registry
Case continued: On evaluation, documentation indicates that the patient denied chest pain. Bedside echocardiogram showed normal wall motion. Physical exam revealed prominent friction rub. In this context, the combination of history and ECG support refraining from immediate cath lab activation.
Smith: a Friction rub is rarely heard in pericarditis (not sensitive) but when it is heard, the diagnosis quite certain (high specificity). Other ways to confirm pericarditis: pericardial effusion is quite specific. Absence of wall motion abnormality is very specific, if they are high quality images.
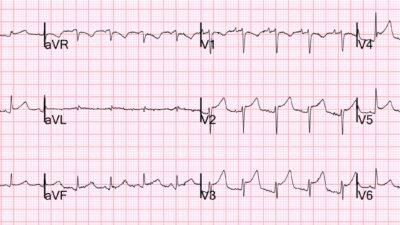
Repeat ECG the following day is shown:
ECG 2
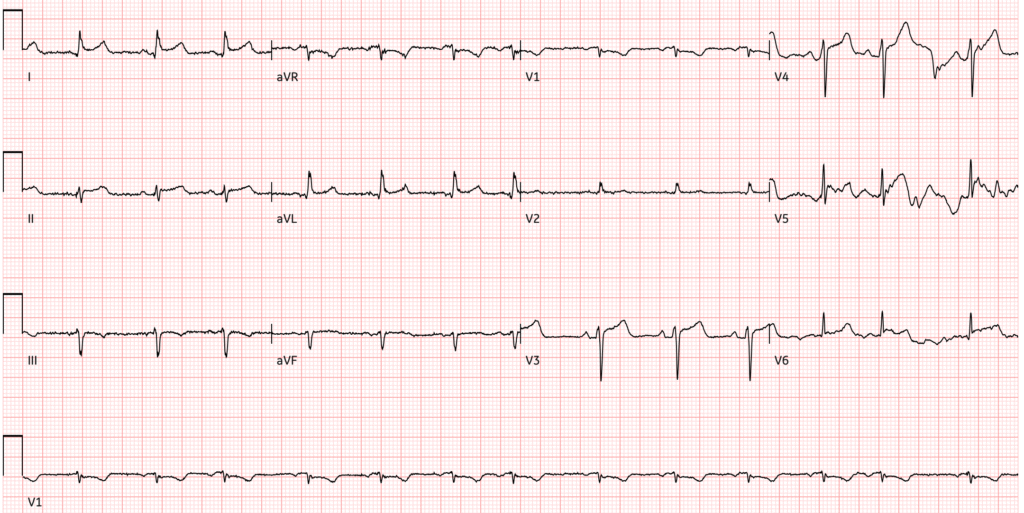
Trying to read through some of the motion artifact affecting some of the leads we would’ve been most interested in, this ECG shows improvement compared to ECG 1, with ST segments still abnormal but on the path to normalization. Initial high sensitivity troponin I was elevated at 2676 ng/L, but improved to 2080 ng/L on repeat.
This is likely immunologically mediated post-cardiac injury syndrome following pericardiotomy as part of the lung transplant, which can be treated with colchicine to reduce the risk of recurrence.
Smith: so although this is not proven by negative troponins and/or negative angiogram, the entire clinical picture, including the ECG, point toward pericarditis/myocarditis.
= = =
======================================
MY Comment, by KEN GRAUER, MD (1/21/2026):
Today’s case by Dr. Frick features a series of interesting ECG findings — that take on a very different significance once the history of this patient is known.
- Viewed without the benefit of any history — the 12-lead tracing in Figure-1 would clearly raise suspicion of an unusual distribution acute injury pattern.
= = =
Today’s history is enlightening:
- The ECG in Figure-1 was presumably obtained as routine on this patient’s 2nd-post operative day following major open-chest surgery for bilateral lung transplantation.
- The patient was not having chest pain.
- Bedside echo showed normal wall motion.
- A prominent pericardial friction rub was heard.
- My Impression: As per Dr. Frick — the above clinical scenario strongly suggests PCIS (Post-Cardiac Injury Syndrome) as the etiology for the worrisome ECG findings in Figure-1 (and not acute infarction! ).
= = =
What are the ECG Findings?
As per the Platek at al reference recommended above by Dr. Frick (JACC Adv 4(10), 2025) — PCIS entails a group of inflammatory pericardial syndromes that occur following cardiac injury, as may occur following the extensive bilateral lung transplantation procedure that today’s patient underwent. These syndromes encompass: i) Post-MI Syndrome; — ii) Post-pericardiotomy syndrome; — and, iii) Post-traumatic pericarditis.
- My Thoughts: I see no reference citing any specific ECG picture to expect with PCIS — with ECG findings likely to vary depending on the source of cardiac “injury” (PCIS may be seen following cardiac surgery with pericardiotomy, after pacemaker insertion, ablation procedures, PCI, and/or blunt or penetrating chest trauma).
- I’d therefore expect the ECG to show findings of pericarditis combined with those of cardiac injury (similar to the array of ECG findings that might be seen with acute myopericarditis — depending on how diffuse the involved area was).
= = =
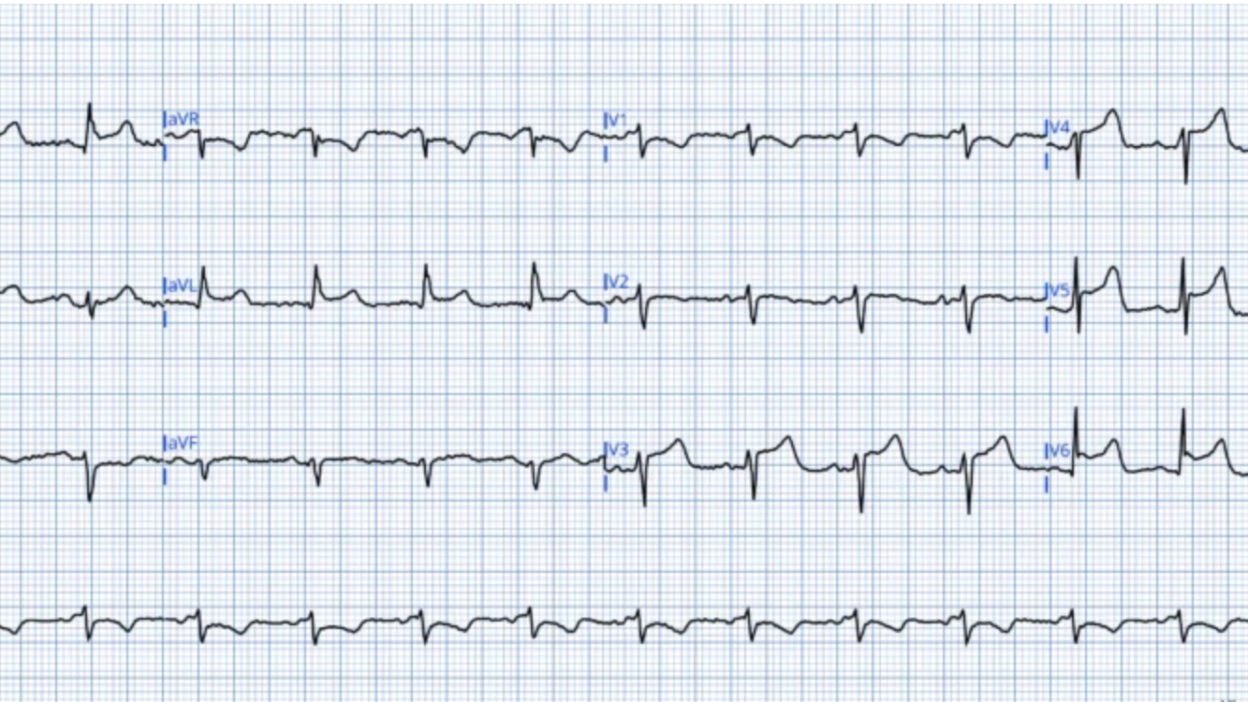
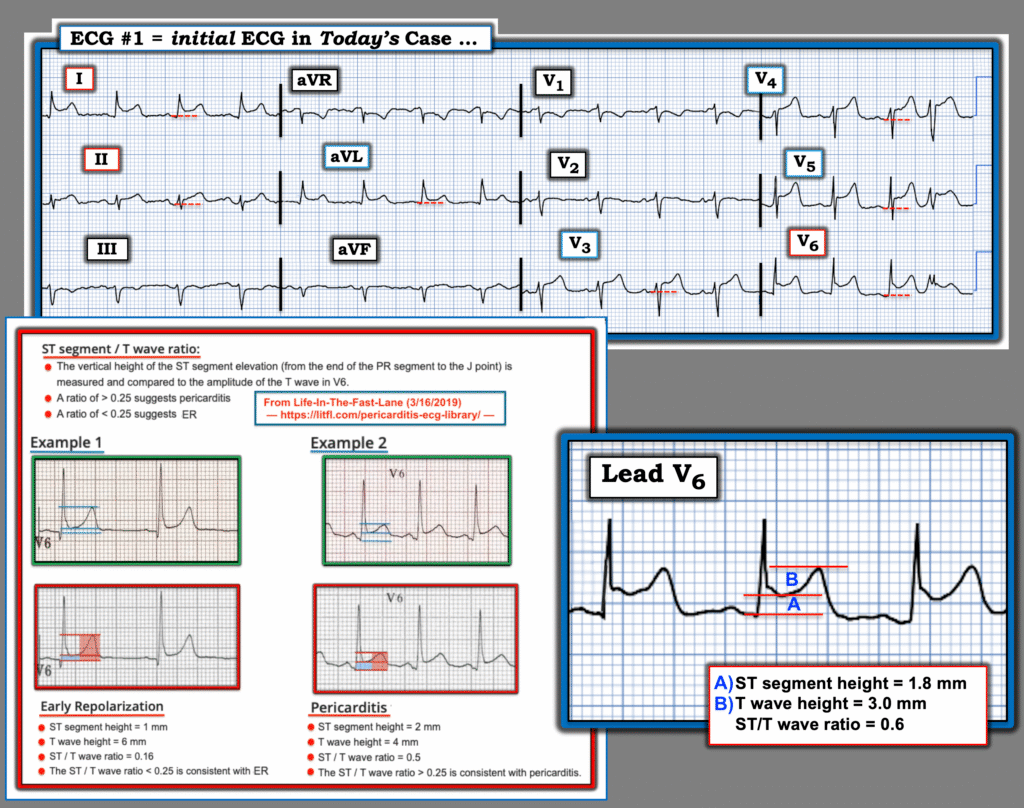
For clarity in Figure-1 — I’ve reproduced and labeled today’s initial ECG.
- The rhythm is sinus tachycardia — with a PVC as the last beat.
- As per Dr. Frick — there is concave up (“smiley”-configuration) ST elevation in multiple leads ( = leads I,aVL; V3,V4,V5,V6) — with ST segment straightening for the ST elevation in lead II.
- The amount of this ST elevation is especially marked in the chest leads. The shape of this ST elevation is consistent with that seen in acute pericarditis, albeit a little less generalized (Simple acute pericarditis often also results in similar ST elevation in leads aVF and V2).
Two features I always look for when assessing ECGs for possible perricarditis are:
- i) The ST elevation pattern in lead II looks more like that in lead I with acute pericarditis (whereas with acute MI — the ST segment in lead II is more likely to look like that in lead III, which is not the case here);
- ii) With pericarditis — the RATIO of the amount of ST elevation to T wave amplitude in lead V6 is usually more than 0.25 (ie, height of the ST elevation, as measured from the end of the PR segment to the J-point — should be more than 1/4 of the height of the T wave in lead V6). As shown in Figure-1 — the ST/T wave ratio = 0.6, which clearly satisfies this criterion.
- NOTE: I review and illustrate these 2 clues (and other clues) to the diagnosis of pericarditis in My Comment at the bottom of the page in the September 28, 2025 post in Dr. Smith’s ECG Blog.
Finally — There are impressive “reciprocal” changes to the multiple lead ST elevation we see from pericardial inflammation:
- Specifically, in right-sided leads aVR and V1 — there is PR segment elevation, T wave inversion, and marked J-point ST depression (comparable to the surprisingly large amount of ST elevation in the chest leads).
- The remaining right-sided lead ( = lead III) — shows ST segment flattening, with subtle T wave inversion.
= = =
Concluding Thought: We continually emphasize in Dr. Smith’s ECG Blog how when a patient presents to the ED with new cardiac-sounding chest pain — pericarditis is rare. Such patients are far more likely to have acute ischemic heart disease.
- Today’s history is very different. In this different clinical context — the ECG in Figure-1 is completely consistent with what one might expect with PCIS (Post-Cardiac Injury Syndrome) following bilteral lung transplantation.
= = =
Figure-1: I’ve reproduced and labeled today’s initial ECG. (Below the 12-lead ECG — I’ve magnified lead V6 to assess the ST/T wave ratio).
= = =
= = =