A 70-something Patient started having chest pain about one hour prior to arrival.
She had had a “heart attack” about two weeks ago in a developing country and states that it feels like that same pain. There was some shortness of breath associated with it. No recent sick symptoms. It has been managed medically in that country. BP was 134/79.
What do you think?
I read this on the system with no information as “Subacute MI. It is also typical of LV aneurysm.”
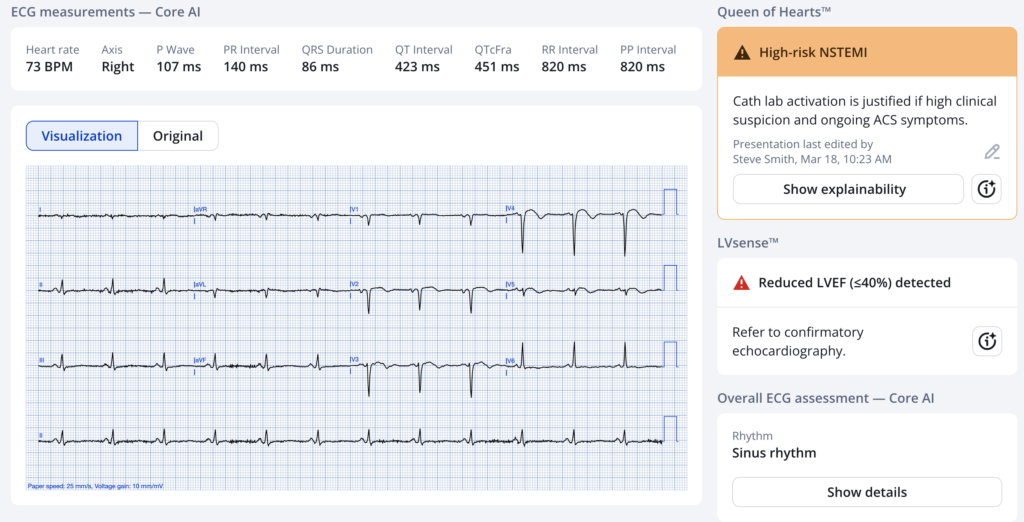
Here is the interpretation of the Queen of Hearts:
New PMcardio for Individuals App 3.0 now includes the latest Queen of Hearts model and AI explainability (blue heatmaps)! Download now for iOS or Android. https://www.powerfulmedical.com/pmcardio-individuals/ (Drs. Smith and Meyers trained the AI Model and are shareholders in Powerful Medical). As a member of our community, you can use the code DRSMITH20 to get an exclusive 20% off your first year of the annual subscription. Disclaimer: Certain AI ECG Modules are CE-marked medical devices under EU MDR and are certified for marketing only in the European Union and the United Kingdom. PMcardio technology has not yet been cleared by the US Food and Drug Administration (FDA) for clinical use in the USA.
She was put on a NTG drip. The initial hs troponin I returned at 42 ng/L (slightly elevated). A repeat returned at 30 ng/L
Her pain was uncontrolled.
Therefore, cardiology was consulted and, due to uncontrolled pain, they took her for angiogram. This is excellent guideline directed care.
Just as the Queen prescribed, if there are ongoing symptoms, “cath lab activation is justified.”
It showed a culprit in the LAD spanning the first diagonal, with TIMI-2 flow. Apparently enough flow to preclude more infarction, but not enough to prevent chest pain!
Formal Echo:
The estimated left ventricular ejection fraction is 20-25%.
Normal LV cavity size and wall thickness.
Regional wall motion abnormality-dyskinesis of the apex and all apical
myocardial segments; hypokinesis the mid to basal anteroseptal and
inferoseptal, myocardial segments.
Left ventricular thrombus in the apical lateral region (1.47 cm x 0.78cm).
In other words, there is an LV aneurysm with thrombus. Dyskinesis = Aneurysm.
LV thrombus is very common in LV aneurysm, since there is inflammation of the subendocardial wall and there is stasis. In the old days, when there was a completed anterior MI, we always started a patient on heparin to prevent LV thrombus.
Serial ECGs before cath showed no change
ECG after cath: also no change.
So there was really what one might call “unstable angina” (minimal trops that are falling after a previous MI — they might just be falling due to the previous MI!) after a completed anterior MI with LV aneurysm.
= = =
======================================
MY Comment, by KEN GRAUER, MD (3/18/2026):
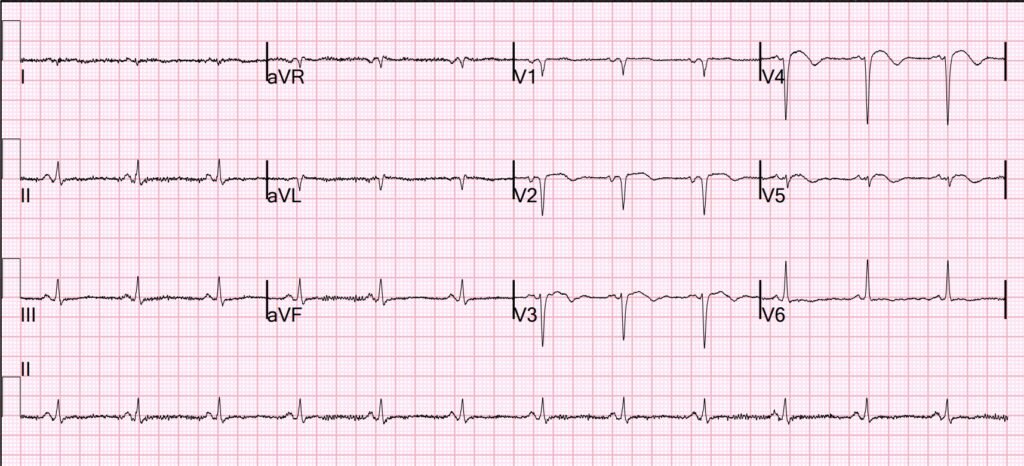
Today’s initial ECG tells not one — but 2 potential stories.
- We are told that this patient is 70-something — with a history of having had an MI in a developing country ~2 weeks earlier — who now once again is having CP (Chest Pain) that began ~1 hour before the ECG in Figure-1 was recorded.
- Interpretation of ECG #1 would be far easier if we had access to this patient’s last ECG recorded at the time of her MI in that developing country. But we do not.
= = =
Story #1:
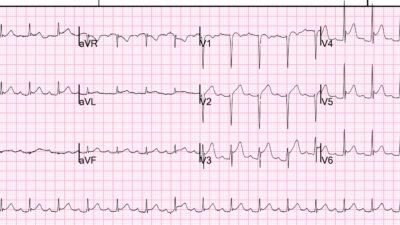
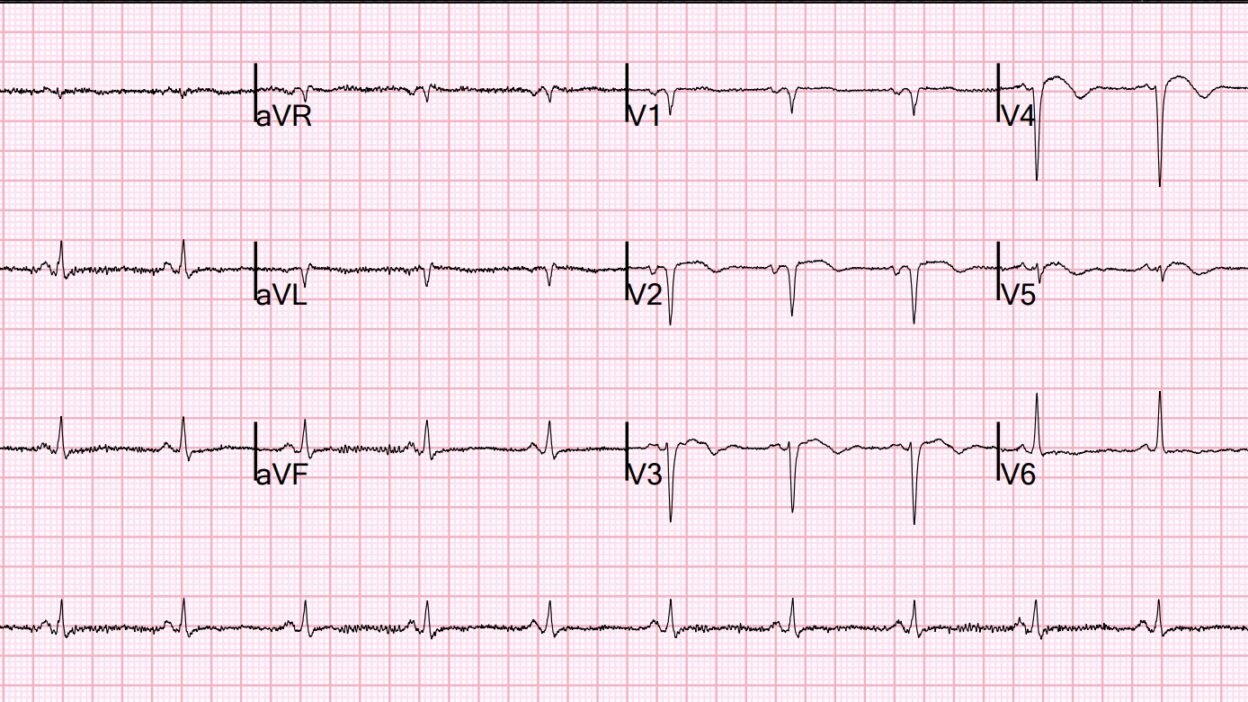
As per Dr. Smith — the ECG in Figure-1 tells us that this patient has had an antero-septal MI at some point in time — almost certainly the result of LAD occlusion.
- The rhythm is sinus at ~70/minute. The QRS is narrow.
- There are QS complexes in leads V1,V2. A small r wave is present in lead V3 — but there is actually loss of r wave between lead V3-to-V4 (which appears to be a real effect given that despite greater S wave amplitude in lead V4, the r wave in this lead is smaller than the r wave in V3).
- The entire QRS is tiny in lead V5 — but regardless, one would expect by lead V5 to have more positivity than the 1 mm r wave that we see.
- Transition finally occurs by lead V6.
- Otherwise — ST segments are coved in leads V2-thru-V5 — with slight ST elevation and terminal T wave inversion in these leads.
- Bottom Line: While difficult (impossible) to “date” the findings we see ECG #1 from this single tracing — this pattern of reduced R wave progression with loss of r wave and associated ST-T wave changes is diagnostic of anteroseptal infarction that could be recent, or which could be “older”.
The History is KEY to putting the events in this 1st “Story” together. The findings in ECG #1 are perfectly consistent with this patient’s description of having had an MI ~2 weeks earlier. The limited amount of ST elevation of coved morphology, with associated T wave inversion in leads V2-thru-V5 looks “older” rather than acute (= perfectly consistent with Dr. Smith’s suspicion of LV aneurysm).
- The above said — this patient’s recurrence of CP means that despite the lack of acute ST-T wave changes in ECG #1 — prompt cath to define the anatomy is needed (with cath results described above by Dr. Smith confirming our clinical suspicions).
= = =
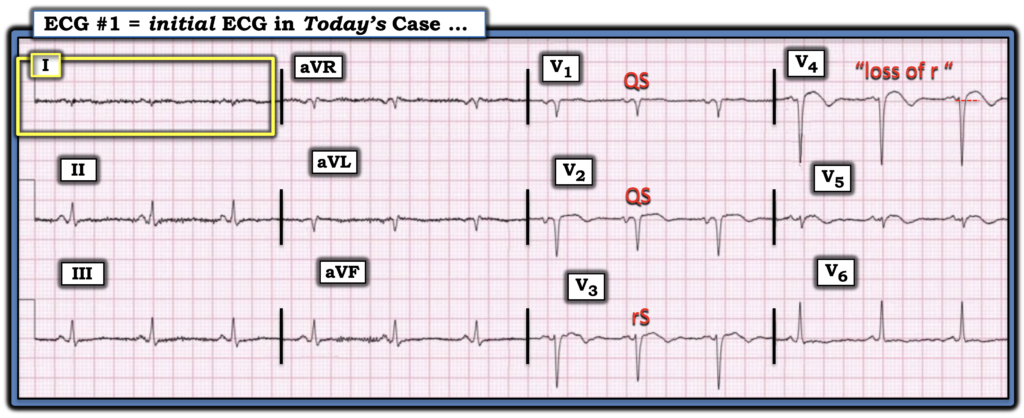
Figure-1: I’ve reproduced and labeled today’s ECG.
= = =
Potential Story #2:
An additional ECG finding to note in Figure-1 — is the near null vector that we see in lead I (within the YELLOW rectangle). While not in the least altering our clinical assessment of recent anteroseptal MI, now with probable LV aneurysm and need for prompt cath — the astute clinician will note this interesting and uncommon ECG finding of a near null vector in lead I that should prompt consideration of 3 possible explanations:
- #1) Recognition of a flat line ( = zero potential) QRST complex in one of the 3 standard limb leads (ie, in lead I, II or III) — should immediately suggest the possibility of lead reversal (See My Comment at the bottom of the page in the October 12, 2024 post). If the zero potential lead is lead I — this suggests bilateral arm-leg reversal (See Life-In-The-Fast-Lane for details). Reasons I do not think lead reversal is the cause of the lead I appearance within the YELLOW rectangle in Figure-1 — is that rather than a flat line, ECG #1 does manifest a QRS complex and T wave. In addition — the QRS complex is upright in the inferior leads, whereas it will typically be predominantly negative with bilateral arm-leg reversal.
- #2) The near null vector in lead I of Figure-1 might simply be the result of low voltage. As we review HERE — among the many causes of low voltage — are myocardial “stunning” as may be seen in association with a large infarction. While this explanation cannot be ruled out from the single ECG shown in Figure-1 (and this patient has had a recent large infarction — and overall QRS amplitude is reduced in this tracing) — it would seem less plausible for “low voltage” to produce only a single null vector in lead I, as is seen in today’s tracing.
- #3) The near null vector in lead I could represent a Schamroth Sign — in which the P wave, QRS complex and T wave are all under 2 mm in size. While sensitivity of this sign is very low (ie, It is rare that you will see it) — its presence is highly suggestive of longstanding and severe pulmonary disease.
- PEARL: The ECG diagnosis of RVH is often challenging. On occasion — I have found awareness of Schamroth’s Sign to be helpful in recognizing probable severe pulmonary disease with RVH when other ECG findings were inconclusive.
- FINAL Thought: I wish I knew a bit more about this patient’s medical history (and what an Echo might show).
= = =
= = =