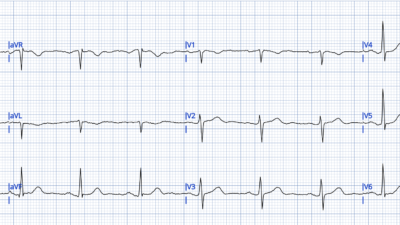
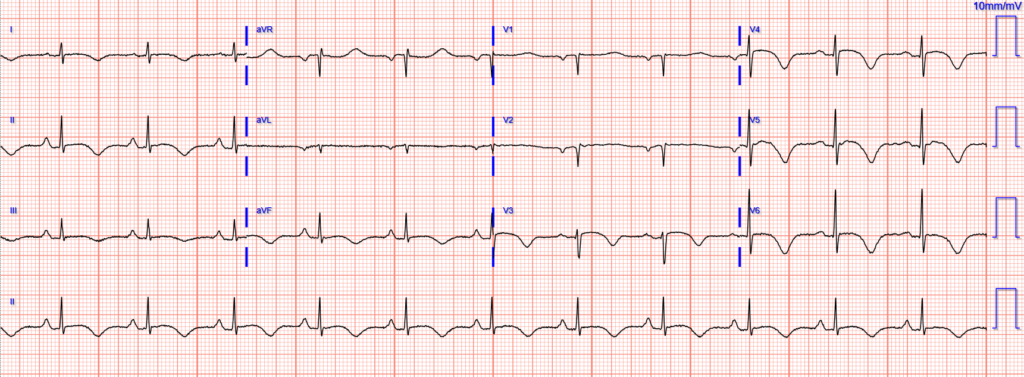
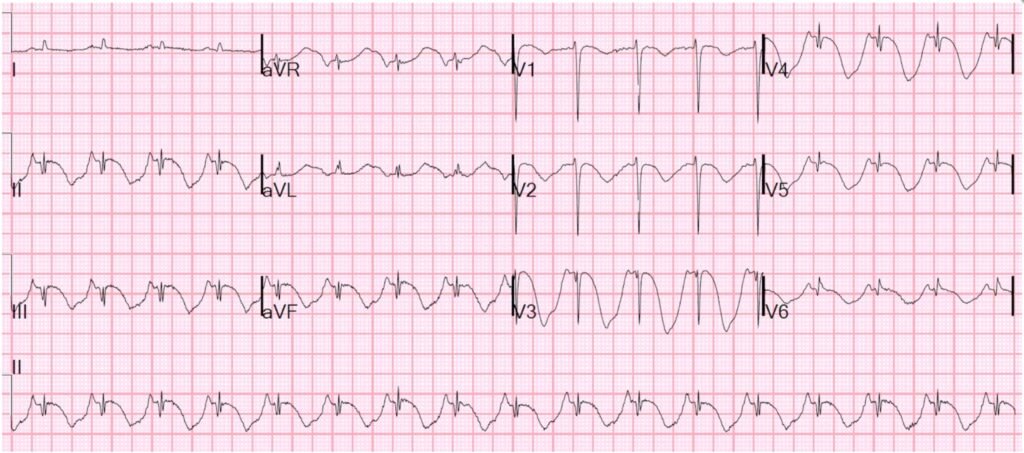
EMS was called to a home for a “life alert” (a simple device used by patients to call for medical help in the outpatient setting). Upon arrival a woman in her 60s was found on the ground with altered mental status and respiratory distress. Blood glucose was normal. Her vitals were notable for hypoxemia, severe hypertension at 280/160 mm Hg, and tachycardia at 133 bpm. An ECG was performed during transport:
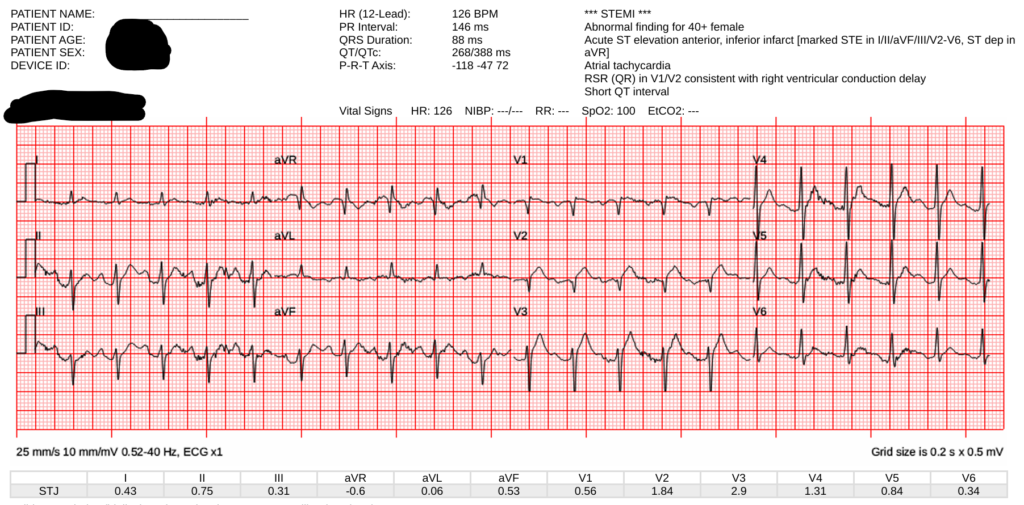
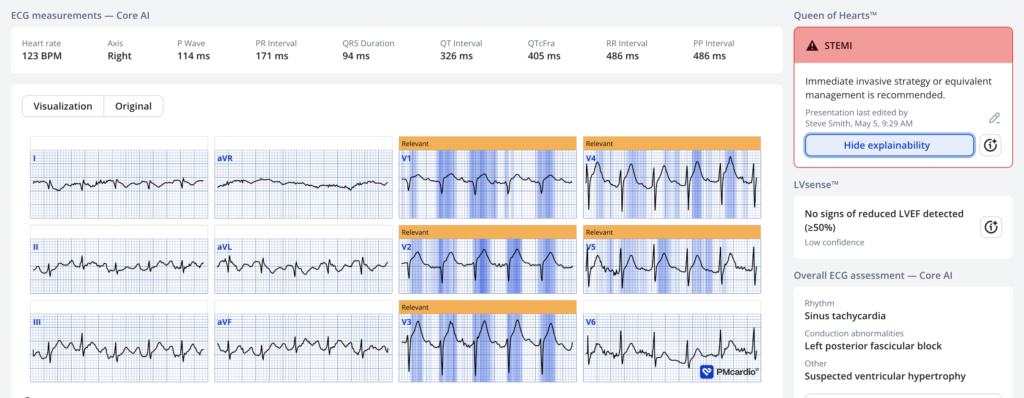
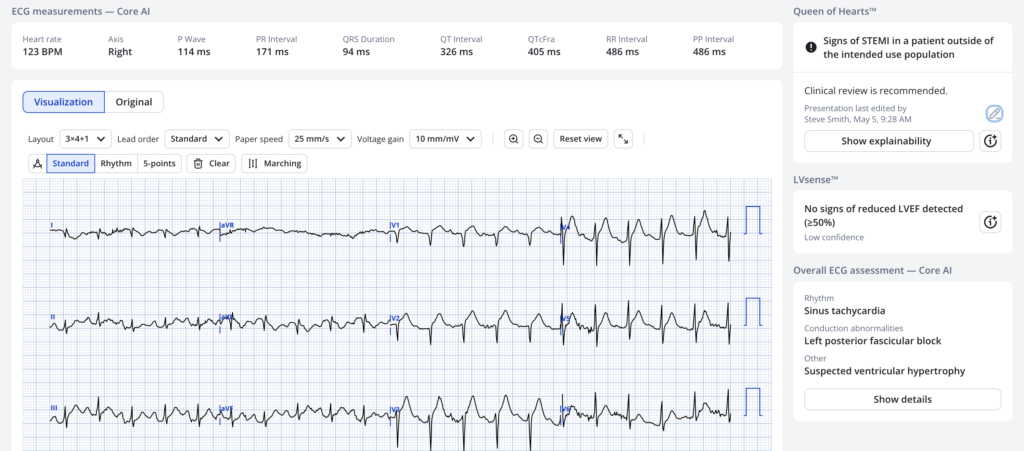
There is tachycardia, which always makes the diagnosis of OMI suspect unless there is cardiogenic shock. ST Elevation and a hyperacute T-wave in V2 and probable in V3. (Our quantitative HATW score was 0.6).
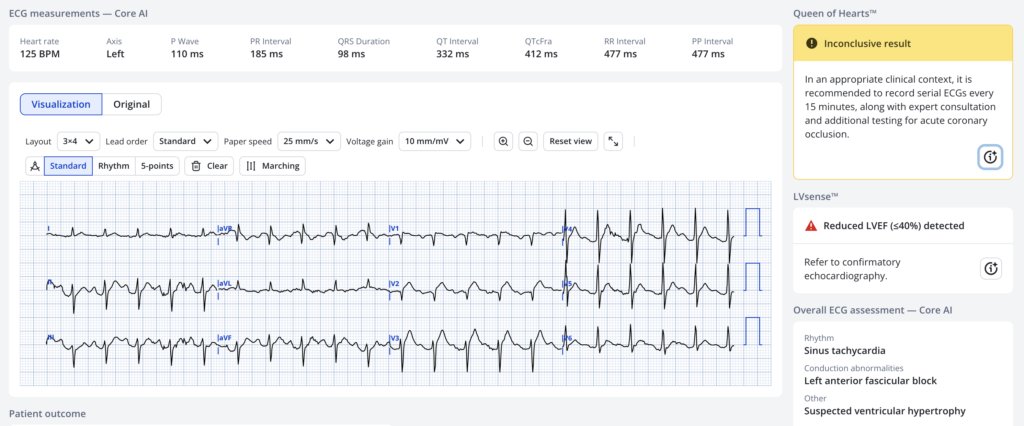
Here is the Queen’s interpretation (score was 0.35; positive is >0.50):
The ECG was transmitted to the receiving Emergency Department.
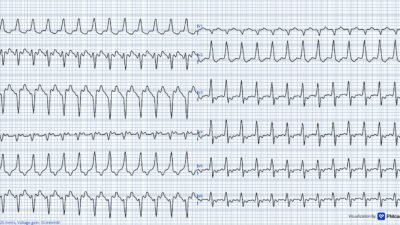
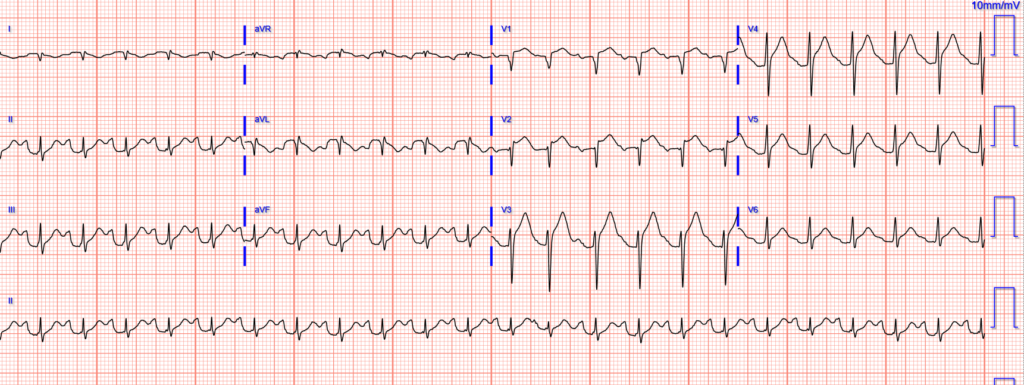
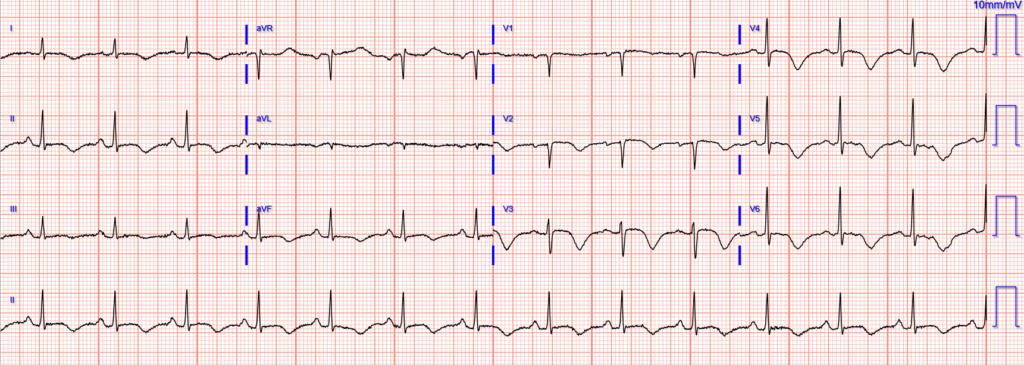
On arrival, the patient was intubated for altered mental status and respiratory failure, and initial resuscitation was continued. An ECG was obtained:
Both ECGs above show sinus tachycardia with abnormal anterolateral STE and hyperacute T waves (our HATW score is 94%!!) These findings certainly would be consistent with acute transmural injury of the anterior wall (the most common cause of which is acute coronary occlusion myocardial infarction).
Here is the Queen’s interpretation if ACS is highly suspected:
Score is 0.98 (very certain)
Here is the Queen’s interpretation if there is low suspicion of ACS:
Case continued
Code STEMI was activated, but cancelled by cardiology due to perception of unclear history and ECG.
CT head was without acute bleed, but an “age-indeterminate lacunar infarct”.
A stat bedside transthoracic echo showed 30% EF, severe LV hypokinesis with apical sparing, as well as severe reduction in RV function with preserved function of the basal free wall. It was read as concerning for “stress induced cardiomyopathy vs multivessel CAD”.
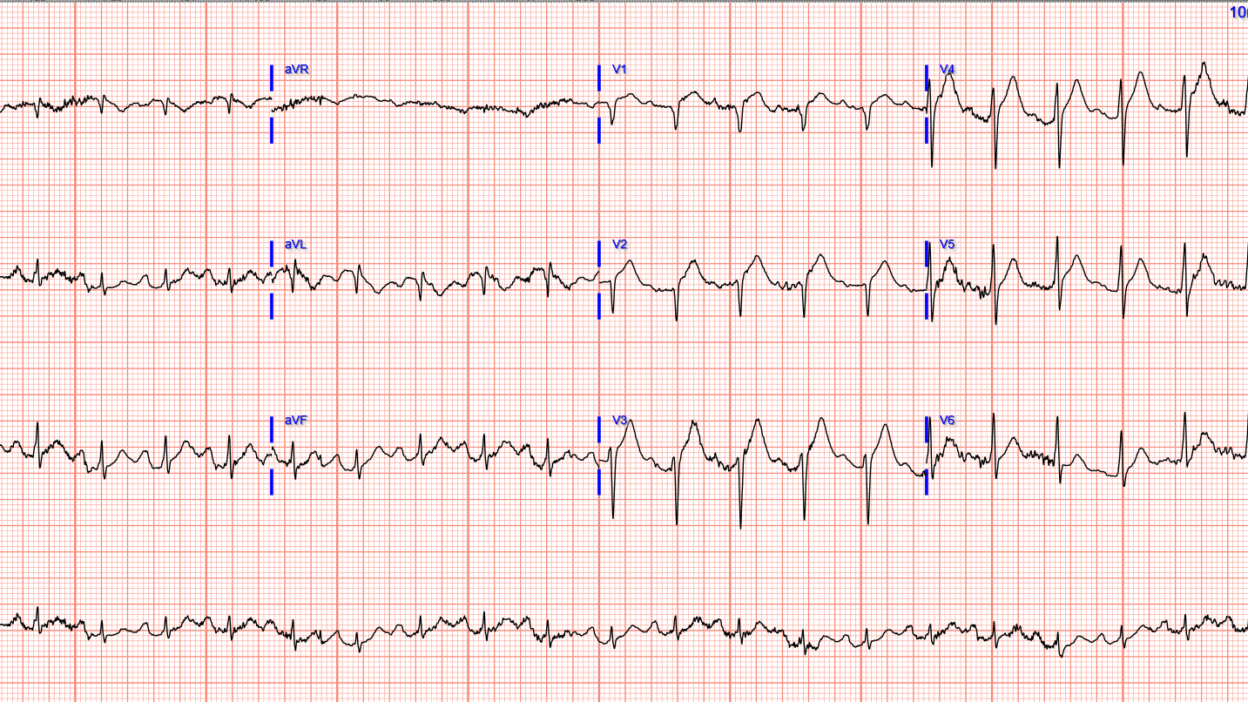
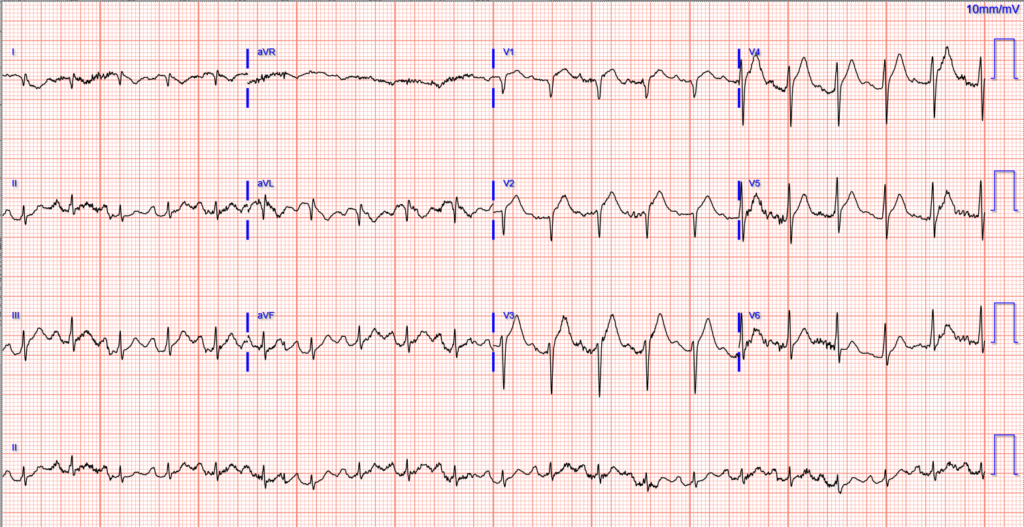
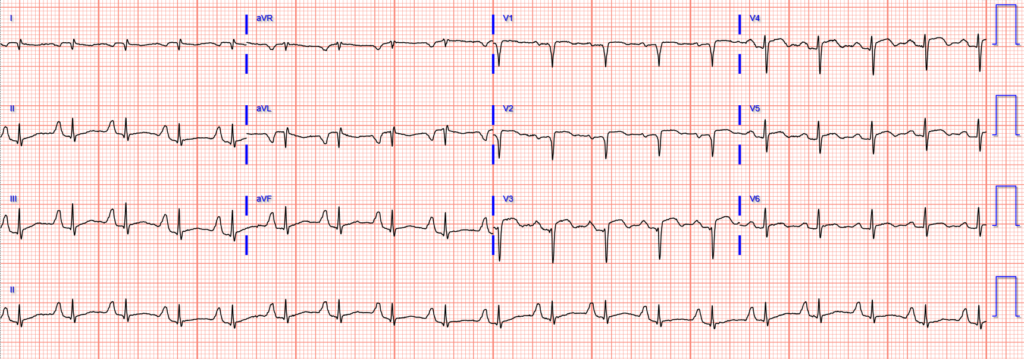
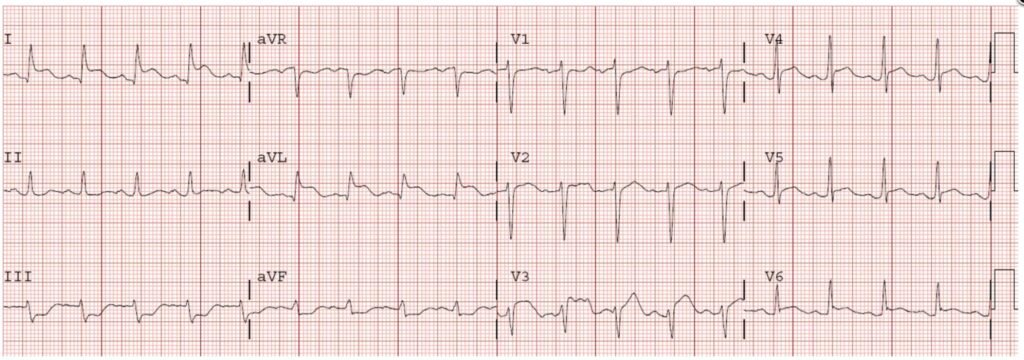
Repeat ECG 1 hour after arrival:
Initial troponin I was 646 ng/L.
The patient went to the cath lab around 4 hours after arrival, where they described only mild diffuse CAD in all vessels (no % stenosis given for any vessels), without any obstructive disease. No IVUS was performed.
She was admitted to the MICU.
Further troponins were:
- 1,511 ng/L
- 2,546 ng/L
- 856 ng/L
- (none further ordered)
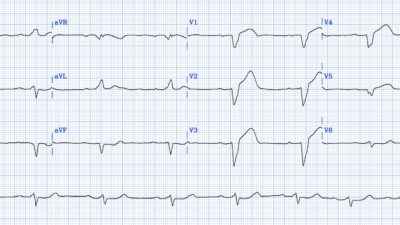
Repeat ECG 6 hours later:
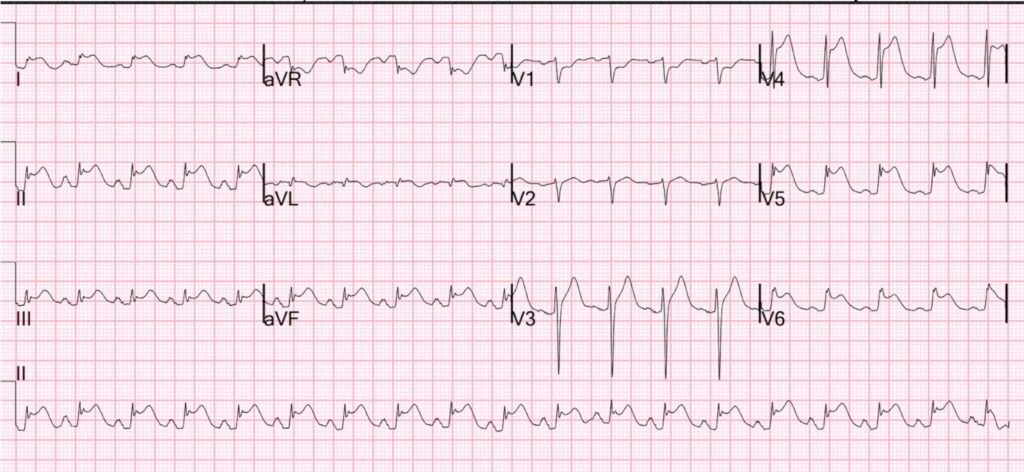
Repeat ECG next day (approximately 18 hours after arrival):
Repeat ECG on day 3:
The patient is awaiting MRI and full neurologic evaluation after extubation, but the working diagnosis is an acute/subacute stroke causing takotsubo/stress cardiomyopathy.
Some notes and opinions about takotsubo / stress cardiomyopathy:
- Our experience aligns with a small body of literature that many of these patients experience a dynamic ECG course including
- an initial phase with findings that can be indistinguishable from acute coronary occlusion MI
- a transition within hours or days to deep and total T wave inversion with progressively prolonged QT
- https://pubmed.ncbi.nlm.nih.gov/30309474/
- https://pubmed.ncbi.nlm.nih.gov/32702407/
- The Queen of Hearts is very good at identifying OMI mimics (decreased false positives from 42% to 8% while also improving sensitivity), but takotsubo one where she only identifies about 50%.
- While clinical history may sometimes help to differentiate, neither the ECG nor the echo can easily differentiate takotsubo from OMI. When the history and ECG are compatible with OMI, we believe that takotsubo is an appropriate diagnosis only after an angiogram confirms no role for acute reperfusion therapies.
- Tachycardia (without shock) is often a soft indicator away from ACS pathology.
- However, tachycardia with shock and poor LV function, as in this case, is fully consistent with acute coronary occlusion.
- Important: The most important clue that this is takotsubo (or “stress cardiomyopathy) and NOT acute coronary occlusion is the clinical presentation of Altered Mental Status. Certainly shock can cause altered mental status, and if the clinical assessment is consistent with shock, then the patient needs the cath lab.
- On the other hand, if the “altered mental status” is coma or near coma, cardiogenic shock will not do this by itself. Such a case would be either
- 1) an intracranial disaster (i.e., usually intracranial bleeding) with takotsubo, OR
- 2) 2 pathologies simultaneously (i.e., stroke and acute OMI).
- On the other hand, if the “altered mental status” is coma or near coma, cardiogenic shock will not do this by itself. Such a case would be either
Here are 2 relevant cases, with presenting ECGs:
Acute coma, then Sudden PEA arrest in front of paramedics, with STEMI?
Collapse, Ventricular Tachycardia, Cardioverted, Comatose on Arrival. OMI is a clinical diagnosis.
And here is another patient with stroke: Spiked Helmet Sign
= = =
==================================
MY Comment, by KEN GRAUER, MD (5/4/2026):
When I first saw today’s initial ECG (that I’ve reproduced in Figure-2 below) — I felt certain the patient was in the midst of evolving an extensive acute anterior MI (from acute LAD occlusion). That said — an uncomplicated acute MI rarely presents with the marked sinus tachycardia that we see in this tracing unless “something else” is going on.
- Given the initial BP = 280/160 mmHg — this patient was clearly not in cardiogenic shock.
- Instead — the patient’s impaired mental status was felt to be the result of a stroke that precipitated Takotsubo Cardiomyopathy (with the catecholamine surge associated with Takotsubo accounting for the tachycardia).
- KEY Points made by Dr. Meyers: — i) Tachycardia (without shock) is a finding in favor of something other than an uncomplicated MI; — and, ii) There are times when neither Echo nor ECG can reliably distinguish between Takotsubo vs OMI (which is why Dr. Meyers suggests not to diagnose Takotsubo Cardiomyopathy until cardiac cath confirms there is no role for acute reperfusion).
= = =
CONFESSION: As I’ve confessed the following admission more than a few times in the past: — It’s easy to overlook Takotsubo Cardiomyopathy. Even experienced providers sometimes forget to consider Takotsubo when they encounter an ECG with worrisome ST elevation — which is why today’s case serves as such a helpful reminder.
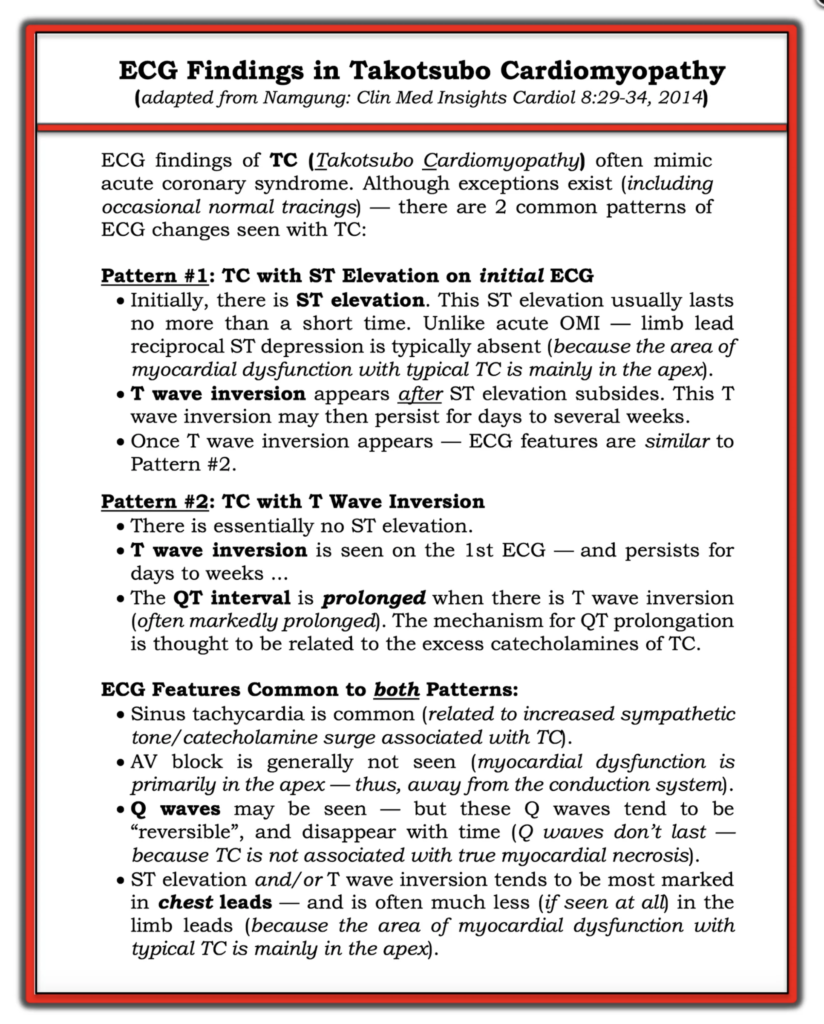
- For this reason — I’ve reproduced in Figure-1 the summarizing Table that I included in the July 21, 2022 post of Dr. Smith’s ECG Blog, in which I review the key ECG findings that help to identify Takotsubo CMP (CardioMyoPathy).
= =
Figure-1: ECG Findings in the “typical” form of Takotsubo CMP — adapted from Namgung in Clin Med Insights Cardiol (See text).
= = = = = = = = = = = =
Additional Points for Recognizing Takotsubo CMP:
- Think of the possibility of Takotsubo CMP when confronted with a patient who presents with a markedly abnormal ECG that doesn’t quite “fit” the clinical picture.
- ECG findings may be out of proportion to clinical findings. ECG changes may involve several lead areas (especially inferior and anterior precordial leads — which typically assess the cardiac apex).
- There may be an element of heart failure.
- Serum Troponin may be positive (although usually not nearly as high as expected given how marked ECG changes may be).
- The patient is most often an older adult (especially a post-menopausal woman).
- There has usually been some form of severe preceding stress experienced by the ptient.
- You’ll typically find that the QTc is markedly increased.
= = = = = = = =
- NOTE: Areas other than the apex may be affected with disorders related to “typical” Takotsubo. Included among these is the variant known as Inverted (or “Reverse”) Takosubo Cardiomyopathy (See My Comment in the July 21, 2022 post for more on “Reverse” Takotsubo).
= = =
Back to Today’s CASE:
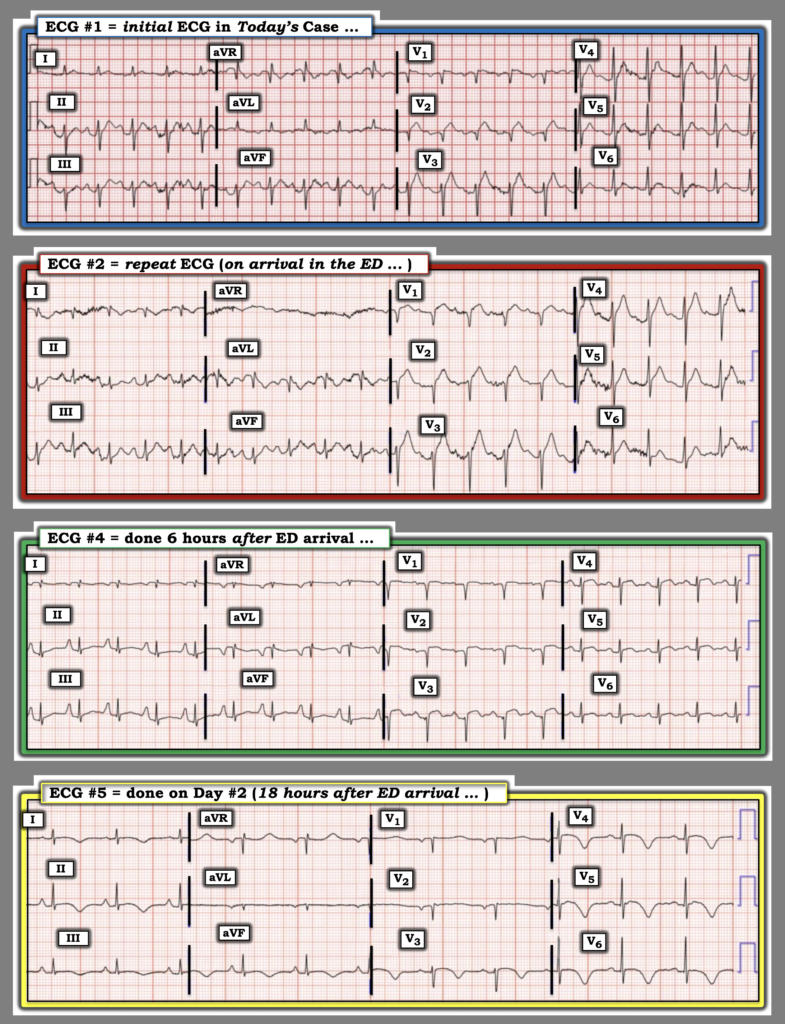
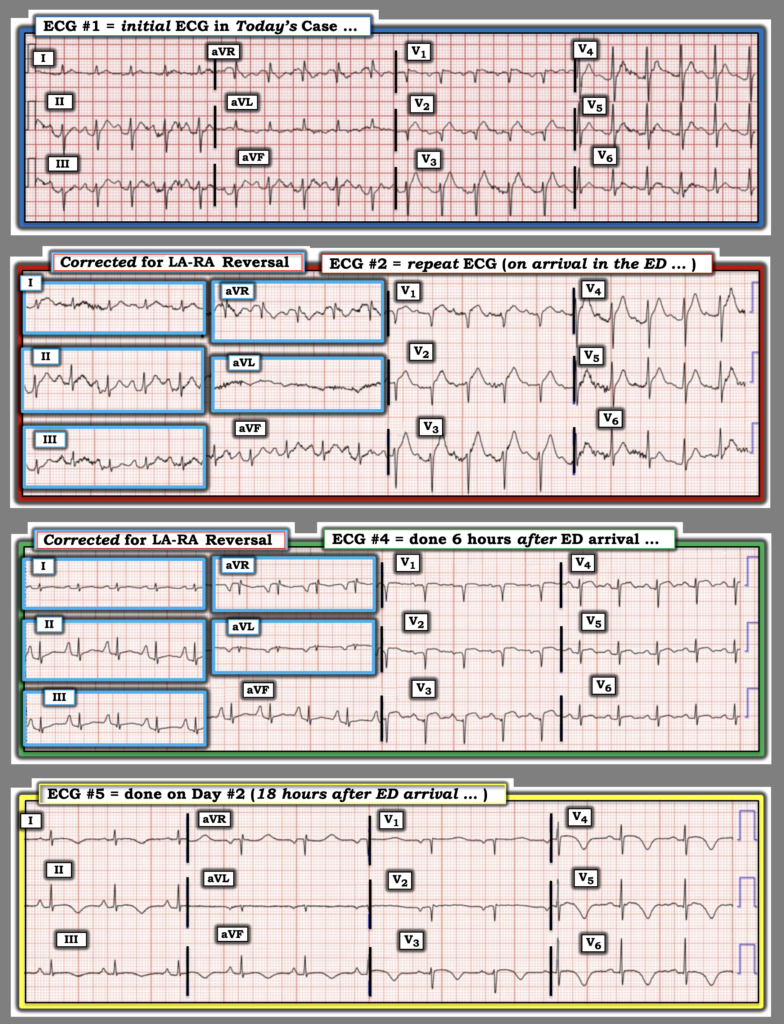
For clarity in Figure-2 — I’ve selected 4 of today’s 6 tracings, and put them together to facilitate comparison. These serial ECGs tell a story — as they provide an important clue to the etiology of today’s case.
- Trace the evolution of today’s case over the course of the 4 serial ECGs shown in Figure-2. Considering the summarizing Table in Figure-1 — What are the findings that you see?
- = = =
- Challenge (Extra Credit): Did you see the “technical misadventure” that is present in 2 of the tracings?
= = =
Figure-2: Comparison between ECGs #1, #2, #4, #5 in today’s case.
= = =
My Thoughts on the ECGs in Figure-2:
Today’s patient is a post-menopausal woman in her 60s who was found unresponsive, presumably from an acute stroke. (As a result of this patient’s unresponsive state — We have no idea if she had chest pain prior to losing consciousness). The patient’s initial BP = 280/160 mmHg.
- ECG #1 — shows a marked sinus tachycardia at ~125/minute. In addition there is LAHB (predominantly negative QRS in all 3 inferior leads) — delayed R wave progression (QS in leads V1,V2 — and no more than a small initial r wave in lead V3) — with hyperacute ST elevation in leads V2,V3 (and more subtle ST elevation in lead V1) .
- Remarkable for its absence — is a lack of reciprocal ST depression.
- My Initial Impression of ECG #1: At this point — I was suspicious of an acute proximal LAD occlusion. That said, unexpected findings for an uncomplicated OMI include: i) The presentation of an acute stroke (with no indication that the patient had chest pain prior to her event); — ii) The marked sinus tachycardia and dramatically increased BP = 280/160 mmHg; — and, iii) The absence of ST elevation in lead aVL, as well as the lack of any inferior lead reciprocal ST depression — both of which are usually seen to at least some degree with acute proximal LAD OMI.
= = = = = = = = =
NOTE: At this point — We might continue with our assessment of the remaining 3 ECGs that I included in Figure-2 — BUT — Did YOU notice the global negativity (of P wave, QRS and T wave) in lead I of ECG #2?
- This “global negativity” (of P, QRS and T wave) in lead I was not present in ECG #1!
- This global negativity in lead I continues to be present in ECG #4 (which was done while the patient was still in the ED). In contrast — global negativity is no longer seen in ECG #5 (which was done the next day — presumably recorded by a different ECG technician).
- KEY Point: By the term, “global negativity” in lead I — I mean the presence of an inverted P wave and inverted T wave — and — a deep and wider-than-expected Q wave with predominant negativity (ie, a small terminal r wave in the QRS can be seen).
- A deep Q wave with predominant negativity of a narrow QRS in lead I is virtually never normally seen — unless there is lead reversal, dextrocardia, or a bizarrely abnormal baseline ECG.
- And, when in addition to a predominantly negative QRS in left-sided lead I — you also see a negative P wave and a negative T wave in a tracing in which dextrocardia is ruled out by appropriate R wave progression (as we see in ECG #2) — the cause is almost always the result of a mix-up of the left and right electrode leads.
BOTTOM Line: I believe there is LA-RA lead reversal in ECG #2 and ECG #4 (as well as in the 3rd ECG that was done in this case, which was recorded in the ED about 1 hour after the patient’s arrival).
- For easy access — We review numerous examples of various lead reversals in the Research & Resources MENU that appears at the top of every page of Dr. Smith’s ECG Blog.
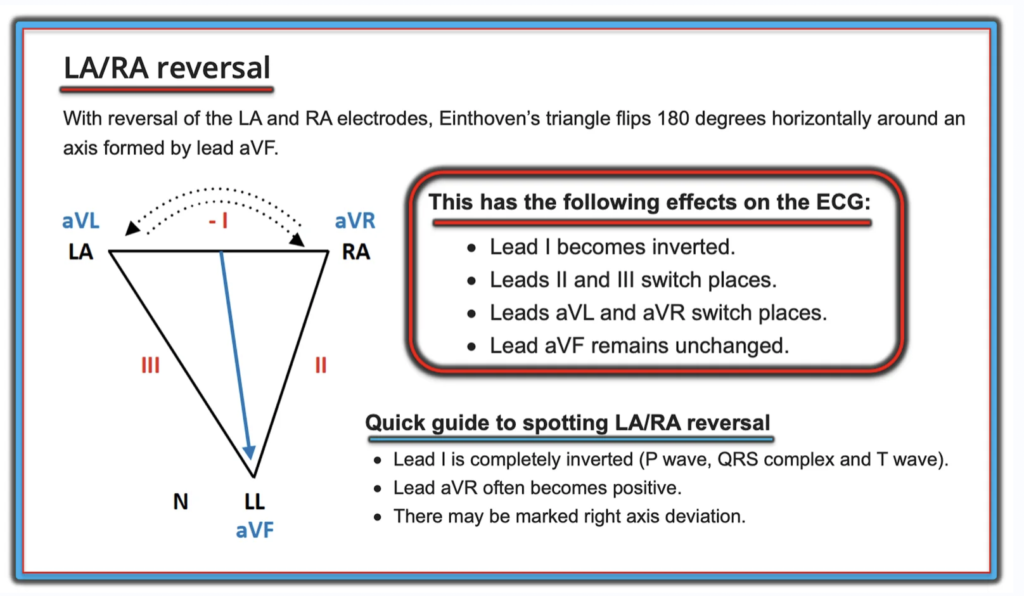
- I’ve excerpted the illustration that appears in Figure-3 from some of our LA-RA lead reversal examples to highlight the effect that this most common form of lead reversal has on the ECG.
= = =
Figure #3: The effect of LA-RA lead reversal on the ECG (Figure adapted from LITFL).
= = =
Correcting for LA-RA Lead Reversal in Figure-2:
As suggested in Figure-3 — We can “correct” for LA-RA Lead Reversal (and therefore predict what the ECG would have looked like IF limb leads had been correctly placed) by the following:
- Inverting lead I.
- Switching placement of lead II with lead III.
- Switching placement of lead aVL with aVR.
- Leaving lead aVF as it is.
= = =
KEY Point: With regard to today’s case — in order to facilitate assessment of the acute changes that occurred over the course of the 4 serial tracings that are shown in Figure-2 — I have performed the above manipulations on ECG #2 and ECG #4 in Figure-4, so as to predict what these tracings would have looked like if the LA and RA electrodes had been correctly placed.
- Take another LOOK at these 4 serial tracings in Figure-4.
= = =
Figure-4: I’ve corrected for the LA-RA reversal that was initially present in ECGs #2 and #4. How would you now interpret these 4 serial tracings?
= = =
Putting It All Together:
- After correcting for the lead reversal in ECGs #2 and #4 — Note that the R wave in lead I is now predominantly positive for all 4 tracings in Figure-4. Note also that the QRS is now predominantly negative in lead aVR for all for tracings. This proves there was LA-RA reversal earlier in Figure-2.
- Beyond-the-Core: Note in Figure-2 that despite sinus rhythm in each of the 4 tracings — the P wave in lead III was taller than the P wave in lead II in ECGs #2 and #4 ( = the 2 tracings with lead reversal) — but not in ECGs #1 and #5. And, in Figure-4 (after correction for LA-RA reversal) — the P wave in all 4 tracings is taller in lead II than in lead III, as it should be with sinus rhythm ( = further proof that there was LA-RA reversal earlier in Figure-2).
- The evolutionary changes in Figure-4 now perfectly fit Pattern #1 for Takotsubo CMP, as described in Figure-1:
- ST elevation beginning in the anterior leads of ECG #1 — with this ST elevation increasing and extending in ECG #2 to involve the first 5 chest leads — but without the usual ST elevation in lead aVL, and without the inferior lead reciprocal ST depression that so commonly accompany an extensive proximal LAD OMI.
- And then, within a short time in ECG #4 (done just 6 hours after ECG #2) — the ST elevation has almost completely resolved — now with beginning T wave inversion in most chest leads, and with complete loss of T wave positivity in the inferior leads.
- Just 12 hours later with ECG #5 — the heart rate has slowed (a wearing off of the catecholamine surge present during the early stages of Takotsubo CMP) — and ST elevation has now been completely replaced by diffuse symmetric T wave inversion that is deepest in the lateral chest leads — in association with marked prolongation of the QTc.
- Final Beyond-the-Core Point: Note the changes in P wave size in the inferior leads in Figure-4. The tall, peaked and pointed P waves in ECG #4 easily exceed the 2.5 mm criterion for RAA (Right Atrial Abnormality) — but really do not do so in the other 3 tracings. Rather than exclusively being a function of atrial “size” — an increase in atrial pressure (from LV dysfunction) may sometimes account for transient fulfillment of RAA or LAA criteria (with these RAA criteria that were present in ECG #4 resolving by the time ECG #5 was recorded).
= = =
= = =