
Written by Magnus Nossen.
The patient in today’s case is a 35-year-old overweight female. She experienced sudden onset chest pain and quickly called emergency medical services. Approximately 10 minutes later, she collapsed in the presence of witnesses. On EMS arrival, she was found to be in ventricular fibrillation. Return of spontaneous circulation was achieved after 10 minutes of resuscitation, and an ECG was obtained immediately and is shown below. What do you think?
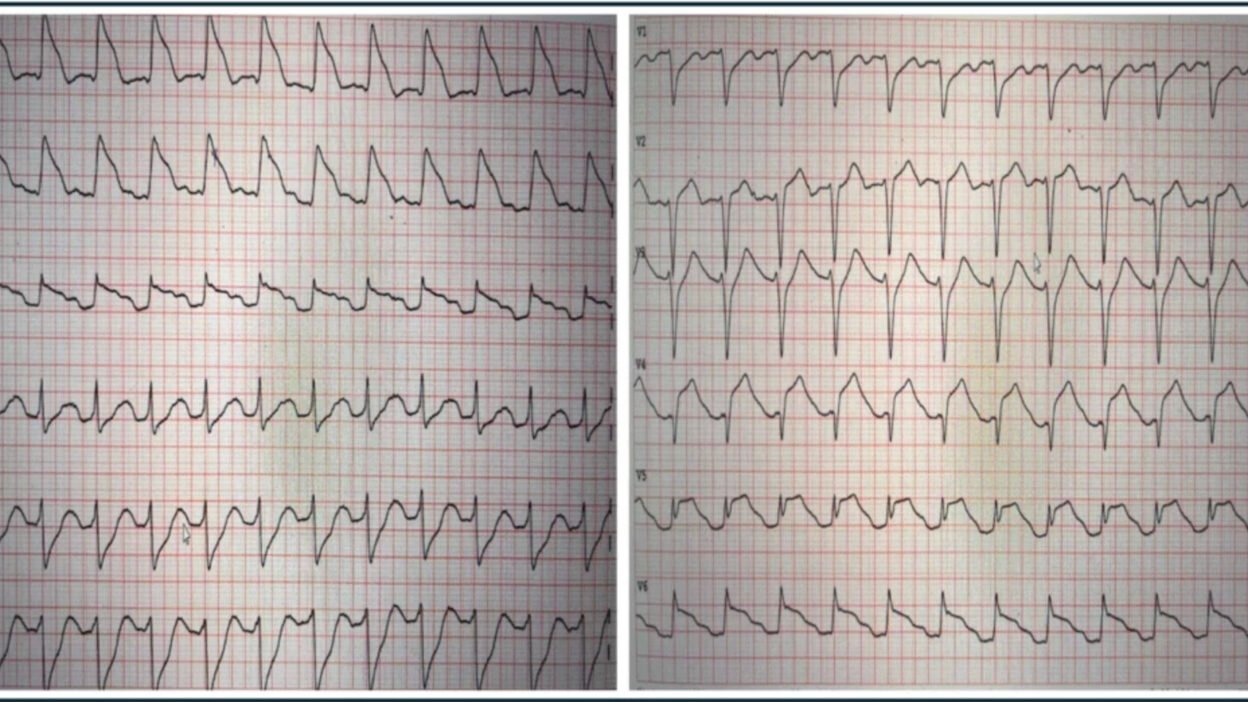
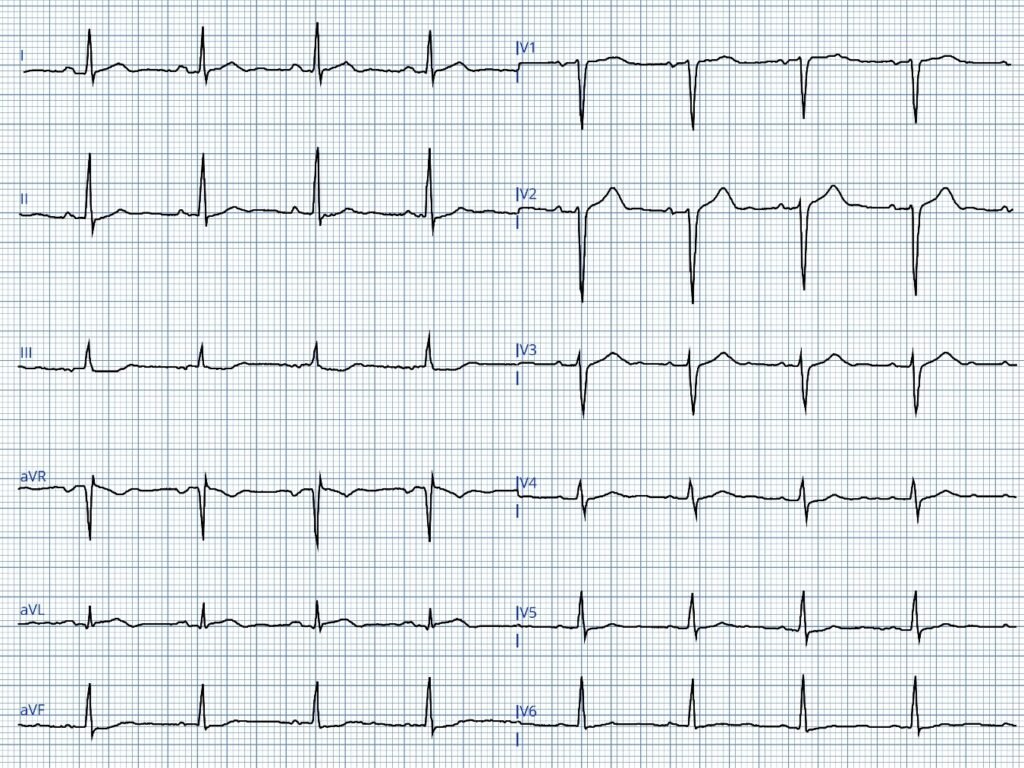
ECG #1
The ECG demonstrates a regular tachycardia at a rate of 145 bpm. There are clear sinus P waves before each QRS. Although the initial impression from the lateral leads (I, aVL, and V6) might suggest otherwise, the QRS complexes are narrow. There is ST-segment elevation in the anterolateral leads, which could be mistaken for a wide QRS complex. The inferior leads show reciprocal ST depression.
These findings are indicative of a proximal left anterior descending (LAD) artery occlusion, occurring before the first diagonal branch and resulting in anterior and lateral ST elevation. While post-ROSC ECGs should be interpreted with caution, the presence of chest pain prior to cardiac arrest and this post-ROSC ECG makes occlusion myocardial infarction (OMI) almost certainly the cause of the symptoms and ECG findings regardless of the patient’s young age. The Queen of course makes the correct diagnosis.
QoH interpretation with explainabilty map
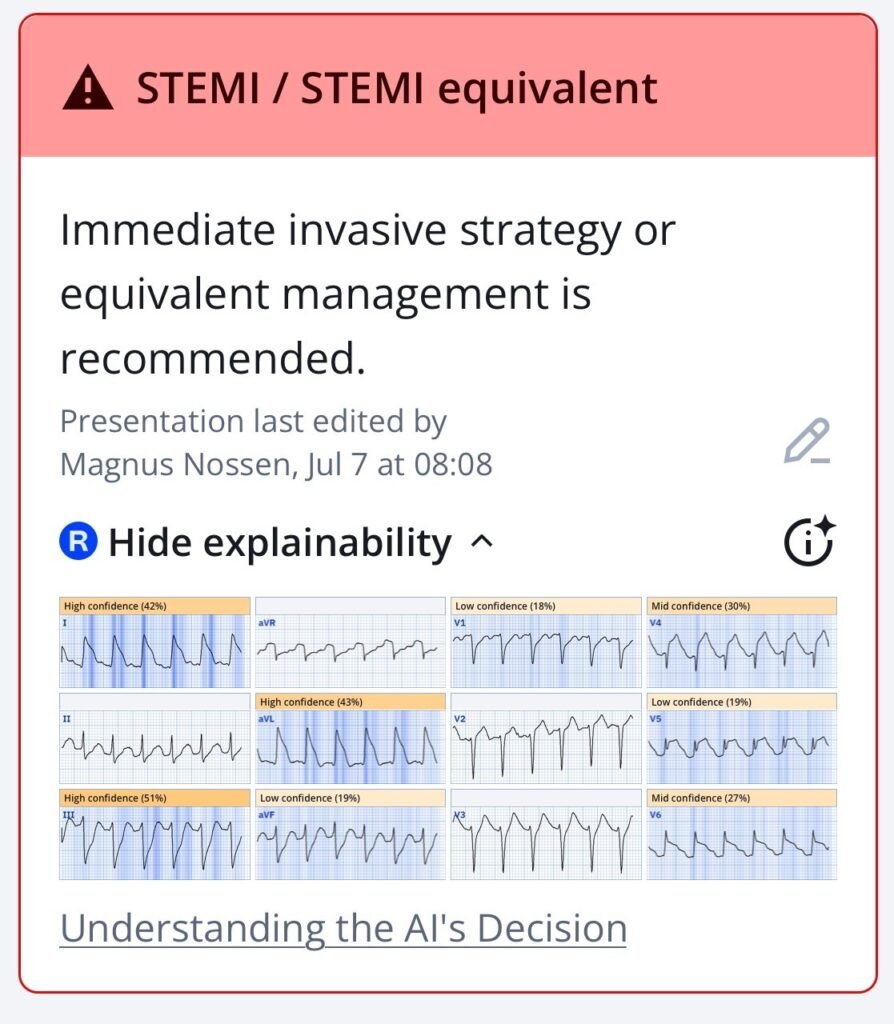
New PMcardio for Individuals App 3.0 now includes the latest Queen of Hearts model and AI explainability (blue heatmaps)! Download now for iOS or Android. https://www.powerfulmedical.com/pmcardio-individuals/
The patient was intubated following ROSC. The ECG findings were recognized by providers as OMI and the patient was accepted for emergent angiography. She remained stable during transport. In the cath lab she had another VF arrest which was quickly defibrillated. The videos below show the culprit lesion before and after stent placement.
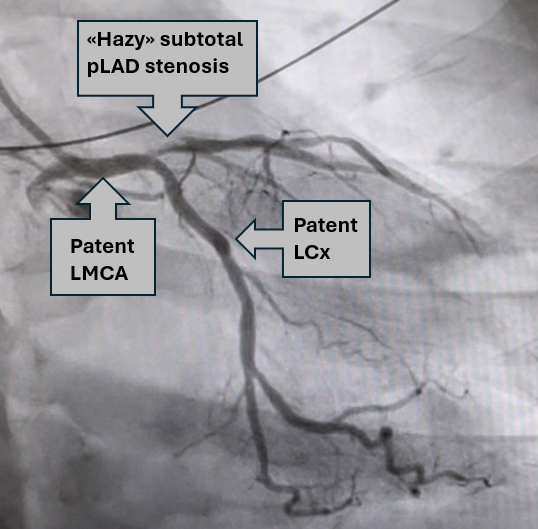
Proximal LAD subtotal stenosis
Annotated still image from the above angiography
Post PCI angiography – TIMI III
As seen in the initial angiography, there was some minimal flow in the LAD. This, combined with the relatively brief interval between symptom onset and angiography, contributed to a “modest” peak troponin T level of 2231 ng/L. Formal echocardiography identified a wall motion abnormality in the distal septum and apex, while the left ventricular ejection fraction remained normal (>50%).
An ECG recorded prior to transfer to the regional hospital (6 days after PCI) is shown below — and is quite unremarkable given the dramatic initial patient presentation.
ECG #2 recorded 6 days after PCI
ECG #2 was recorded 6 days after cardiac arrest and PCI. Except for the slight terminal T wave inversion in lead aVL, this ECG is not very different from the patient’s baseline tracing, which also showed somewhat poor R wave progression in the early precordial leads. Echocardiographically and electrocardiographically — this patient had a surprisingly good outcome compared to other patients with similar prehospital ECGs following cardiac arrest.
Discussion:
The ECG diagnosis in today’s case is not a difficult one. What I found fascinating is how quicky this patient suffered cardiac arrest! Is it not strange how some patients with OMI will remain electrically stable while others suffer cardiac arrest within minutes? It is not all due to chance.
Factors associated with increased risk of VFib in the setting of acute MI include the following:
- Large infarct territory
- Anterior wall MI
- K+ levels <3.5 mEq/L
- Young age
- No prior history of angina
- Being physically inactive
Question: How about the initial ECG?
Are we able to predict high-risk ECG patterns associated with cardiac arrest? There is some very interesting literature on this subject.
Cipriani et. al looked at STEMI patients and found that a triangular “Shark-Fin” ECG pattern was present in 5 of 367 patients (1.4%) diagnosed with STEMI. All 5 patients (100%) with Shark-Fin morphology had VFib arrest — compared to 35 out of 362 patients (9.6%) with STEMI, but without the Shark-Fin pattern.
- 4 of the 5 patients (80%) with Shark-Fin ST elevation in the Cipriani study developed cardiogenic shock (with 3/5 needing ECMO — and one managed with pressors, but who ultimately died of arrhythmic storm before PCI could be achieved).
- Need for mechanical circulatory support occurred in only 12 of 362 patients (3.8%) with standard STEMI presentations.
- Of note — the prevalence of triangular QRST waveform (Shark-Fin morphology) was 10% (5/50) in patients who presented within one hour of symptom onset — vs 0% (0/317) of those patients presenting later than 60 minutes from symptom onset, thereby suggesting that Shark-Fin morphology confers a highly unstable myocardium.
Schreiber, A. et. al similarly looked at the ECG of 417 STEMI activation cases and identified Shark-Fin morphology in 8 patients, representing 1.9% of the cohort. In this single-center retrospective study by Schreiber et al — 7 of the 8 patients with Shark-Fin morphology developed cardiogenic shock that required inotropic support and/or mechanical circulatory assistance. Ultimately, only 2 of these 8 patients survived to hospital discharge.
=============================
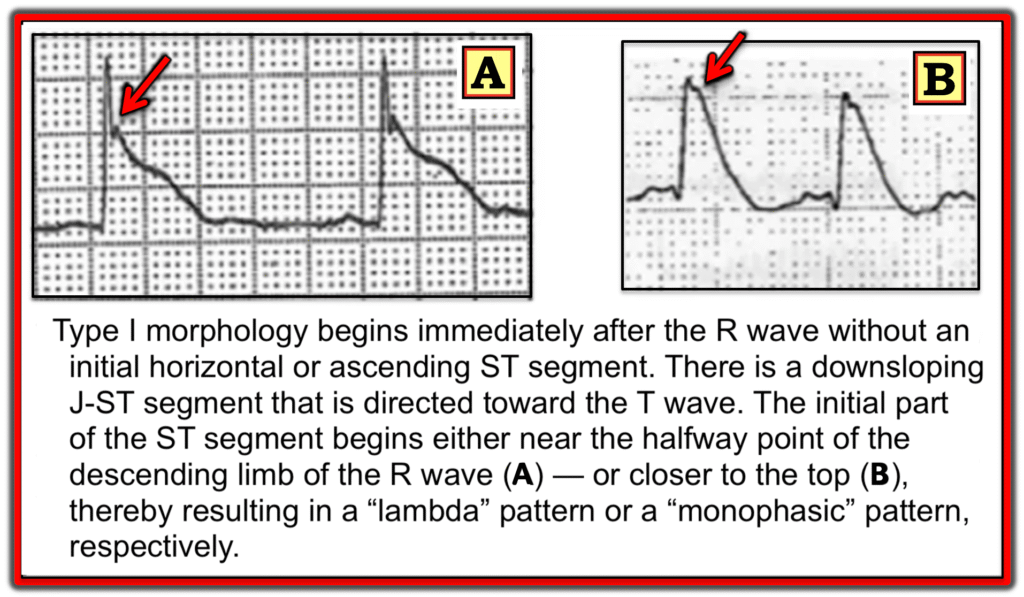
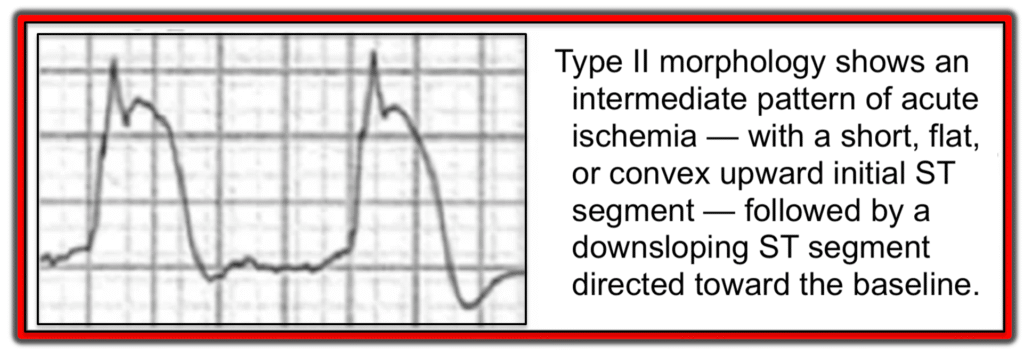
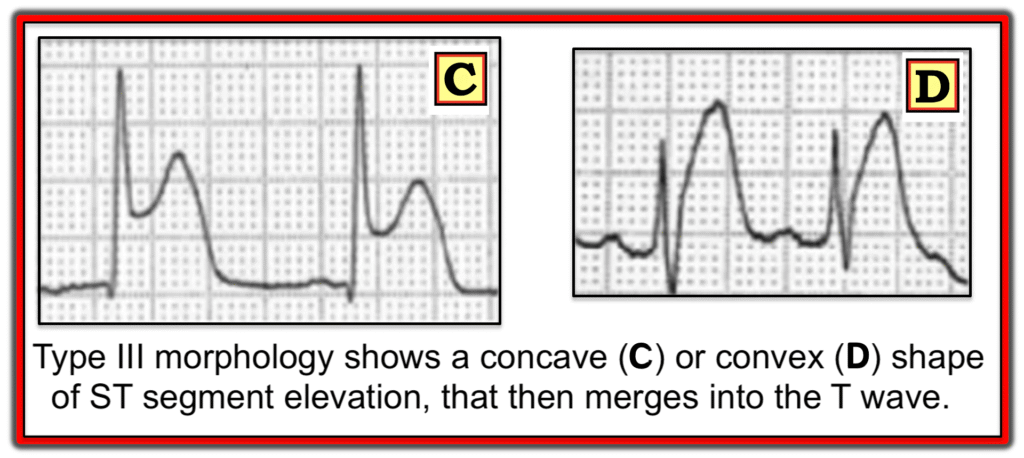
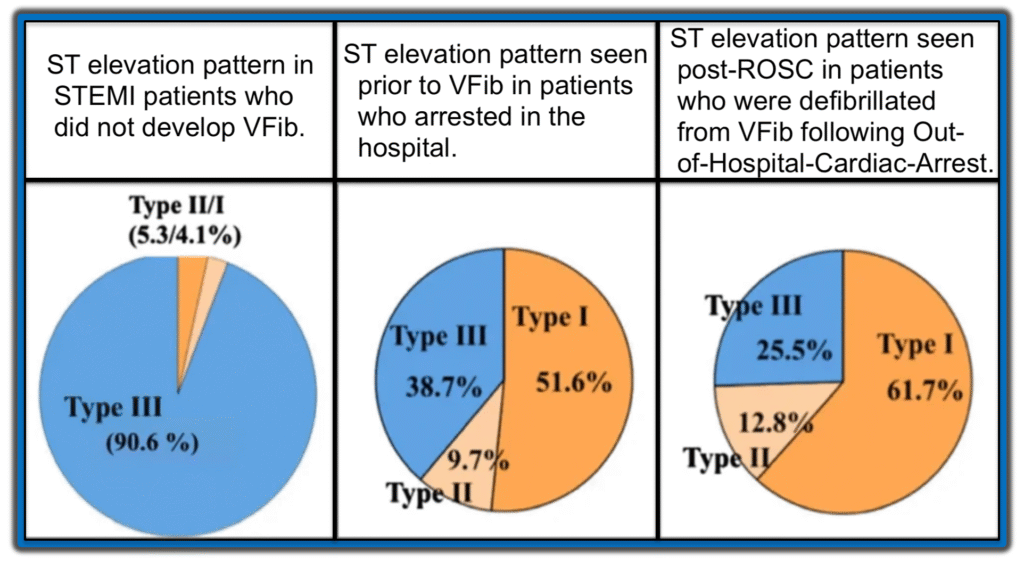
Aizawa et. al. looked at the ECG of 94 ACS patients who experienced VF prior to PCI. Study investigators subdivided the ST-segment elevation into three distinct patterns (Type I, Type II and Type III) as shown in the following three images.
Type I ST-segment elevation
Type II ST-segment elevation
Type III ST-segment elevation
Conclusions from the 2012 Aizawa et al Study:
- The Type I ST-segment elevation pattern described by Aizawa et al — demonstrates a strong correlation with cardiac arrest due to VFib, being observed in over 50% of patients who experienced VFib arrest, despite its presence in fewer than 2% of STEMI/OMI cases.
- In contrast, the Type III pattern (which is the most common form seen in STEMI/OMI) — was found in >90% of patients who did not develop VF arrest.
The chart below graphically displays these results from the 2012 Aizawa study — in which ST segment morphology is correlated to the occurrence rate of VFib arrest.
=============================
Applying this Data to Today’s Case:
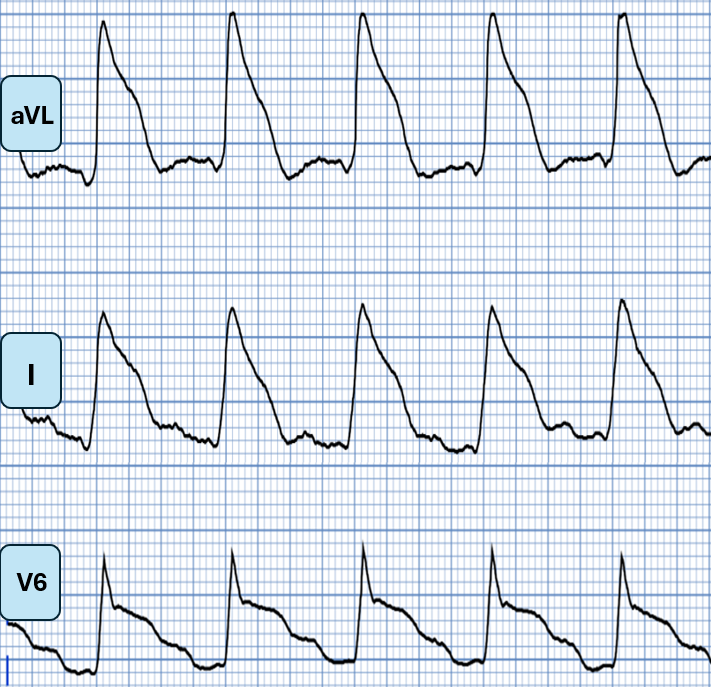
The patient in today’s case experienced cardiac arrest very soon after she developed chest pain. Although this could be incidental — the pattern of ST segment elevation seen in the lateral leads of ECG #1 fits well with what the above literature suggests is a high-risk pattern, with a downsloping ST segment from the J-point, that then merges with the T wave (similar to Panel B in the above Type I ST elevation morphology pattern by Aizawa).
Lateral leads from ECG #1 of today’s patient
J Waves as a Risk Factor:
NOTE: J waves are an extremely common finding. When incidentally seen in an asymptomatic individual with a benign repolarization pattern and a negative personal and family history — they are generally not of clinical significance. However, under certain circumstances — the presence of J waves can be a marker of arrhythmic risk.
- In Brugada syndrome (especially with the Type I Brugada pattern) — prominent J waves give the impression of ST elevation in leads V1-to-V3. These J waves merge into a downsloping ST segment, and are highly associated with VFib.
- J waves are also associated with increased risk of VFib arrest in severe hypothermia.
- Acute ischemia may cause or exaggerate J waves — and in this setting, their presence may serve as a risk factor for VFib.
- Fumimoto et. al. found that for patients with vasospastic angina, the presence of inferior lead J waves has an odds ratio of 11,85 for the occurence of VFib. This blog case provides an example of such inferior J waves and ventricular arrhythmia in the setting of vasospastic angina!
COMMENT: The ECG diagnosis in today’s case is not a difficult one. What is remarkable however is how quickly this patient with Shark-Fin ST segment morphology (ST elevation and depression) went into VFib arrest. This ECG pattern is extremely concerning and has been associated with VFib arrest and/or hemodynamic collapse in numerous blog posts in Dr. Smith’s ECG Blog.
- Start with this 2018 post, “Shark Fin: A Deadly ECG Sign that you Must Know!“
- See this case of a patient who had VF arrest secondary to coronary artery spasm. The ventricular arrhythmia occured within minutes of Shark-Fin ST-T wave changes.
- Also — this fascinating case by Dr. Meyers describing VFib arrest with Shark-Fin morphology on ECG, associated with cardiogenic shock in LMCA occlusion.
- Another example in This case of Shark-Fin morphology in a patient with AVNRT, PMVT, VFib and cardiogenic shock.
CASE Follow-Up: The patient in todays’s case was treated for aspiration pneumonia and was extubated a few days following her cardiac arrest. She did well in the short term. Long term follow-up is not available.
=============================
See here for more shark fin cases or look-alikes.
Learning points:
- Young people have MI. Time until revascularization remains the most important prognostic factor for ACS patients with OMI.
- Some ST-segment elevation patterns are more malignant with regard to an increased risk of cardiac arrest.
- ST-segment morphology may predict increased risk of cardiac arrest from VFib (especially with a downsloping ST segment pattern).
- Shark-Fin ST-elevation is associated with electrical instability, and is associated with a high risk of cardiogenic shock needing vasopressors and/or mechanical circulatory support.
- J waves that occur in the setting of acute ischemia are an important risk factor for VFib arrest.
References
- Cipriani, A. et al. (2017). The electrocardiographic “triangular QRS-ST-T waveform” pattern in patients with ST-segment elevation myocardial infarction: Incidence, pathophysiology and clinical implications. Journal of Electrocardiology, 51(1), 8–14. https://doi.org/10.1016/j.jelectrocard.2017.08.023
- Schreiber, A. et. al.(2022). A single-center retrospective study on the incidence and clinical significance of the electrocardiographic “Triangular QRS-ST-T Waveform” pattern**. Heart & Lung, 56, 86–90. https://doi.org/10.1016/j.hrtlng.2022.06.018
- Aizawa, Y. et al (2012). Characteristics of electrocardiographic repolarization in acute myocardial infarction complicated by ventricular fibrillation. Journal of Electrocardiology, 45(3), 252–259. https://doi.org/10.1016/j.jelectrocard.2011.11.007
- Zhang, L. et. al. (2021). Relationship between an ischaemic J wave pattern and ventricular fibrillation in ST-Elevation myocardial infarction patients. International Journal of General Medicine, Volume 14, 8725–8735. https://doi.org/10.2147/ijgm.s337638
- Fumimoto, T. et. al. (2017). Inferior J waves in patients with vasospastic angina might be a risk factor for ventricular fibrillation. Journal of Cardiology, 70(3), 271–277. https://doi.org/10.1016/j.jjcc.2016.12.003
====================
======================================
MY Comment, by KEN GRAUER, MD (8/8/2025):
The patient in today’s case experienced primary VFib (Ventricular Fibrillation) within minutes of the onset of her symptoms of chest pain. As opposed to secondary VFib (that typically arises days after an infarct as a result of heart failure or cardiogenic shock) — primary VFib is an electrical phenomenon that results from acute ischemia, and usually develops within hours of the onset of infarction.
- Although the incidence of primary VFib has been estimated to be between 3-12% (Glinge et al — J Geriatr Cardiol 13(9):789-797, 2016) — the true incidence is difficult to come by, because many patients die before help (and a defibrillator) can arrive.
- Today’s patient is lucky that she immediately contacted EMS — or else she would not have survived.
- Today’s patient experienced a second VFib episode after she reached the hospital — again lucky that she was in the cath lab where capable staff were able to promptly defibrillate her.
Dr. Nossen asks the question Why this patient developed VFib not once, but twice during the early hours of her care? In his discussion he explores ECG and clinical factors that help to predict which patients with acute infarction are at highest risk of developing primary VFib during the critical early hours of infarction.
- In addition to the obvious predisposing feature of a larger size infarction — features such as ischemic J waves, Brugada phenocopy patterns, and the ST elevation morphology patterns described above by Dr. Nossen help us to anticipate which of our patients with acute ischemia are at greatest risk of developing VFib under our care.
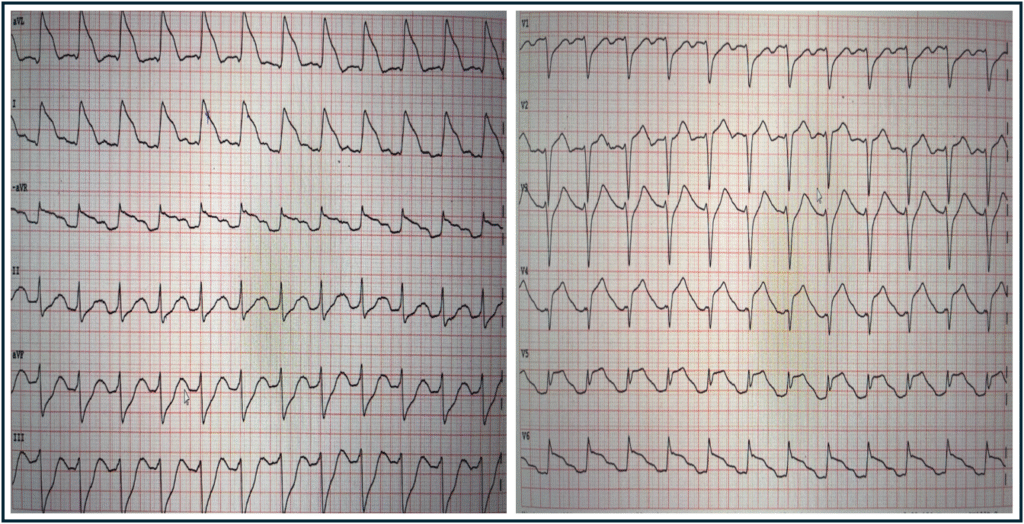
- That today’s patient was at high risk of experiencing a 2nd VFib episode — was evident from her post-ROSC ECG that I’ve reproduced below in Figure-1.
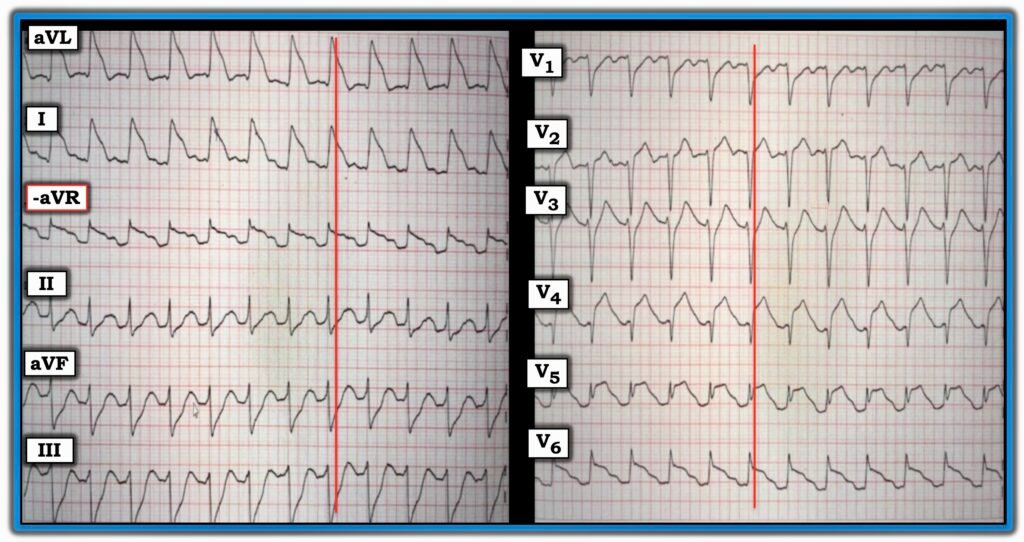
Figure-1: I’ve reproduced the post-ROSC ECG in today’s case.
Review of the Post-ROSC ECG:
As per Dr. Nossen — the ECG in Figure-1 shows sinus tachycardia at ~145/minute, and is diagnostic of acute proximal LAD occlusion. Some additional points of note include the following:
- Uncomplicated acute MIs usually do not result in sinus tachycardia. The presence of the marked increased heart in today’s case highlights the severity of infarction and the risk of heart failure and/or cardiac arrest.
- The ECG in Figure-1 displays the logic of the Cabrera format, in that placement of the 6 limb leads is sequential with 30 degrees of spacing between leads. This facilitates appreciation of the gradual reduction in the amount of ST elevation (from lead aVL — to lead I — to lead -aVR), which is then followed by a sequential gradual increase in the amount of reciprocal ST depression (from lead II — to lead aVF — to lead III).
- Lead V5 displays T-QRS-D (Terminal QRS Distortion). Although obviously not needed to diagnose acute infarction in today’s case — it’s good to hone your skill in recognizing this helpful ECG feature (See My Comment in the November 14, 2019 post of Dr. Smith’s ECG Blog). NOTE: Although recognition of T-QRS-D is best made when this sign is seen in leads V2,V3 and/or V4 — the lack of an S wave reaching the baseline in lead V5 is so pronounced that I assessed this sign as positive in Figure-1.
- Extensive loss of anterior forces is already evident in Figure-1 — in that there is a deep QS wave in lead V4. This provides insight that large infarction Q waves can sometimes develop in less than 1 hour!
- It’s easy to get fooled by Shark-Fin ST-T wave patterns — as per Dr. Nossen’s case in the September 27, 2023 post — in which the initial 12-lead tracing looked like VT with marked QRS widening, when in reality Shark-Fin ST elevation was a mimic for the QRS widening that simulated VT.
- In Figure-1 — I’ve drawn in vertical RED lines where the QRS ends. Distinguishing the end limit of the QRS complex is almost impossible in leads aVL and I of today’s tracing. Fortunately we can turn to the chest leads to assist in determining true QRS width.
- Finally — the ST elevation morphology in lateral leads I, aVL and V6 simulates the high-risk Type I ST segment morphology for developing VFib (leads I and aVL resembling Panel B — and lead V6 resembling Panel A). Given the extensive ST segment deviation (ediffuse ST elevation and depression indicative of a very large infarction) and this high-risk ST segment morphology pattern — the 2nd episode of VFib in today’s patient came as no surprise.


