===================================
MY Comment by KEN GRAUER, MD (5/22/2020):
===================================
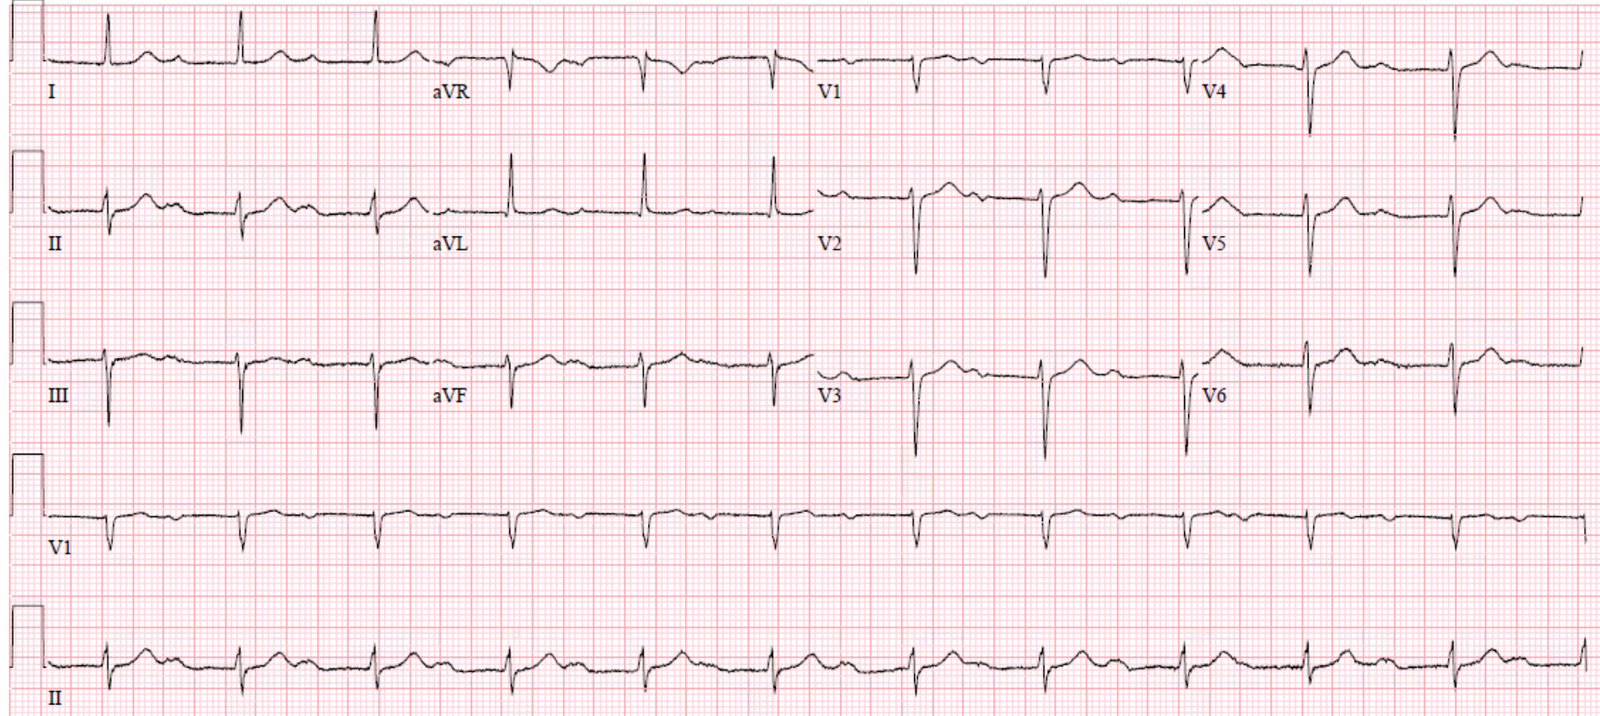
The ECG in Figure-1 was obtained from a 50-ish year-old man, who was found by the EMS team to be in a wide tachycardia. The patient was treated on the scene with medication. ECG #1 shows the results of such treatment.
- Is this patient now in sinus tachycardia (RED arrow)?
| Figure-1: The 12-lead ECG and long lead II rhythm strip obtained after medication converted a wide tachycardia (See text). |
My THOUGHTS on ECG #1: It is tempting to accept the RED arrow in Figure-1 as highlighting an upright sinus P wave in lead II.
- The “good news” — is that this patient had been in a wide tachycardia prior to administration of medical treatment. The QRS complex in ECG #1 is now narrow — so the patient is in a regular SVT ( = SupraVentricular Tachycardia) rhythm at a rate of ~115/minute.
QUESTION: Is there extra atrial activity in Figure-1?
- HINT: Using calipers makes it much easier to answer this question!
ANSWER: Although tempting to accept the RED arrow in Figure-1 as pointing to a sinus P wave — several factors should make you skeptical of this conclusion:
- IF the rhythm in Figure-1 was sinus tachycardia — the ventricular rate of ~115/minute is fairly fast …
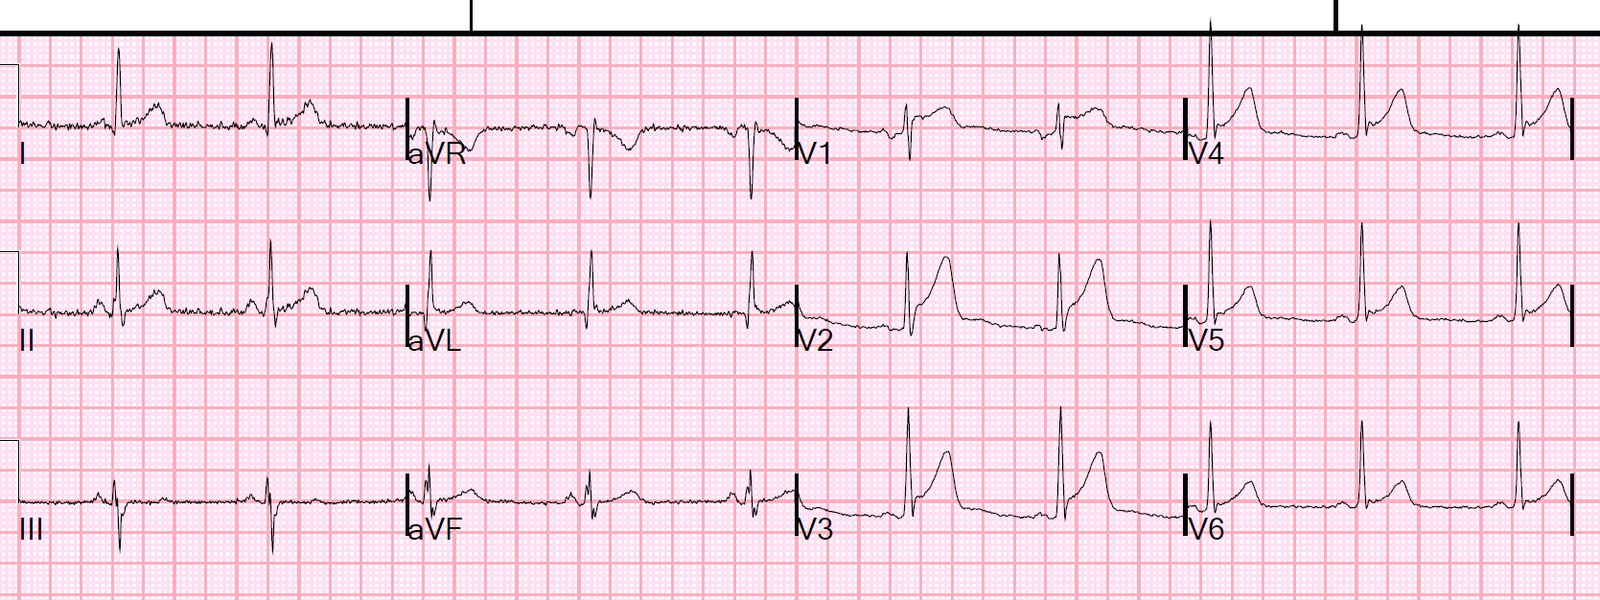
- Several leads seem to manifest an “extra notching” in the early part of the T wave (slanted RED lines in Figure-2).
- Stepping back a bit from the tracing — the image of “sawtooth” activity (reminiscent of AFlutter) can be imagined (BLUE sawtooth in the long lead II of Figure-2).
 |
| Figure-2: Slanted RED lines — as well as suggestion of a BLUE “sawtooth” pattern have been added to Figure-1 (See text). |
NOTE: We have previously worked through the diagnostic approach to the regular SVT rhythm (See the November 12, 2019 post in Dr. Smith’s ECG Blog). Today’s case is insightful — because of how easy it is to be fooled into thinking that the RED arrow we saw in Figure-1 is pointing to an upright sinus P wave in lead II.
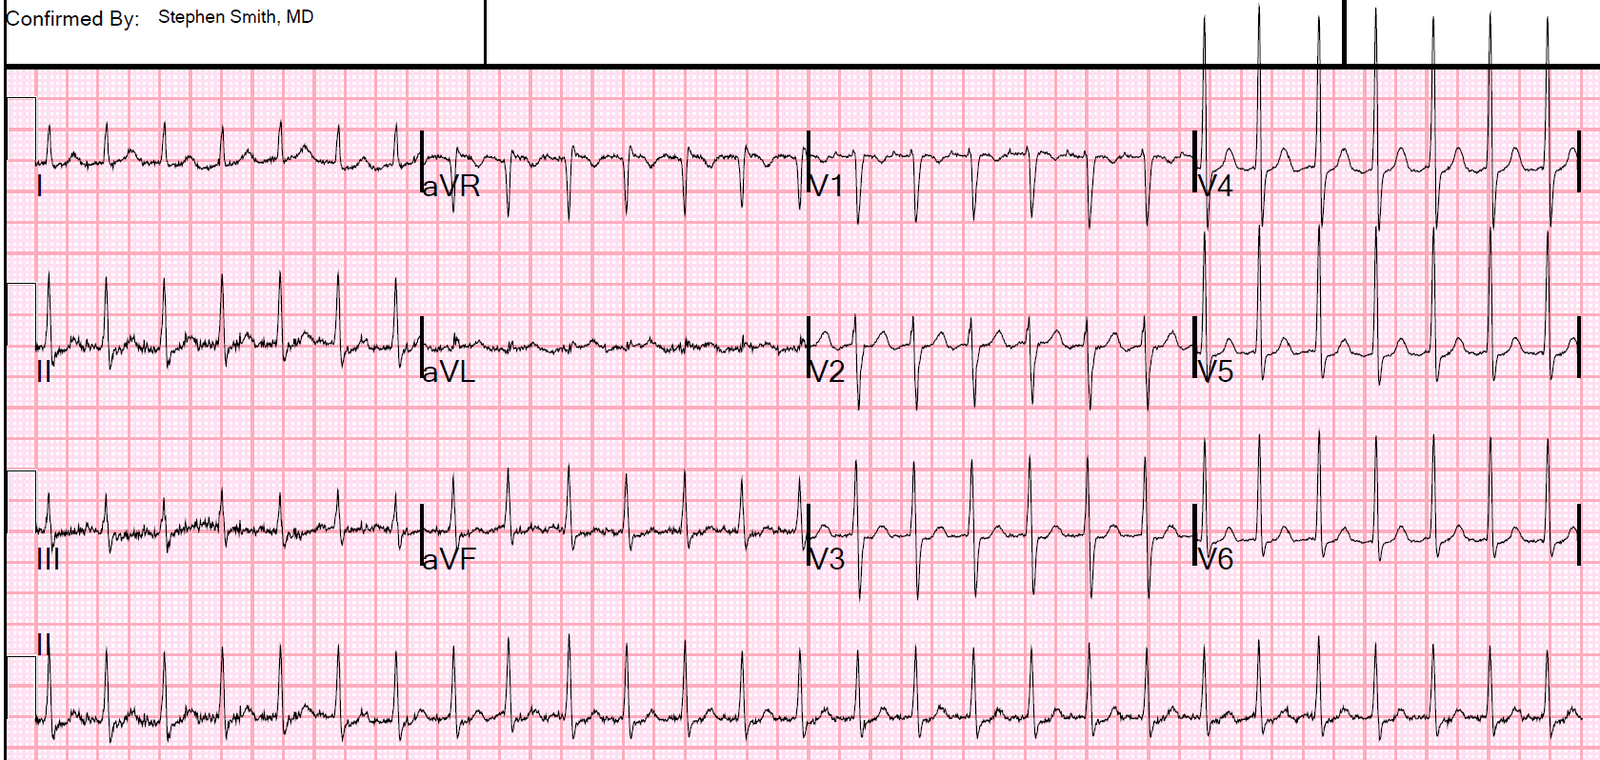
- The BEST way to prove what the rhythm diagnosis is in Figure-2 — is to carefully set your calipers to precisely HALF the R-R interval of the regular SVT rhythm.
- Doing so allows you to perfectly walk out 2:1 atrial activity in numerous leads (slanted RED and PINK lines in Figure-3). Since these slanted lines suggest there are 2 atrial deflections for each QRS complex — and since we calculated the ventricular rate in Figure-1 to be 115/minute — this means that the atrial rate must be 115 X 2 = 230/minute.
- As we emphasized in the November 12, 2019 post — the atrial rate for untreated AFlutter in adults is almost always close to ~300/minute (ie, 250-350/minute range) — which, with 2:1 AV conduction means that the ventricular rate of untreated AFlutter will most often be close to 300/2 ~150/minute. BUT we were told at the beginning of today’s case that the patient has been treated with antiarrhythmic medication. As a result — an atrial rate of ~230/minute would not be too slow for 2:1 AFlutter (since antiarrhythmic medication may slow the rate of flutter).
- Finally — I fully acknowledge that it is impossible to rule out ATach (Atrial Tachycardia) with 2:1 block as the rhythm diagnosis in Figure-3. That said — I feel the suggestion of “sawtooth” activity (BLUE lines in Figure-2) make AFlutter a much more likely diagnosis than ATach with 2:1 block!
 |
| Figure-3: Slanted RED and PINK lines highlight 2:1 atrial activity in numerous leads (See text). |
=====================
— My sincere appreciation to Edward Brunacci (of Sydney, Australia) for contributing this case.
=====================
![]()