A man in his 60s experienced acute chest pain and called EMS.
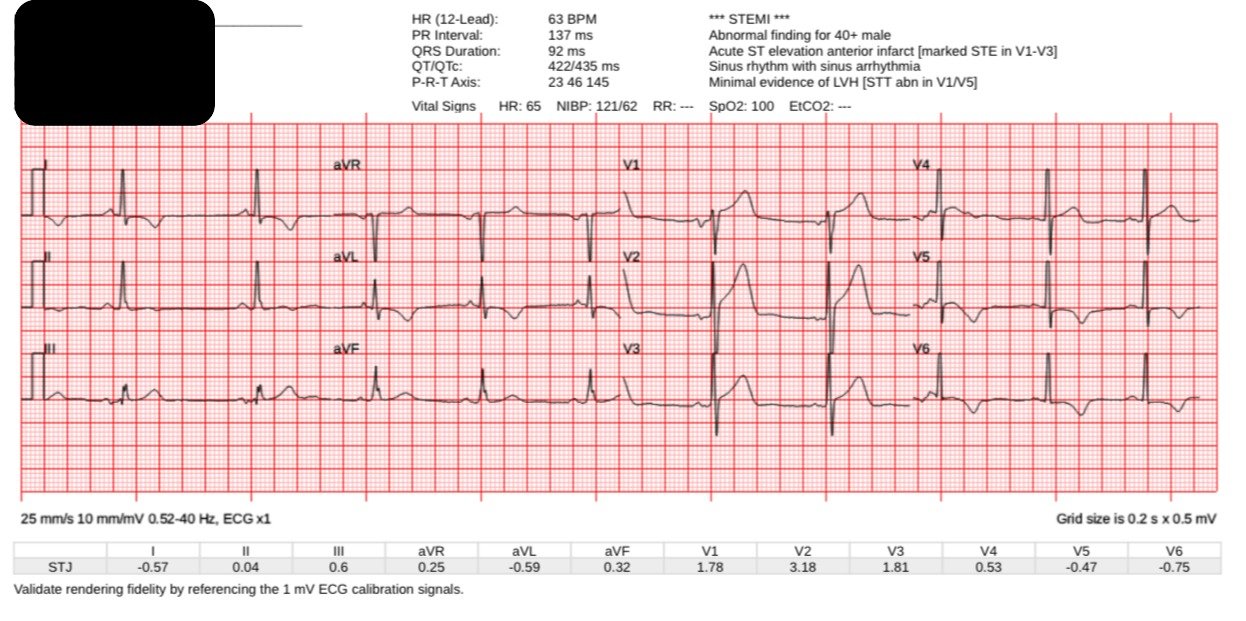
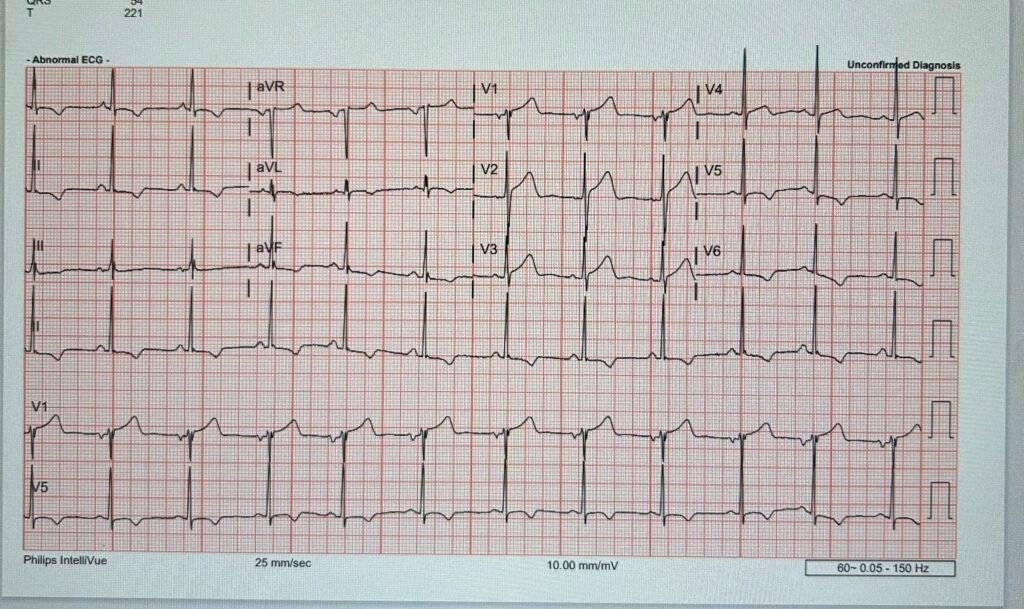
EMS arrived and recorded this ECG during 10/10 chest pain:
What do you think?
The EMS viewing system unfortunately truncates/clips the voltage at + or – 10mm from the baseline. This limits the view of the QRS complex in many leads. The question is whether there is anterior wall acute coronary occlusion MI, or not. The T waves are broad and seem to have large area for their QRS complexes. Is there reciprocal STD/TWI in V5-6? Is this precordial swirl sign?
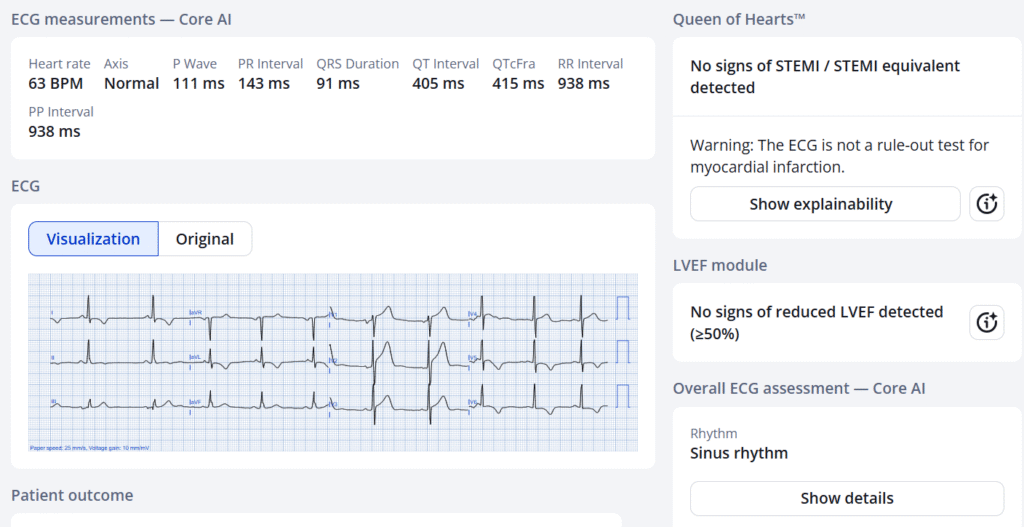
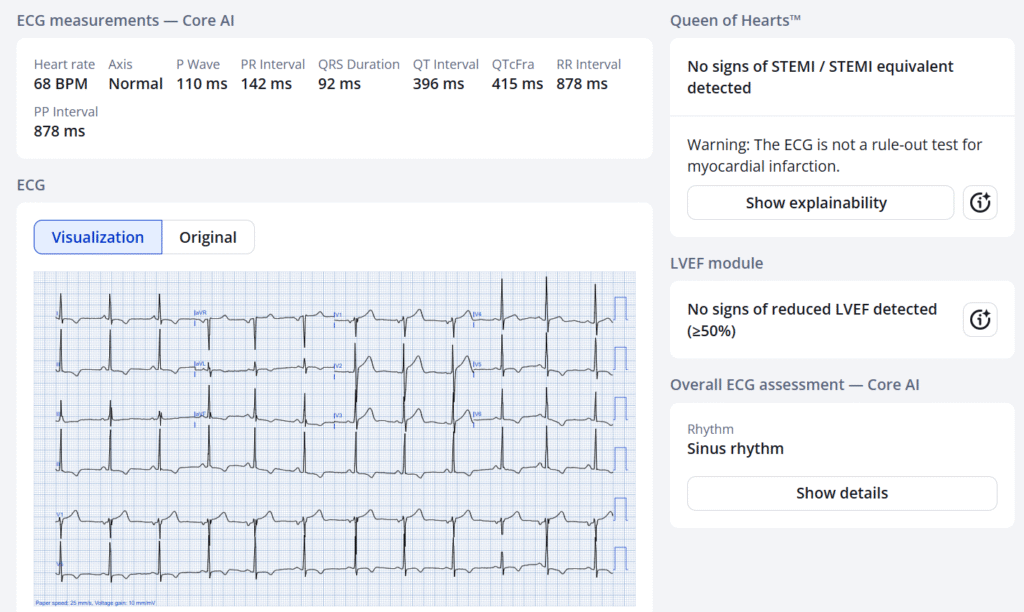
Queen of Hearts sees no signs of OMI:
New PMcardio for Individuals App 3.0 now includes the latest Queen of Hearts model and AI explainability (blue heatmaps)! Download now for iOS or Android. https://www.powerfulmedical.com/pmcardio-individuals/ (Drs. Smith and Meyers trained the AI Model and are shareholders in Powerful Medical).
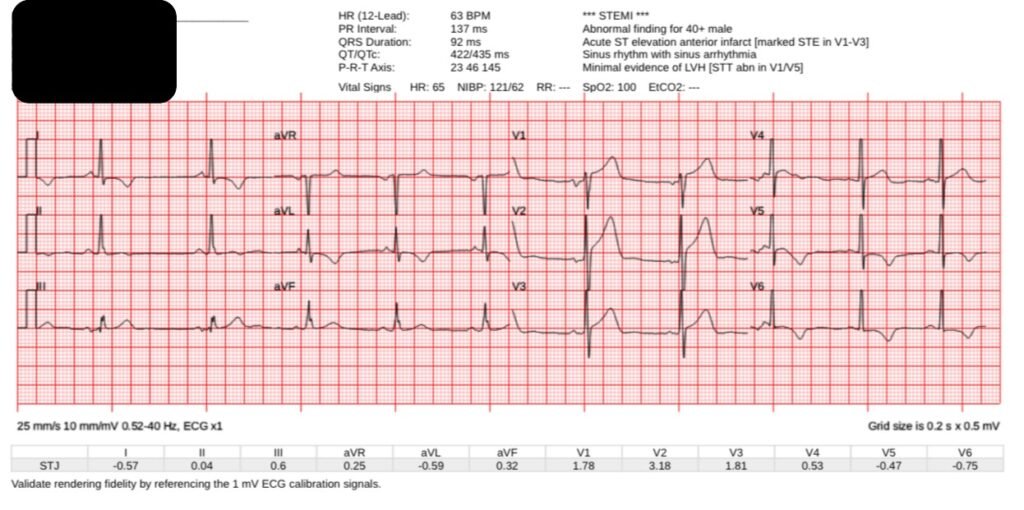
Here is the ECG on arrival to the ED, with ongoing pain:
Now there is no voltage restriction, and it is easier for me to see the significant LVH. But whether V1-V2 is hyperacute, that is still a good question.
Please note that LVH and subendocardial ischemia are the two most common mimics of our precordial swirl pattern. In our best rule in the publication, the rule we recommend using, LVH is an exclusion criteria (mimicker) of precordial swirl pattern. That doesn’t mean its impossible for a patient with LVH to develop anterior OMI causing STE and HATW in V1-V2, with reciprocal STD/TWI in V5-6, it is just meant as a caution when trying to learn the precordial swirl sign.
Queen of Hearts again is negative:
His ECG was deemed worrisome for STEMI.
The cath lab was activated, and EM and Cardiology agreed. But the cath showed no significant CAD, and the troponins were normal.
It was a false positive STEMI activation due to LVH. The Queen of Hearts was correct in this case (true negative).
We will be presenting at TCT data from 3 large volume PCI centers which shows a decrease in false positive activations from 41% to 8% by using the PMCardio Queen of Hearts AI Model.
======================================
MY Comment, by KEN GRAUER, MD (8/18/2025):
Today’s case raises the question of proportionality = How to assess the ECG of a patient with CP (Chest Pain) and LVH?
We’ve addressed this issue a number of times before:
- As per Dr. Meyers — our assessment becomes especially problematic with EMS ECGs, in which QRS amplitude is often automatically truncated once R wave or S wave amplitude exceeds 10 mm from the baseline (For Review of LVH and LV “strain” criteria — as well as review of a case with automatic truncation — CLICK HERE).
= = =
Application to Today’s CASE:
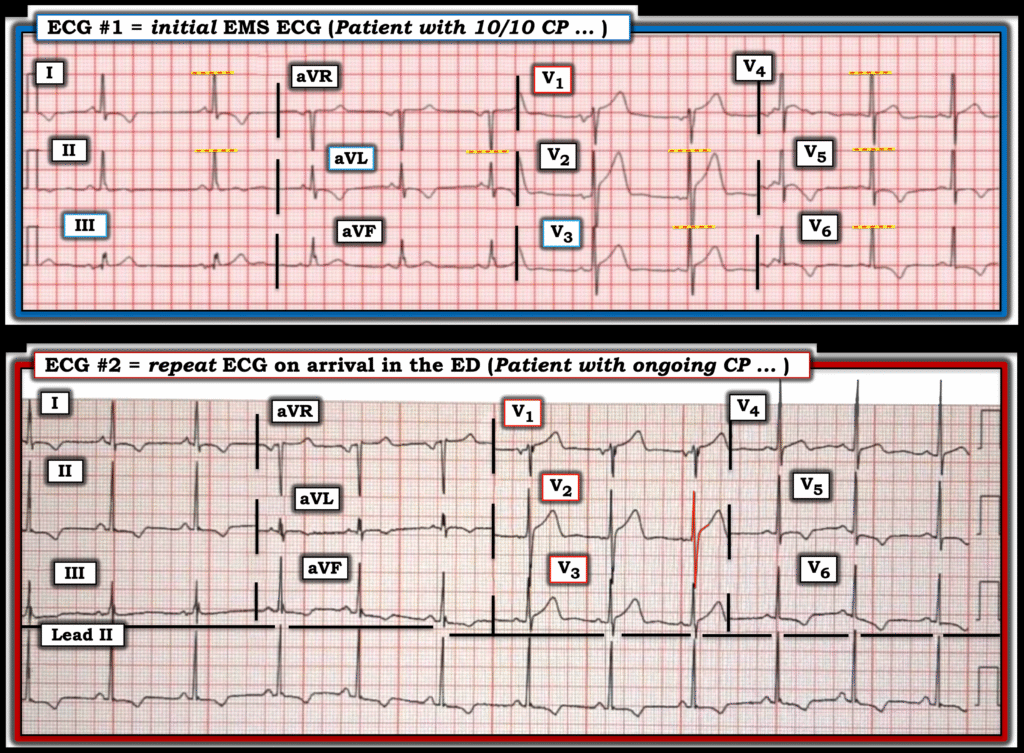
Even knowing “the Answer” to today’s case (ie, that cardiac cath showed no significant coronary disease and Troponins were normal) — I thought it worthwhile to Take Another LOOK at today’s 2 ECGs. To facilitate comparison — I’ve put these 2 tracings together in Figure-1.
- Looking first at the pre-hospital EMS ECG — RED-YELLOW lines highlight the multiple leads in which QRS voltage has been cut off.
- To Emphasize: This patient called EMS for 10/10 CP (Chest Pain)!
- Although both the R wave and S wave are cut off in lead V2 of ECG #1 — S waves in both lead V1 and lead V3 are not cut off. In the absence of automatic truncation of S waves in leads V1 and V3 — I thought the ST-T waves in these 2 leads were disproportionately “hypervoluminous” (ie, with T waves “fatter”-at-their-peak and wider-at-their-base than expected given modest S wave amplitude in these leads).
- I suspected the same for the ST-T wave in lead V2 which boasts the largest ST-T wave on this tracing — but automatic truncation of both R wave and S wave amplitudes in this lead rendered precise assessment problematic.
- However — Lead aVL does not manifest any amplitude truncation, yet the ST segment in this lead is coved, and there is disproportionately deep T wave inversion inversion.
- Lead III manifests a tiny R wave. In this context — the positive T wave in this lead is disproportionately large (as well as manifesting the mirror-image opposite ST-T wave picture as seen for the T wave inversion in lead aVL).
- Other lateral leads in ECG #1 (leads I,V4,5,6) all manifest truncated R waves due to LVH — albeit the ST segment coving and symmetric T wave inversion is not the typical asymmetric, slowly downsloping shape more typical of LV “strain”.
- BOTTOM Line: Automatic truncation in this EMS ECG from this patient with LVH clearly complicates assessment — but given 10/10 CP, I suspected superimposed hyperacute ST-T waves.
= = =
The Repeat ECG on Arrival in the ED:
As per Dr. Meyers — there is no longer voltage restriction on the repeat ECG obtained on arrival in the ED ( = ECG #2 in Figure-1).
- Although QRS voltage is increased in ECG #2 compared to ECG #1 — I thought that ST-T waves in multiple leads in this repeat ED ECG (in this patient with ongoing CP) — still appear to be disproportionately enlarged (ie, hyperacute).
- Despite the interpretation by QOH of ECG #2 as negative for OMI — this is a case for which I agree with the decision for cardiac cath in order to obtain a definitive answer for this patient with ongoing CP.
Final Thoughts: Sometimes the cath will be negative for coronary disease. This does not necessarily mean that cardiac cath was not indicated.
- With regard to today’s case, even though cardiac cath was negative for significant coronary disease — We still need to find out Why this patient had 10/10 CP.
- Although there is no acute OMI — today’s ECGs are not normal.
- I wonder whether the abnormal ST-T wave morphology seen in today’s abnormal ECGs (that really manifest no more than modest ECG voltage) — might represent some form of HCM (Hypertrophic CardioMyopathy).
- Over 2/3 of patients with HCM report CP (primarily on exertion) — as well as extremely frequent complaints of other symptoms including dizziness, fatigue, shortness of breath and palpitations (Zaiser et al — J Patient Rep Outcomes 1(4):102, 2020). An Echo is needed.
- =
- For more on ECG findings with HCM — See My Comment in the December 26, 2023 post. For review of LVH criteria — CLICK HERE.
= = =
Figure-1: Comparison of the 2 ECGs in today’s case.