Written by Pendell Meyers
A man in his 70s presented to the ED complaining of various symptoms including chest pain and shortness of breath. He had a very hard time explaining his symptoms, and it was very hard to obtain an accurate history. It was unclear to us how long the patient had been experiencing symptoms, but I feel confident that he was actively having symptoms at the time of my evaluation. He did seem to admit to using cocaine, possibly yesterday evening, but unclear. His vitals were within normal limits except mild tachycardia.
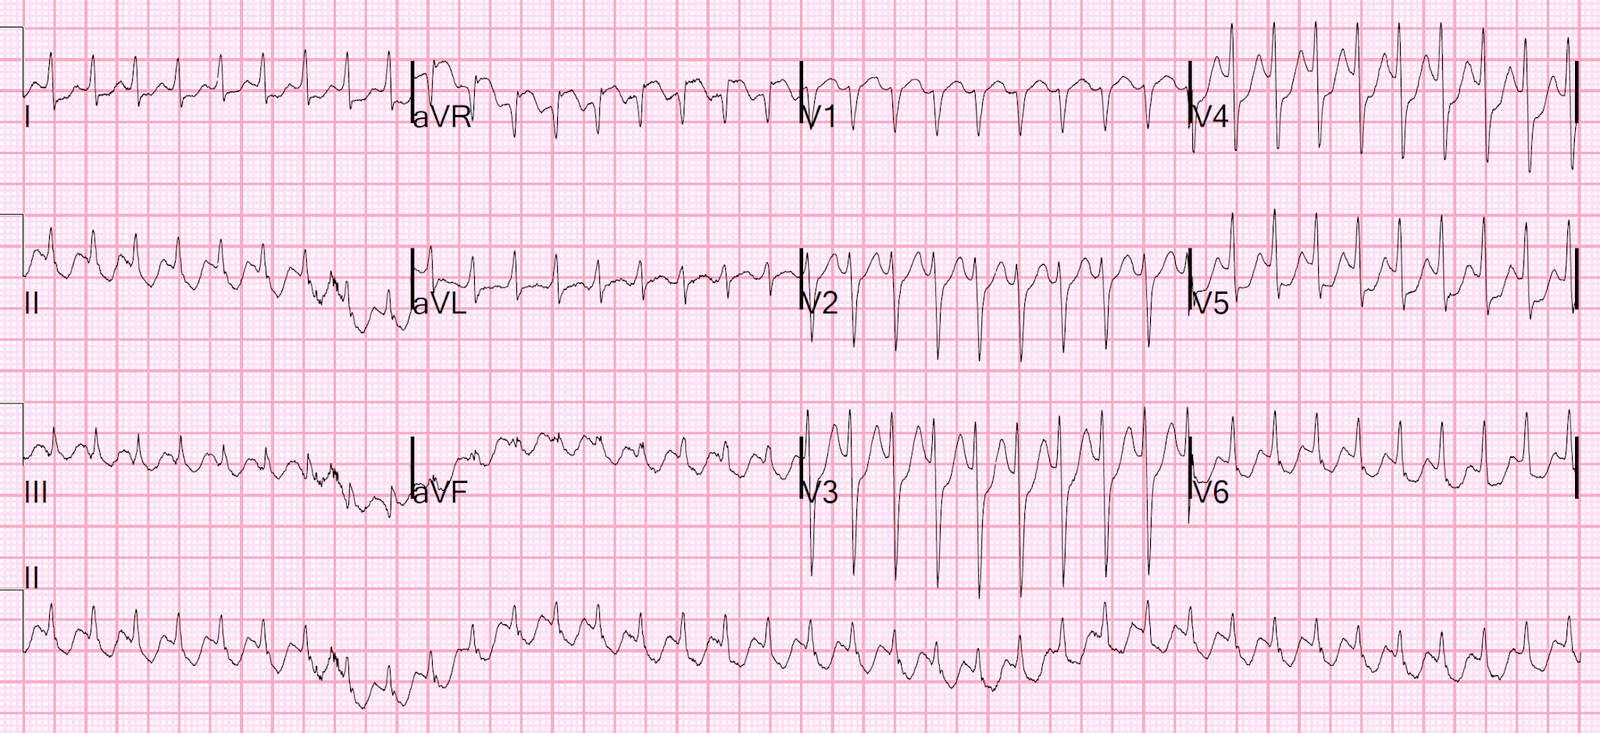
Here was his triage ECG:
 |
| What do you think? |
I texted it to Dr. Smith with no information and he said “Very weird. I have seen a patient with Brugada who also had acute LAD occlusion. That is what this looks like!”
Needless to say, it is alarming. There is sinus tachycardia with a narrow QRS complex that has poor R wave progression and some minimal right axis deviation. There is striking, huge STE in the anterior and lateral leads. But is also has a prominent J wave and saddleback morphology, also with elements of brugada pattern. I do not see any signs of hyperkalemia, which also frequently creates acute STE and brugada pattern in V1-3.
Saddleback STE is very rarely present in the same leads as acute OMI.
Just to make sure, I checked all the leads and got another immediate repeat ECG:

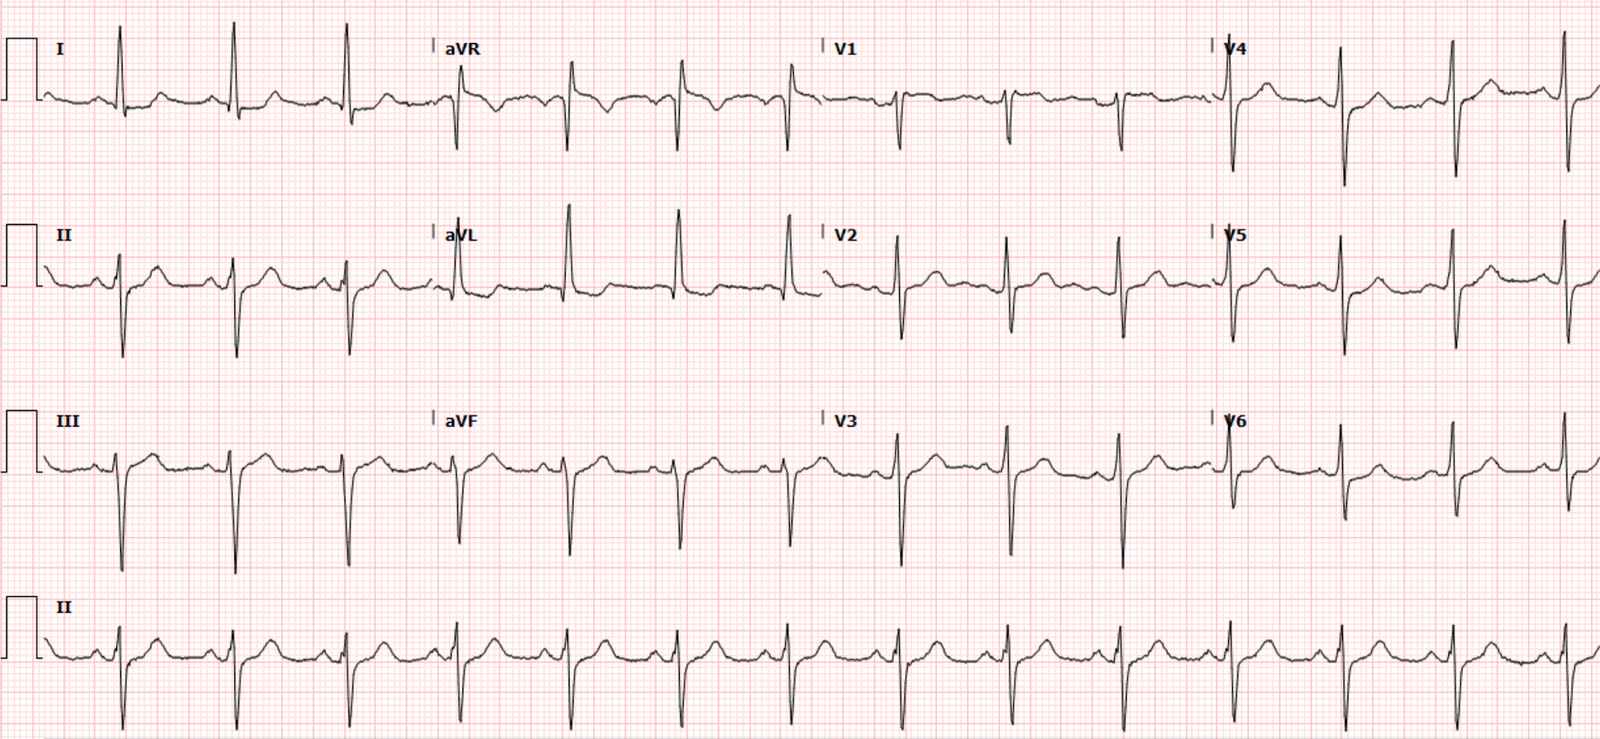
I compared this to his prior ECG on file:
 |
| All STE and T waves are reasonable for this narrow large voltage QRS complex, which has poor R wave progression and possible LVH. If it did not have tiny R waves in V2-V4, I would say it is close to LV aneurysm morphology. Regardless, the anterior findings in his presentation ECG are clearly new. |
With a limited history endorsing chest pain and shortness of breath, and this striking STE, I activated the cath lab. But I had some doubts about what was going on. While waiting for the cardiology team, I did a bedside echo (no contrast) that was slightly limited by poor windows, but I feel confident that I could see some areas of the anterior and lateral walls, and I saw only good function, good thickening and movement.
The cardiology provider arrived and we discussed how unsure we both were of this being acute coronary occlusion. But ultimately we agreed that it would be best to proceed with emergent angiogram and find out. The initial troponin had not returned yet when we made this decision.
He went to cath and was found to have no acute culprit lesion. He had several chronic lesions including mid LAD 50%, D1 50%, D3 50%, none of which were felt to be acute or culprits. The summary of the report reads “Surprisingly, no significant coronary stenoses were found, possible cocaine induced LAD spasm.”
However, there was no spasm directly shown on the angiogram, and no intracoronary treatments for spasm. The EF was estimated at 55%, without any wall motion abnormalities.
Initial troponin returned within normal limits at 8 ng/L (upper reference limit up to 20 ng/L for men).
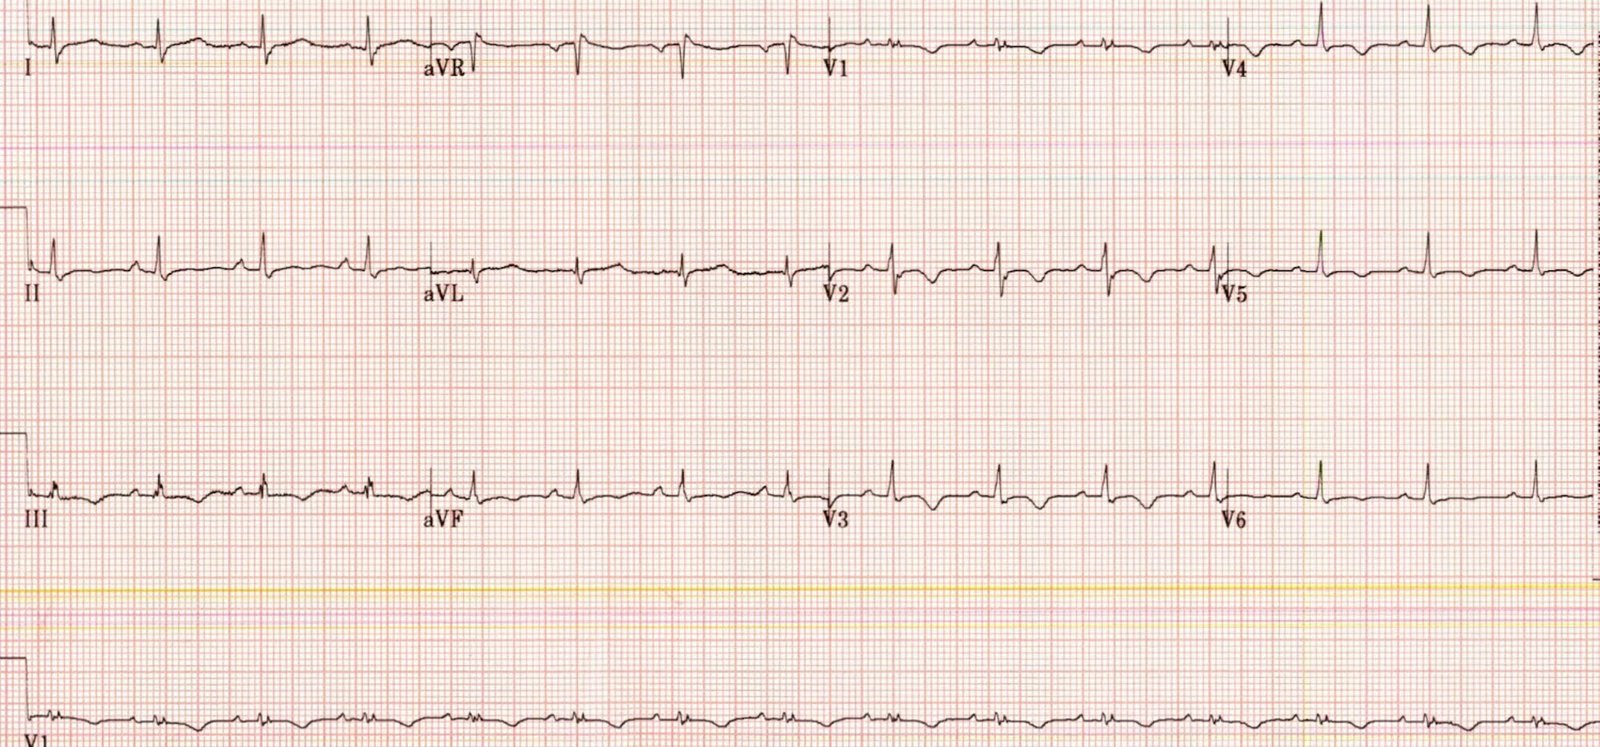
His only repeat ECG after cath was 5 hours later, shown here:
 |
| All anterolateral findings resolved, back to baseline. Not currently any evidence of reperfusion in that area, such as terminal T wave inversion. The inferior leads have some artifact and baseline movement, but there is possibly some STE in II, III, and aVF which is normal and seen on some of his prior ECGs below. |
Two more serial troponins were the unchanged, all 8 ng/L.
A formal echo showed EF 64% with no wall motion abnormalities.
Urine drug screen was positive for cocaine. Potassium was 4.6, CBC and basic metabolic panel all normal.
He was discharged the next day with a diagnosis of cocaine chest pain and vasospasm.
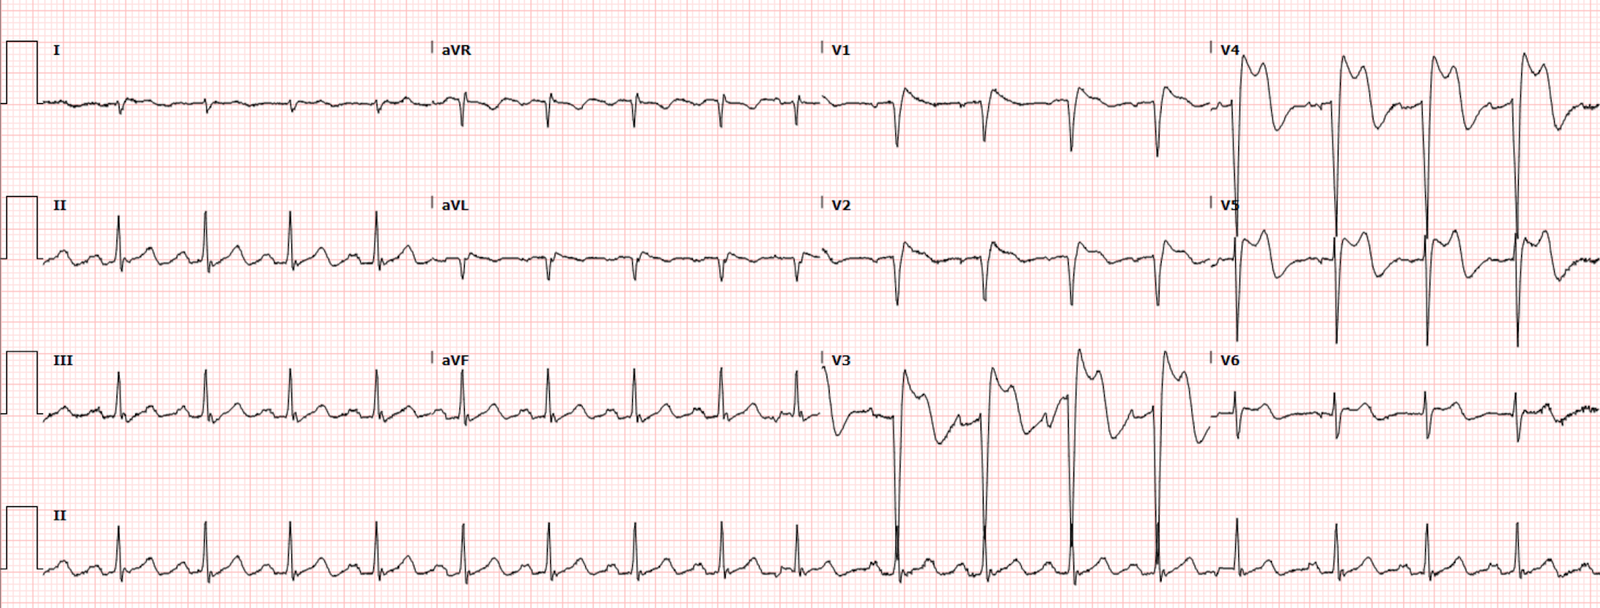
Out of curiosity, I decided to dig into his prior visits (multiple for various vague complaints, sometimes cocaine, sometimes chest pain and shortness of breath) and see if any ECGs before have shown similar findings:


None of these visits included any evidence of AMI. Not a single positive troponin, no other angiograms ever done, never any abnormal cardiac echo.
These ECGs are just variations of his normal variant baseline. You can see that some days his ECG is slightly different that others, some days his normal variant STE is greater in some locations that others. Sometimes tachycardia, hypertension, etc. can exaggerate these findings. These types of variations between ECGs are seen commonly and I have a hard time explaining to learners why they are not “dynamic,” or why they are meaningless even if they can be described as “dynamic.” The bottom line is that I have seen many of these fluctuating baseline ECGs, and seen many OMIs with subtle but truly diagnostic dynamic changes. Sometimes I can tell them apart, sometimes not, but I get better with more and more experience.
Regardless, I do not see any ECG in this patients history that looks even remotely close to his presentation ECG.
Was this cocaine induced Na channel blockade, causing brugada pattern? That’s the best guess I have.
Was it LAD spasm enough to cause enormous anterior STE for at least a half hour, but without causing ANY rise at all in serial high sensitivity troponins? Is that even possible? I think probably not.
Was it some kind of bizarre pulse tapping artifact? I doubt it.
See Dr. Balasubramanian’s comments at the end!
Learning Points:
Saddleback STE morphology is usually considered unlikely to be due to OMI. But we have seen a few rare cases break this rule.
Brugada pattern can be seen in a wide variety of scenarios other than Brugada syndrome. Especially hyperkalemia and sodium channel blockade.
The diagnostic portion of the angiogram is not very dangerous, compared to the risks of the actual intervention if OMI is found (in which case, the benefits are probably worth the risks!). For a patient with possible ACS symptoms and an ECG like this, it is a very reasonable plan to take an emergent look with emergent angiogram. I still think this was a correction option at the time of the decision, with the information available.
The concept of OMI is not all about the ECG. The ECG is just one (very) important part of the decision.
Below I have reproduced some very interesting commentary sent to us about this case by Dr. R Balasubramanian from India:
Reg: Blog Thursday 9TH SEPTEMBER 2021
Dr Smith,
Brugada syndrome (BrS)
and Early Repolarization Syndrome (ERS) are two major phenotypic expressions of the same J wave family and this ECG is unique, because both these syndromes
are manifested in the same ECG of the same
patient, incidentally solving the mystery of “what is the cause of the massive ST elevation, with the
coronary angiogram drawing a
blank.”
In the first ECG ( Triage ECG ), of course, there is Brugada
pattern in V1 & V2. Concurrently, there is also J wave lying near
the baseline in each of the inferior leads ( II , III & aVF ). Now,
please note the third ECG showing climbing up of the J wave along with
mild ST elevation. In the
fourth ECG, the J wave has climbed up to two thirds of the R wave with about 5 mm of STE, with concave
morphology and upright T wave. Thereafter, serial ECGs show J waves
gradually climbing down with STE also settling down. So, the ST
elevation in the anterior leads also must be on the same lines -a manifestion
of pseudo-myocardial hyperacute infarction pattern of ERS.
Occurrence of
both BrS and ERS in the same ECG and same patient has given an incontrovertible evidence that they are indeed similar in patho-electrophysiology.
That way this ECG is priceless and is likely to grab the attention of the scientific community.
With regards,
Dr.R.Balasubramanian.
Professor Emeritus in Medicine
SLIMS
Pondicherry – INDIA