Written by Pendell Meyers
A man in his sixties with no prior history of CAD presented with fluctuating central chest pain that started the night before presentation, then went away, then woke him up from sleep the morning of presentation. The pain was 10/10 on arrival, with SOB. Although he also had some nasal drip and sore throat, he had no cough or fevers (this occurred during peak COVID).
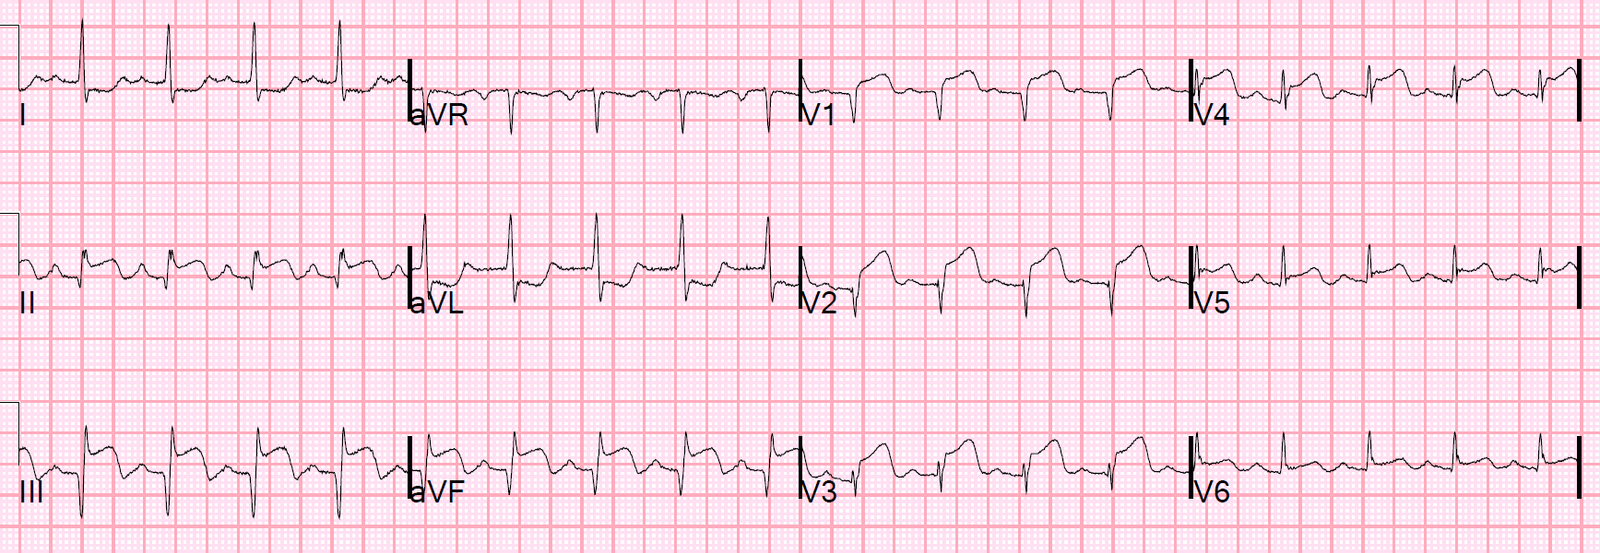
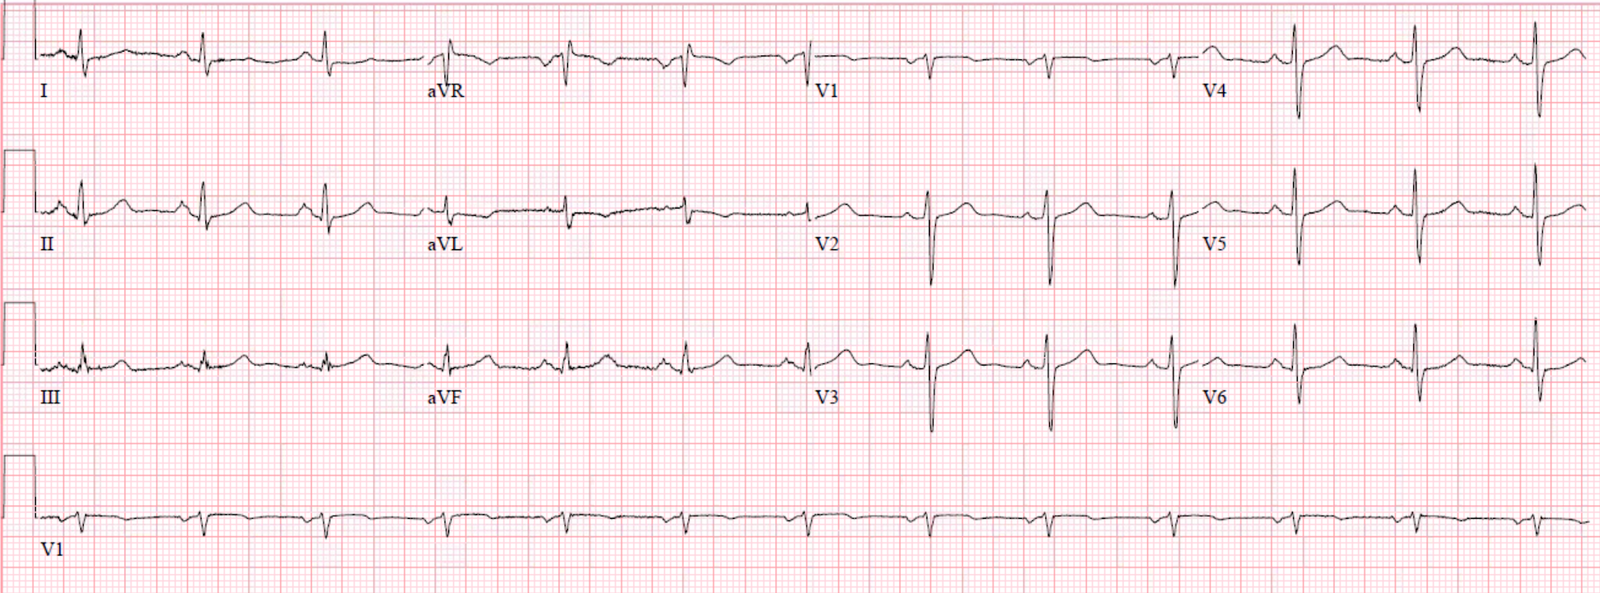
Here is his triage ECG:
 |
| What do you think? |
Normal P-waves would have upright morphology in the inferior leads (especially lead II) and usually biphasic (up-down) morphology in V1. These p-waves are negative in almost all leads except for aVR and aVL, so the axis of the P-wave is almost directly upward. In addition, the P-wave is very close to the QRS, signifying that the atrial rhythm originates close to the AV node and creates a retrograde P-wave by going from the bottom of the atrium to the top.
Therefore this is likely an ectopic rhythm, originating from the low atrium or the junction.
There is apparent STE in II, III, aVF, and reciprocal STD in aVL.
I texted this ECG with no clinical information to Dr. Smith, and he said:
“High junctional rhythm with retrograde P wave before QRS. This often causes false positive ST elevation in inferior leads, so I think pseudoSTEMI.”
I asked for more explanation, and Dr. Smith said: “Because the atrial repolarization wave, which usually causes PR depression, will cause PR elevation when the atrium is depolarized in the opposite direction. Then because the P-wave is so close to the QRS, that PR elevation extends beyond the QRS and looks like ST elevation.”
The patient went for emergent cardiac catheterization and was found to have no obstructive CAD.
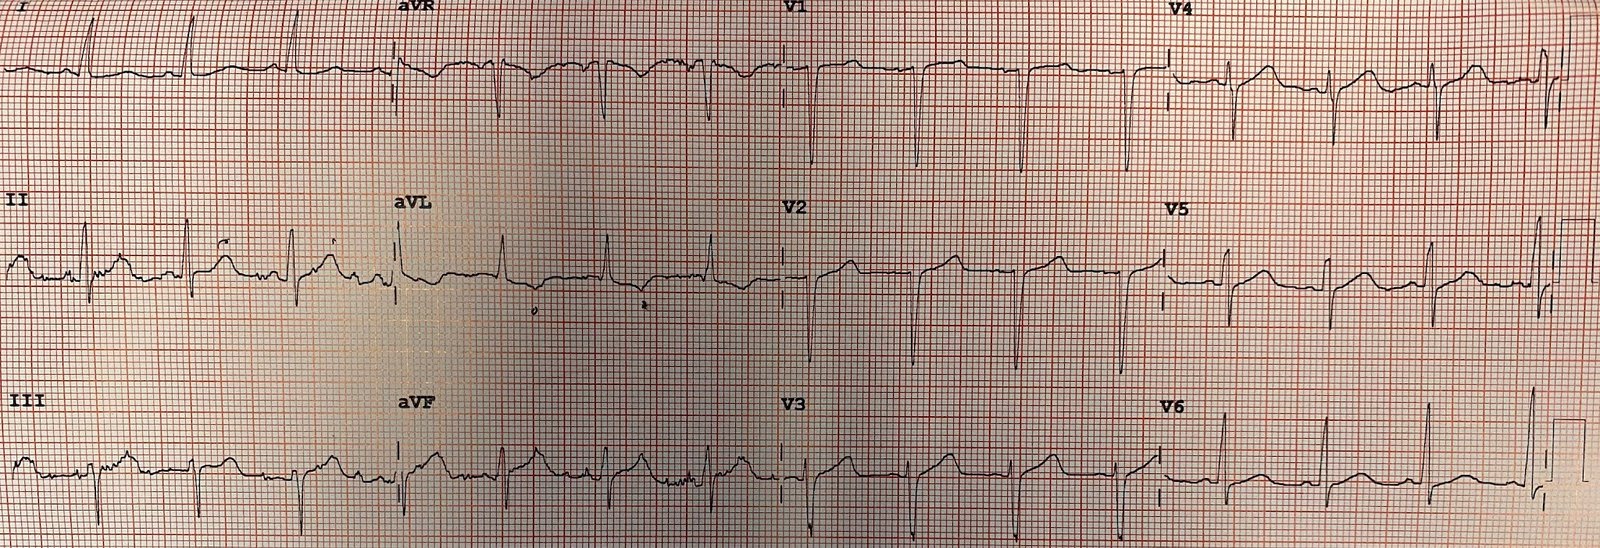
Here are two repeat ECGs soon after cath:
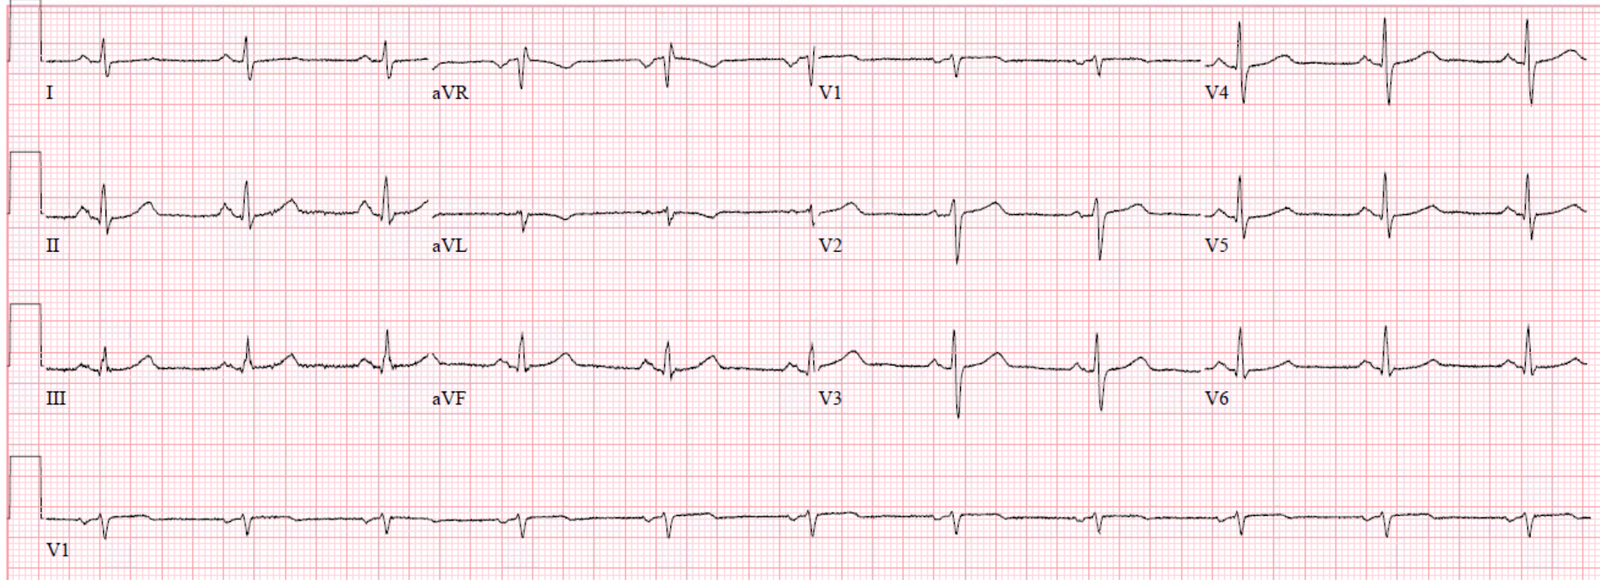
These ECGs show resolution of the ectopic atrial rhythm, now with sinus rhythm. There is no longer any ST elevation in the inferior leads.
His chest pain subsided without further therapy.
He had a negative CXR, completely normal echocardiogram without any pericardial effusion.
Four serial troponins were undetectable.
CT pulmonary angiogram was negative for pulmonary embolism.
Covid swab was negative.
A right upper quadrant ultrasound showed mild extrahepatic biliary ductal dilatation (post cholecystecomy), and a subsequent MRCP showed mild dilation of the common bile duct and cystic duct to the level of the ampulla, favoring sphincter of Oddi dysfunction.
The patient was discharged with primary care and GI follow up.
Learning Points:
Low atrial or junctional ectopic pacemaker presents with negative (retrograde) P-waves in the inferior leads and usually fully upright P-waves in V1.
With normal P-waves (usually upright P-waves in most leads) the atrial repolarization wave causes PR depression when it is noticeable at all (many times it is not noticeable at all, as there is low relative amount of atrial myocardium). When the atrium is depolarized in the opposite direction, as in a low atrial ectopic pacemaker, then the atrial repolarization wave would cause PR elevation. However, because the inverted ectopic P-wave is so close to the QRS, the PR elevation extends beyond the QRS and looks like ST elevation instead.
See more posts on the atrial repolarization wave:
K. Wang Video lecture: the Atrial Repolarization Wave (Ta Wave)
Look at this ST Depression
Atrial Repolarization Wave Mimicking ST Depression
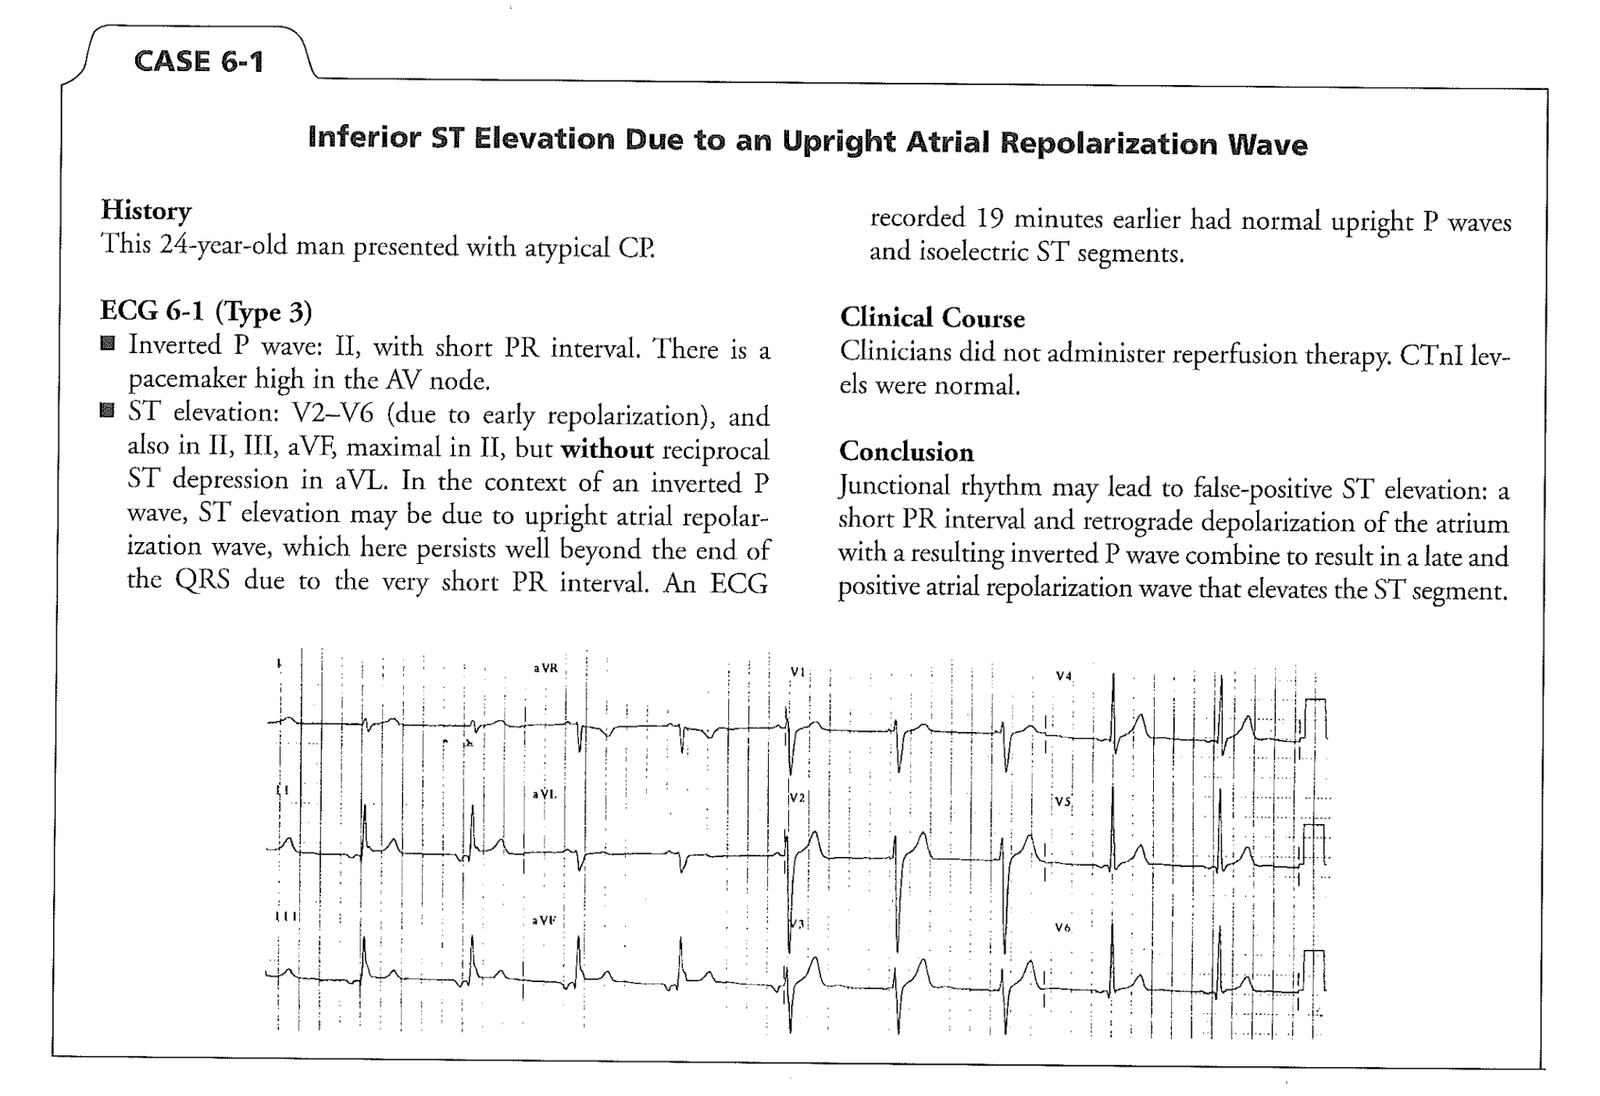
Here is another case (Case 6-1 on p. 32 of Smith’s book, The ECG in Acute MI)–link to free full text pdf.
![]()
===================================
MY Comment by KEN GRAUER, MD (6/3/2020):
===================================
This is a case that almost everyone gets fooled on the 1st time they see it. So, if you hadn’t previously encountered the Emery Phenomenon — you’ll be READY for it the next time you see a patient with this.
To illustrate this phenomenon that is explained above by Dr. Meyers — I’ve adapted Figure-1, which I’ve taken from a 2015 post on the ECG Rhythms website.
- As suggested in Figure-1 (and explained by Dr. Meyers) — the atrial repolarization wave (ie, the T of the P wave) is always present — but with sinus rhythm, the timing of the Tp will largely coincide with the timing of the QRS complex, and therefore not be noticed on the ECG (dotted RED half circle, seen to the left in Figure-1).
- As shown in Figure-1 — the Tp will be oppositely directed to the P wave. Therefore, with normal sinus rhythm (in which by definition, the P wave will be upright in lead II) — the TP will be negative.
- IF the P wave in lead II is negative (as may occur with either a low atrial or junctional rhythm) — then the Tp will be upright (dotted RED half circle, seen to the right in Figure-1). If the Tp wave is large in size and upright — it may distort the end of the QRS complex, and produce the false impression of ST elevation.
KEY Points:
- The size of the Tp wave will be proportional to the size of its P wave. A small P wave will produce a correspondingly small Tp wave. A large P wave will produce a much bigger Tp wave.
- Actually — the effect of the oppositely-directed atrial repolarization wave ( = the Tp — also known as the “Ta” or atrial T wave) will be even larger than shown below in Figure-1 — because normal duration of the Ta wave is significantly longer (up to 2-3 times longer) than normal P wave duration (Francis). This may account for an “exaggerated” effect on the ST segment when the P wave is large.
- That said — I preserved the same relative proportions in Figure-1 as were seen in the original version of this Figure taken from the ECG Rhythms website. Note that the PR interval for the negative P wave in Figure-1 is almost as long as the PR interval for normal sinus rhythm. But IF the PR interval for the negative P wave in lead II is much shorter (as occurs in today’s case) — then the upright Tp wave that will be seen with a low atrial rhythm will be further displaced to the right, which will produce a much greater degree of pseudo– ST-elevation!
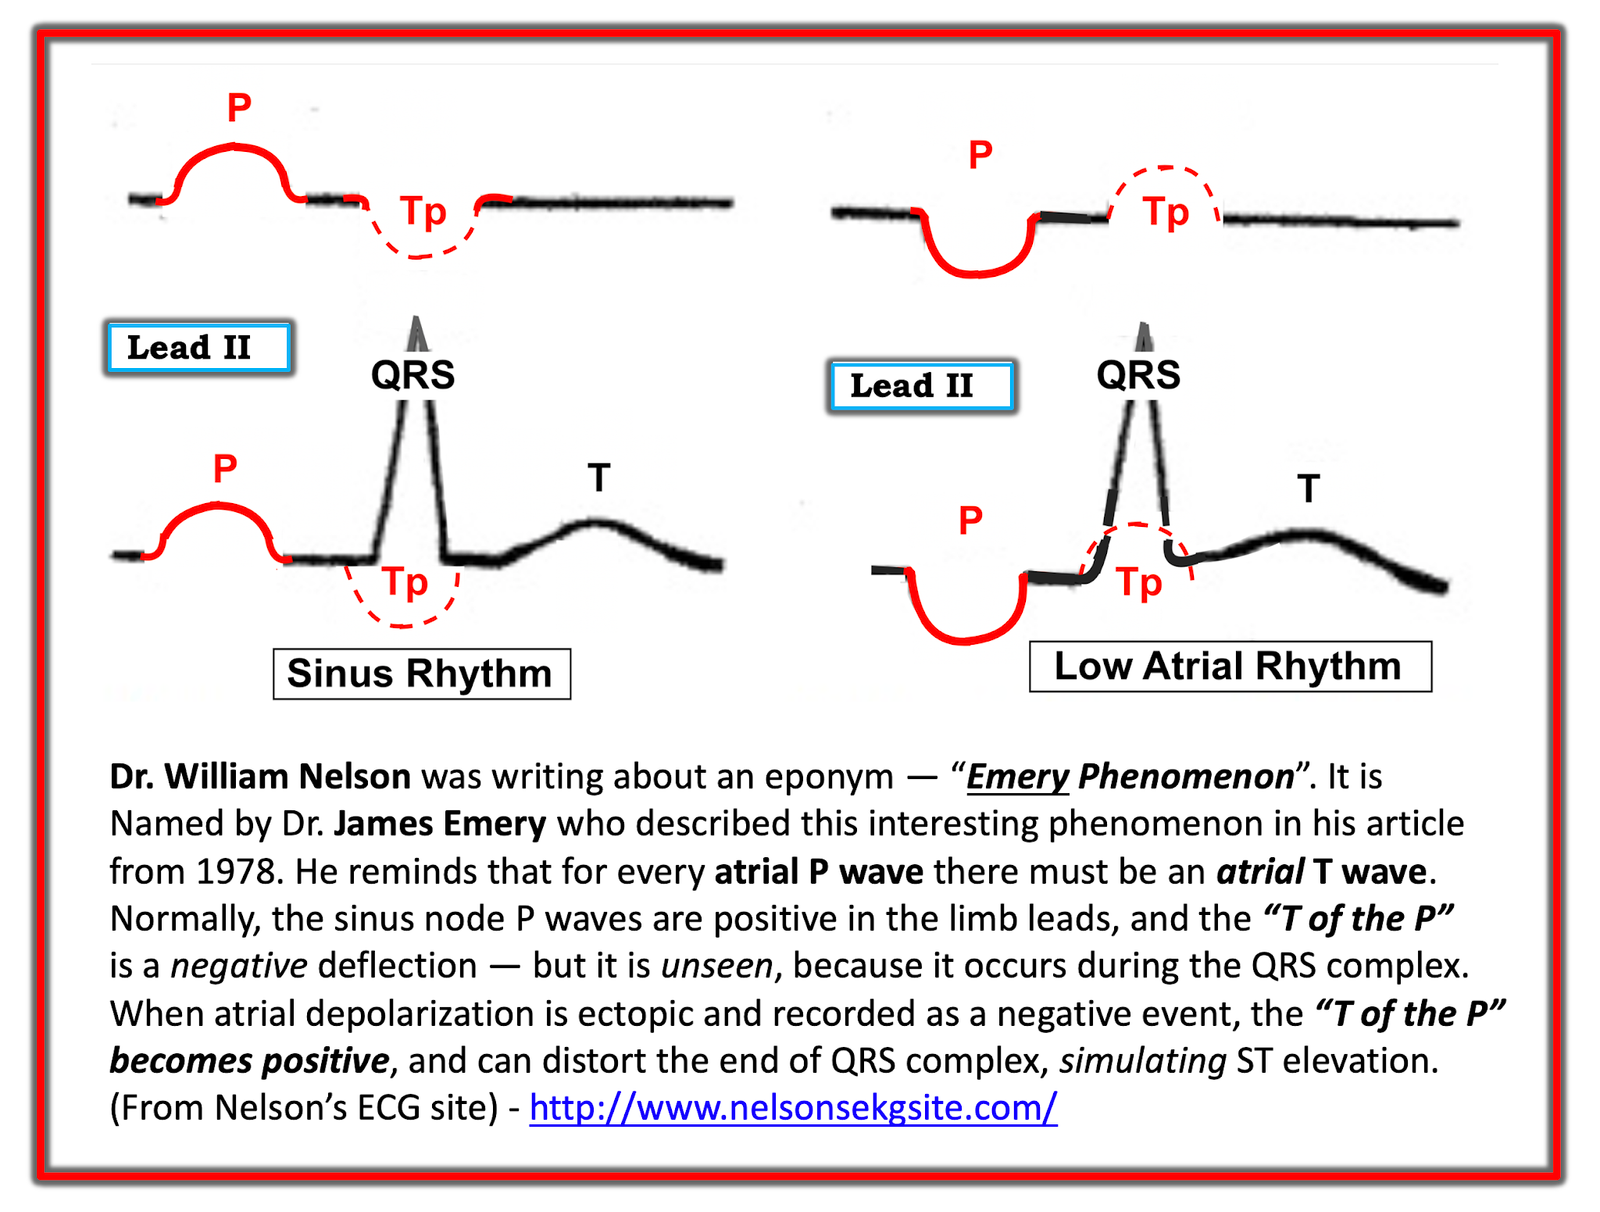 |
| Figure-1: Illustration of the Emery Phenomenon. (I have adapted this Figure from the 2015 post by Dr. Bojana Uzelac on Armel Carmona’s ECG Rhythms website). |
For clarity — I’ve reproduced in Figure-2 the initial ECG in today’s case — and have placed the 1st post-cath tracing below it. Note the following:
- The P wave in each of the inferior leads of ECG #1 is negative — fairly large in size — and manifests a very short PR interval. As a result — the Tp wave will be positive, and of fairly large size, and the Tp wave will be displaced to the right. As I schematically show in RED in the magnified view of lead II — this results in significant pseudo– ST elevation.
- The P wave in lead aVL of ECG #1 is positive — surprisingly large in size (for a P wave in lead aVL) — and manifests a very short PR interval. As a result — the Tp wave in lead aVL will be negative, and of fairly large size, and it will produce reciprocal ST depression that mirrors the pseudo-ST elevation we saw in the inferior leads.
- That the T wave in lead aVL of ECG #1 is negative is not at all unexpected — because T wave negativity is commonly seen in lead aVL when the QRS complex in this lead is predominantly negative. Confirmation that this negative T wave in lead aVL of ECG #1 was not abnormal — is forthcoming from the post-cath ECG ( = ECG #2) — which still shows T wave inversion in lead aVL, even after resolution of the pseudo- ST depression.
- PEARL — An additional reason to suspect that ECG #1 does not reflect true inferior lead ST elevation (with reciprocal ST depression in lead aVL) — is the complete lack of any suggestion of posterior wall involvement (ie, there is no anterior lead ST depression, as is almost always present to at least some degree with true acute inferior STEMI).
- Finally — ECG #2 (that was performed after the negative cardiac cath) — shows no abnormalities. The persistently negative T wave in lead aVL is not abnormal (as mentioned above) — since the QRS complex is predominantly negative in this lead. As I schematically show in light BLUE in the magnified view of lead II — the Tp wave is now opposite (negative) to the upright P wave in this lead. Because the PR interval is normal — this negative Tp wave will for the most part occur within the confines of the QRS complex, and therefore not be visible on the ECG.
BOTTOM Line: This 60-something man needed to be cathed — since he presented to the ED with 10/10 chest pain that awakened him from sleep, in association with the ECG findings seen in the TOP tracing of Figure-1.
- That said, even though a patient like this may merit prompt cath for diagnostic purposes — my hope is that the next time you see an ECG like this, you’ll immediately recognize it as most likely the result of a pseudo-infarct pattern produced by the large, negative P waves with very short PR interval in each of the inferior leads.
Our THANKS to Dr. Meyers for presenting this important case!
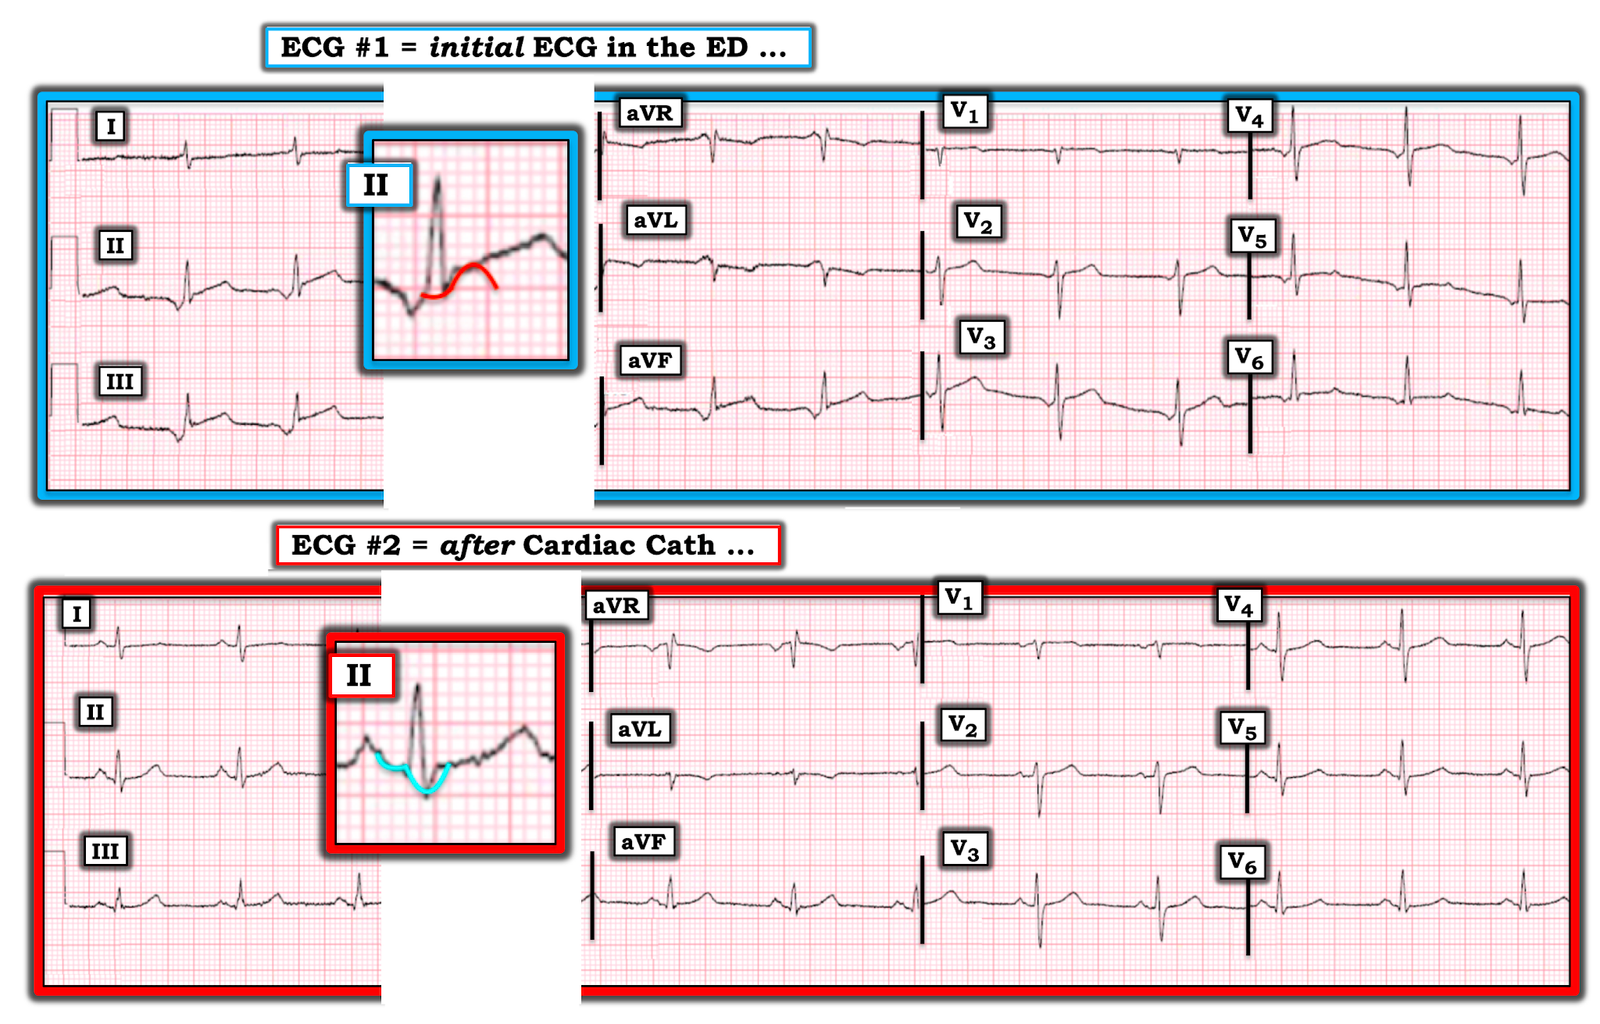 |
| Figure-2: The initial ECG in the ED — with the 1st post-cath tracing below it (See text). |
![]()