A middle aged male with some coronary risk factors presented to the ED after an episode of typical sounding chest pain that was resolved upon arrival.
He was in the ED for an hour when he developed chest pain again and had this ECG immediately recorded:
 |
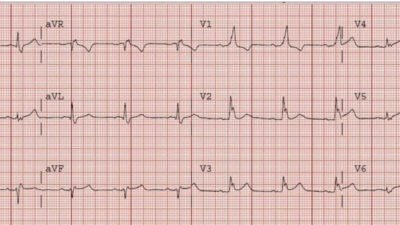
| There is sinus rhythm at a rate of about 60. There is ST elevation at the J-point that does not quite meet “STE criteria” of 2 mm for these 2 leads. There is no convexity, ST depression, or Q-waves that would tell us that this ST elevation is clearly pathologic.
|
So the ECG is normal, right?
Some Background
What I neglected to tell you is that when the patient had arrived pain free, he had this ECG recorded:
 |
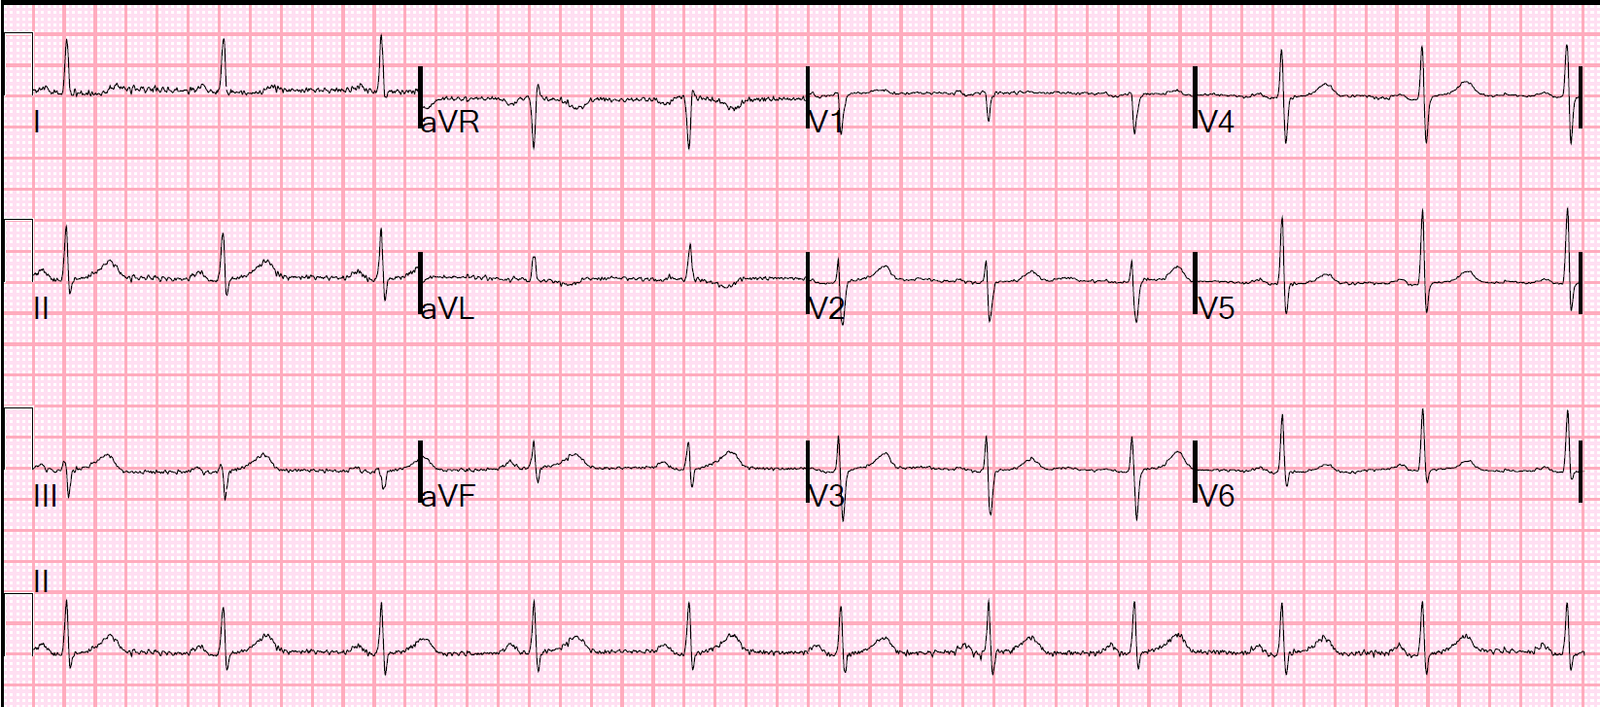
| Here there is subtle terminal T-wave inversion in V2, and a bit in V3, typical of early Pattern A Wellens’ waves. |
See this case for Wellens’ original images of Pattern A and Pattern B Wellens’ waves.
So the first ECG is not normal; it is “pseudonormal.”
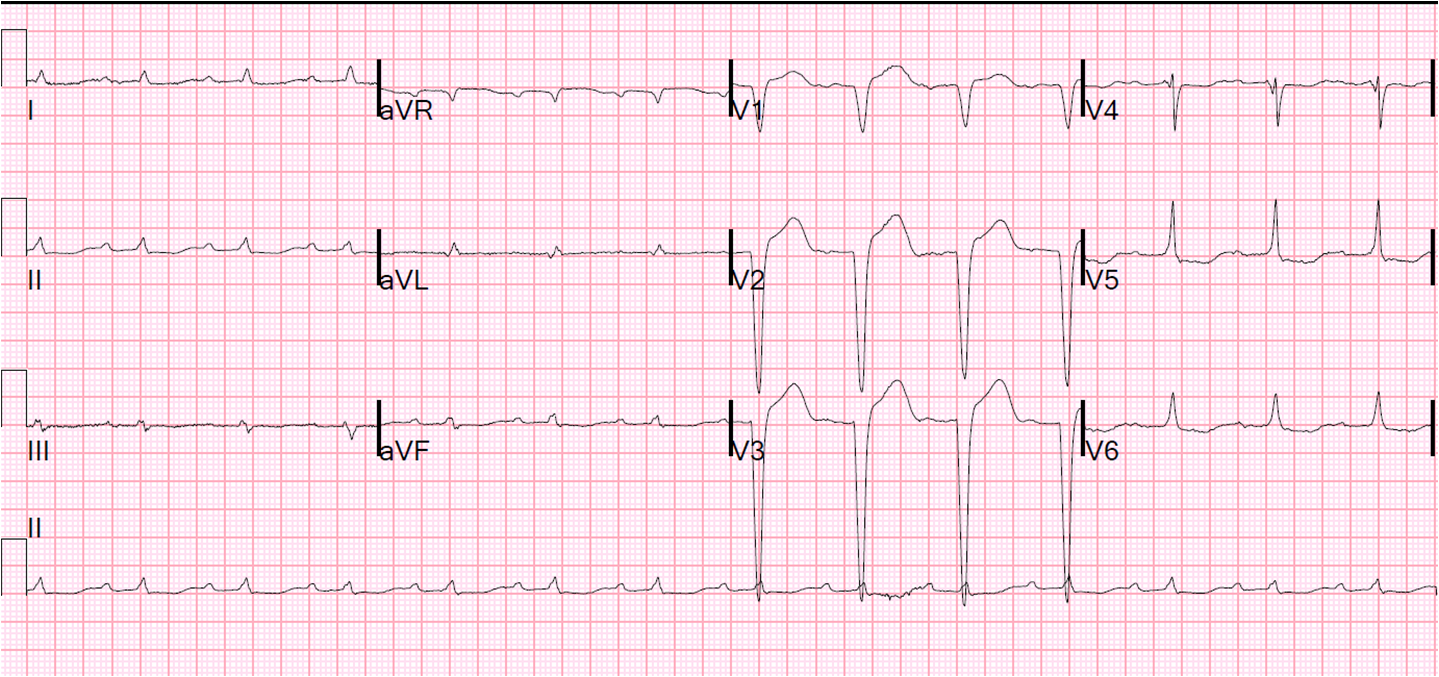
It triggered the recording of serial ECGs (sorry, not available) which showed increasing ST elevation diagnostic of LAD occlusion.
So this was Wellens’ syndrome, a state of spontaneous reperfusion of the LAD, manifesting with “reperfusion T-waves” and R-wave preservation after an episode of closure of the LAD. Thus, the patient presents pain free after an episode of angina.
The importance of Wellens’ syndrome is that the artery can close off again at any moment, in which case the inverted T-waves will become upright again and look normal. This is called “pseudonormalization”.
The first ECG was recorded so soon after re-occlusion of the artery that this ECG shows no signs of occlusion other than pseudonormalization, which requires comparison with the previous.
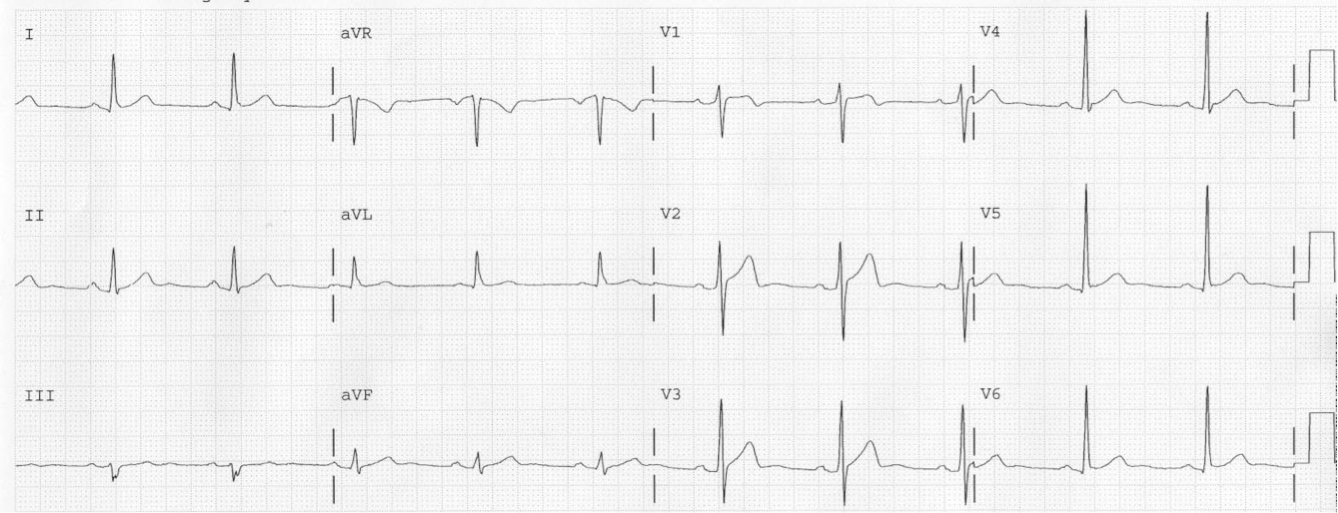
See these other cases of less subtle pseudonormalization (there are 7 cases here, the best are the last two)