Sent by anonymous.
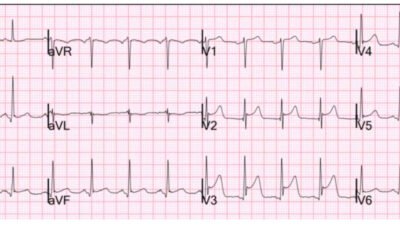
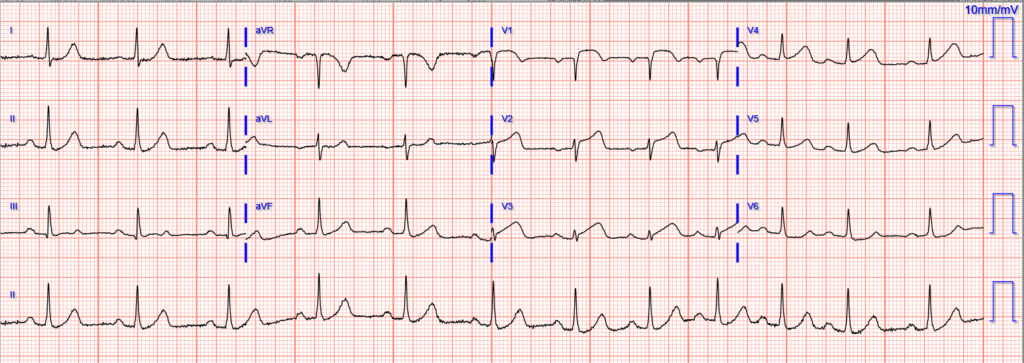
A woman in her 60s presented with acute chest pain and normal vital signs. Here is her triage ECG:

What do you think?
It shows diagnostic findings of acute LAD occlusion, including the precordial swirl pattern (inappropriate STE and HATWs in V1-V2/V3, and reciprocal STD in V5-V6).
Smith: there are hyperacute T-waves in V2-3, down-up T-waves in III, aVF, and V6. There are all highly specific for LAD Occlusion MI (OMI).
Read more about precordial swirl pattern in our publication and this blog post:
Sadly it was interpreted as “No STEMI”, which is the extent of normal ECG teaching and performance in most clinical practice.
Here is the PMcardio QOH interpretation:
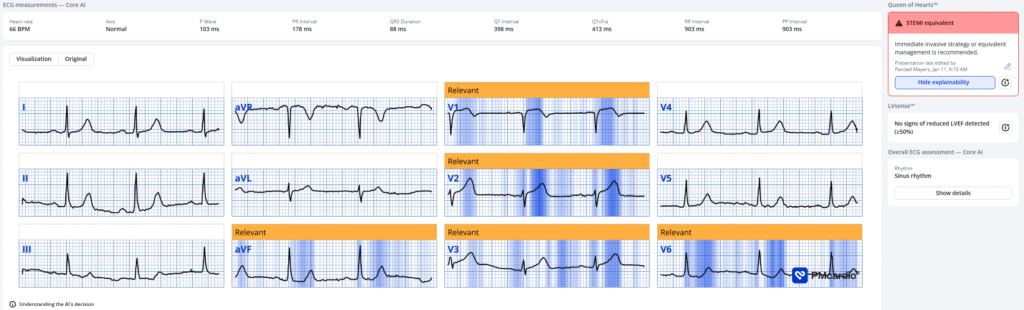
New PMcardio for Individuals App 3.0 now includes the latest Queen of Hearts model and AI explainability (blue heatmaps)! Download now for iOS or Android. https://www.powerfulmedical.com/pmcardio-individuals/ (Drs. Smith and Meyers trained the AI Model and are shareholders in Powerful Medical). As a member of our community, you can use the code DRSMITH20 to get an exclusive 20% off your first year of the annual subscription. Disclaimer: Certain AI ECG Modules are CE-marked medical devices under EU MDR and are certified for marketing only in the European Union and the United Kingdom. PMcardio technology has not yet been cleared by the US Food and Drug Administration (FDA) for clinical use in the USA.
The physician decided to order labs including a troponin before any significant action.
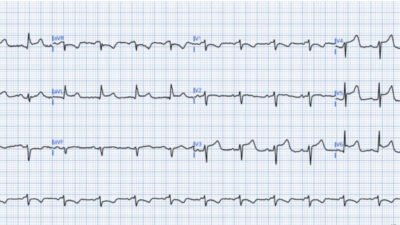
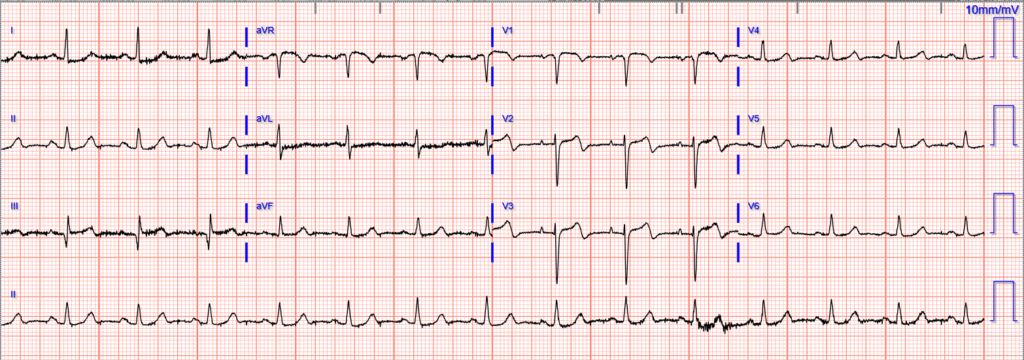
The initial troponin was 48 ng/L. This triggered a repeat ECG, 1.5 hours after first:
This was interpreted as “STEMI”, so the cath lab was activated.
The mid LAD Occlusion was opened.
Repeat troponins rose to >25,000 ng/L (too high to measure — it could have been over 100,000 ng/L)
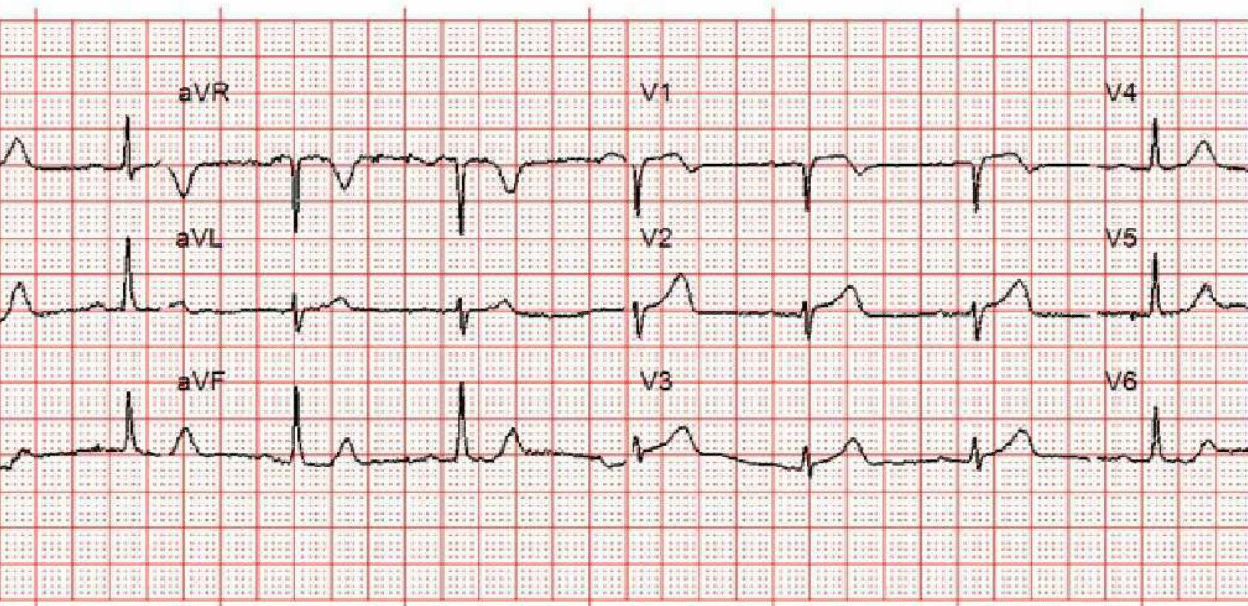
A repeat ECG was obtained hours after cath:
The formal echocardiogram showed:
The left ventricular systolic function is mildly reduced with LVEF of 40%
(+/-5%) by 3D. There is severe hypokinesis to akinesis of the mid to apical anteroseptal and inferoseptal wall. There is severe hypokinesis of the apical inferior, apical anterior, and apical wall.
I think that this patient’s long term outcome would be better if they had been recognized and treated 1.5 hours earlier.
Smith:
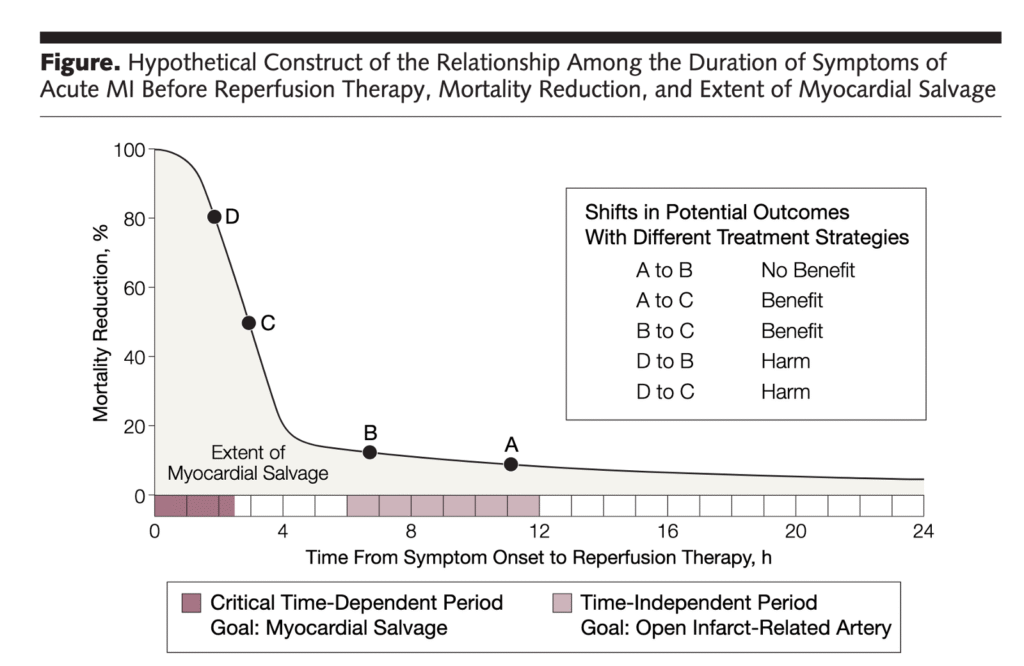
Remember this graph: By 4 hours after onset of chest pain, 80% of the benefit of reperfusion is lost!!
Pendell will present an abstract at ACC meeting in New Orleans. In it, 380 (19%) of 2000 cath lab activations had an initial “non-diagnostic” ECG. The mean delay between that initial non-diagnostic ECG and the subsequent “STEMI” ECG was 74 minutes. On 297 (78%) of those 380 Non-diagnostic ECG, the Queen of Hearts was able to detect OMI an average of 68 minutes prior to the STEMI ECG. Mortality in these patients was 9.4%.
= = =
======================================
MY Comment, by KEN GRAUER, MD (1/15/2026):
The important point to learn from today’s case is simple: When at all uncertain as to whether a patient with new CP (Chest Pain) is in the midst of an ongoing acute cardiac event — Repeat the ECG within 15-20 minutes! Although possible that no significant change will be observed when the initial ECG is repeated within this brief 15-to-20 minute period of time — We have illustrated numerous examples on Dr. Smith’s ECG Blog in which dramatic ST-T wave evolution will be seen within a surprisingly short period of time! (See My Comment in the December 7, 2025 post — and the July 9, 2025 post, among many others).
- And if CP persists despite the lack of significant change on a repeat ECG done 15-to-20 minutes after the initial tracing — Repeat the ECG one more time within another 15-to-20 minutes. If your patient’s CP is from acute ischemia — there is an excellent chance that your repeat ECG(s) will now show some “dynamic” ST-T wave changes that allow you to make a definitive diagnosis.
- The reason for expediting assessment (and cath with PCI when indicated) — is simple = “Time is Muscle (myocardium)”. As emphasized in the October 23, 2025 post (and in the graph Dr. Smith added above) — The most benefit from reperfusion occurs within the first 4 hours (Every 2-hour delay results in 60% more myocardium infarcted).
= = =
Was the Initial ECG Diagnostic?
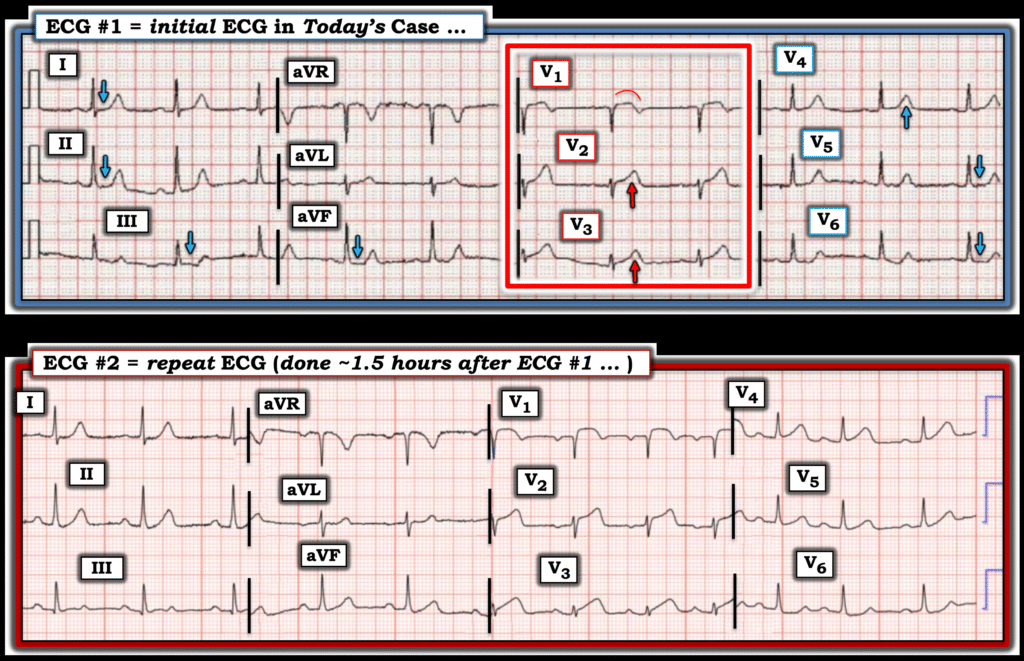
Looking closely at today’s initial ECG (that I’ve labeled in Figure-1) — this tracing is already diagnostic, with no need to wait for Troponin or a repeat tracing before activating the cath lab.
- The rhythm is sinus — with normal intervals and axis, and no chamber enlargement.
- My “eye” was immediately drawn to anterior leads V1,V2,V3 (within the RED rectangle in Figure-1). Considering small size of the QRS in these leads — the associated ST-T waves are clearly not “normal”
- The ST-T wave in lead V1 is definitely abnormal, in that there is more ST elevation than should be seen in this lead when the ECG shows no LVH and no QRS widening — plus the shape of the ST segment in lead V1 is abnormally coved, and ends with abnormal T wave inversion.
- In leads V2,V3 — the QRS is tiny! As a result — the ST-T waves in these leads are clearly disproportionate (fatter-at-peak and wider-at-base than should be given these tiny QRS complexes).
- Assessing the T wave in lead V4 is more challenging — but by the concept of neighboring leads (ie, the definite hyperacute T waves in leads V2,V3) — the T wave in lead V4 is “bulkier” than it should be.
- ST-T wave changes in the remaining leads are more subtle — but given hyperacute ST-T waves in leads V1-V4 in this patient with new CP — I interpreted the ST segments in leads I,II,III,aVF; and V5,V6 as definitely flattened (and the slight ST depression we see in lead V6 in association with anterior lead findings suggests “Precordial Swirl” — as per the multiple examples provided by Drs. Meyers and Smith, and My Comment at the bottom of the page in the October 15, 2022 post).
= = =
When the ECG was Finally Repeated …
The bottom tracing in Figure-1 shows obvious evolution of this acute STEMI. But the point is that much of the potential benefit from reperfusion has already been lost by this 1.5 hour delay that did not have to be.
- PEARL: If you had difficulty appreciatiating the hyperacute ST-T waves in each of the leads that I highlight above in ECG #1 (ie, in leads V1,V2,V3 and V4) — Compare the 2 tracings in Figure-1. Going back over the initial ECG once you see how serial tracings evolve — is the BEST way to improve your ability to instantly detect subtle-but-definitely-present ST-T wave changes in your patient’s initial ECG!
= = =
Figure-1: Comparison between the initial ECG in today’s case (which I’ve labeled) — with the repeat ECG done ~1.5 hours later .
= = =
= = =