Written by Bobby Nicholson.
= = =
What do you think of this “STEMI”?
A man in his 90s with a history of HTN, CKD, COPD, and OSA presented to the emergency department after being found unresponsive at home.
- With EMS, patient had a GCS of 3 and was saturating 60% on room air.
- He improved to 100% with the addition of non-rebreather, however remained altered and was intubated by EMS with ketamine and succinylcholine.
- Vital signs were within normal limits on arrival to the Emergency Department.
- Blood glucose was not low at 162 mg/dL.
- CTA head and neck were obtained and showed no evidence of intracranial hemorrhage, large vessel occlusion stroke (what a helpful and apt name for an acute arterial occlusion paradigm, by the way…), or basilar ischemia.
= = =
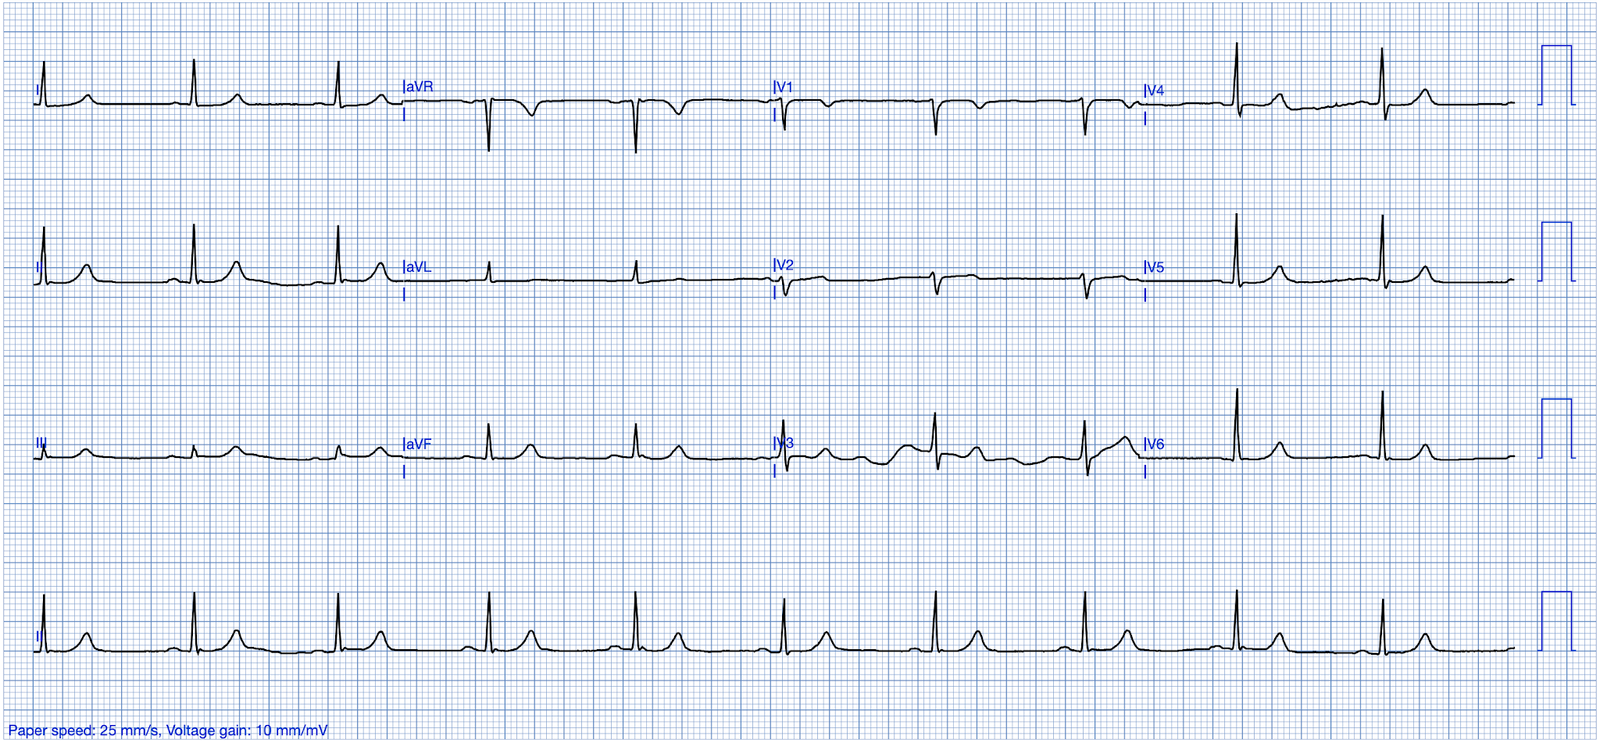
EKG on arrival to the ED is shown below:
— What do you think? —
= = =
Nicholson: On my initial interpretation — the patient has normal sinus rhythm with a narrow QRS complex, and LVH. However, T waves do not appear to be hyperacute or hyperkalemic. There are J waves and STE in leads V2-V6 — however there is no evidence of terminal QRS distortion, as leads V2 and V3 have clear S waves and leads V4-V6 have J waves. There is also RA-RL limb lead reversal (See Ken Grauer‘s detailed explanation below).
= = =
Smith: First, the clinical situation has a low pretest probability of OMI. The patient is unconscious and hypoxic.
- Second, although there is a lot of ST Elevation which meets STEMI criteria (especially in V3-4) — the ST segment is extremely upwardly concave with very large J-waves (J-point notching).
- There is high QRS voltage.
- The T-waves are very assymetric, typical of early repolarization.
All of this tells us that this ST Elevation is not ischemic ST Elevation.
= = =
Here is the Queen of Hearts interpretation with explainability:

| Notice that QOH highlights the large R-waves, the J-waves and the upward concavity. Version 1 model output = 0.0373. Version 2 = 0.0272. Both highly negative. Click here to sign up for Queen of Hearts Access |
The Case Continues:
Given the lack of intracranial hemorrhage, the patient was administered aspirin for suspected ACS and cardiology was consulted.
- The providers documented concern for ST elevation in the precordial and lateral leads as well as a concern for hyperkalemic T waves in the setting of succinylcholine administration.
- Potassium was 4.9 mEq/L.
- Initial troponin-I = 0.05 ng/mL (consistent with prior baseline).
= = =
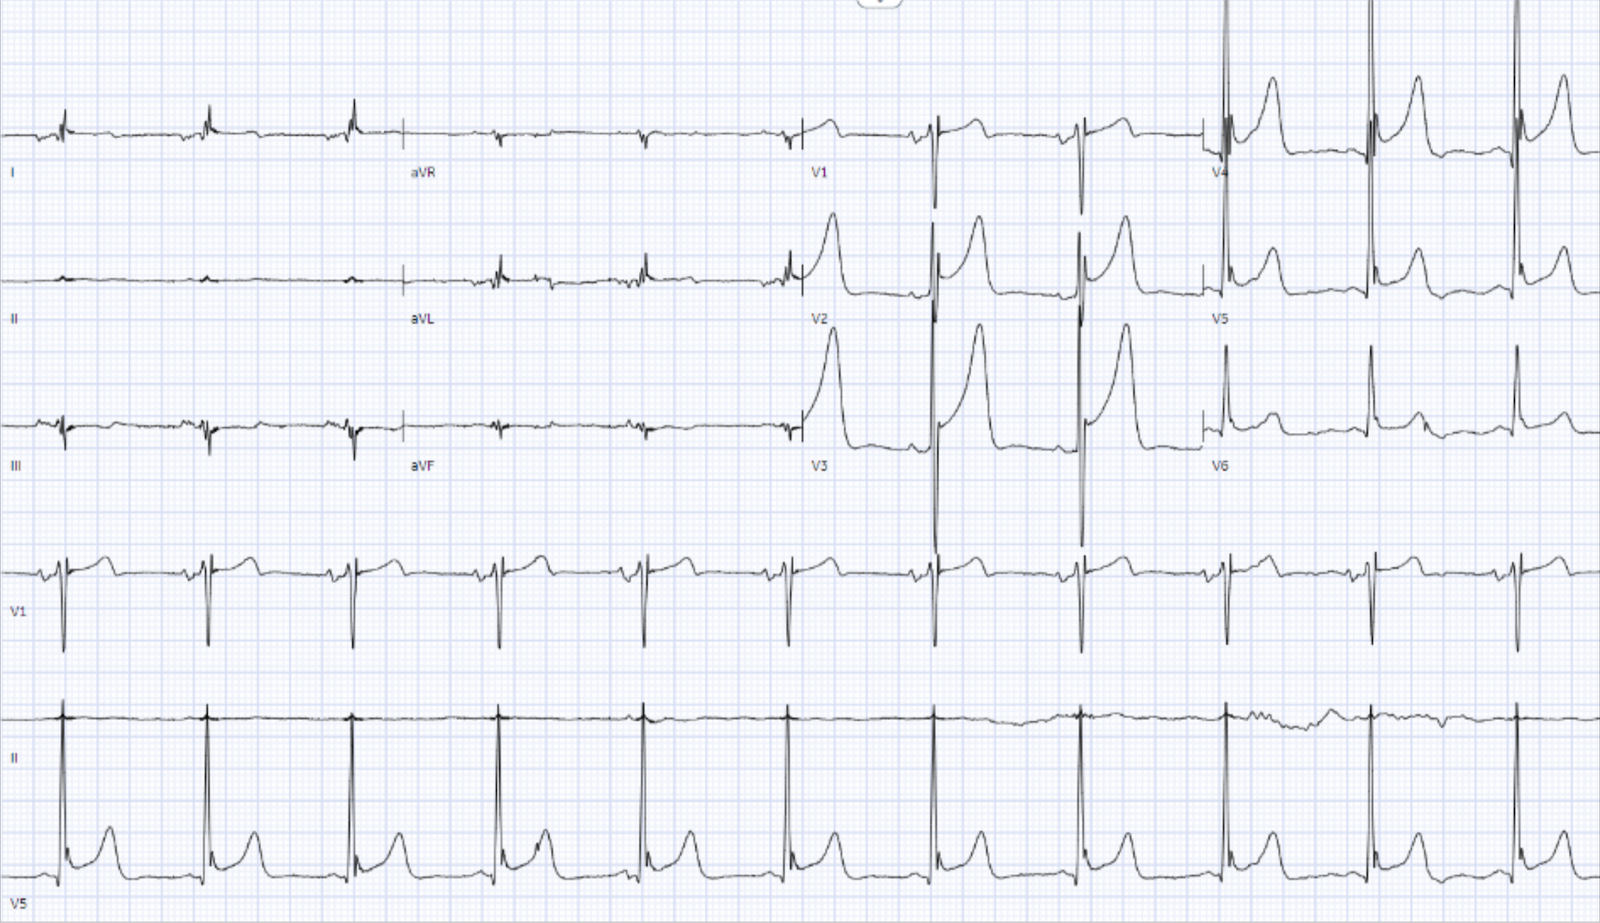
A repeat EKG was obtained 1 hour after the initial EKG.

What do you think? Any changes?
(Limb lead reversal is now resolved).
= = =
Unfortunately, QOH V1 got tricked by this second ECG! V1 output 0.667 (which is actually mid-to-high confidence) — but thankfully the new and improved version 2 was not tricked at all, correctly sees No OMI with extremely low output of 0.0053.
- Repeat EKG was noted to have persistent ST elevation in the precordial leads, thus the patient was treated with heparin and ticagrelor, and taken for cardiac catheterization.
- Preliminary findings documented in the cath lab were “Anterior STEMI and no significant coronary artery disease.” (!!!)
- Following PCI, the patient ruled out by troponins: troponin increased to 0.08 ng/mL and 0.10 ng/mL before returning to 0.05 ng/mL.
- Echocardiogram was obtained and showed mild LVH without regional wall motion abnormality.
The conclusion after cardiac catheterization was that this case represents benign early repolarization, or normal variant STE. I think this is actually clear on the initial EKG, but we can check our suspicion with the 4 variable formula which was 16.7, supporting a diagnosis of benign early repolarization (BER) instead of LAD occlusion.(1)
- Both the old formula and Queen of Hearts got this right.
- But overall, Queen of Hearts is more reliable than the formula.
In considering a differential diagnosis of BER vs LAD OMI — it is important to remember the importance of seeing terminal QRS distortion in V2 and/or V3. This is defined as the absence of either an S wave or a J wave in V2 and V3. In cases where terminal QRS distortion is present in V2 or V3 — it has been 100% specific for LAD OMI.(2) There was no terminal QRS distortion on these ECGs.
1) Driver BE, Khalil A, Henry T, Kazmi F, Adil A, Smith SW. A new 4-variable formula to differentiate normal variant ST segment elevation in V2-V4 (early repolarization) from subtle left anterior descending coronary occlusion – Adding QRS amplitude of V2 improves the model. J Electrocardiol. 2017 Sep-Oct;50(5):561-569. doi: 10.1016/j.jelectrocard.2017.04.005. Epub 2017 Apr 19. PMID: 28460689.
2) Lee DH, Walsh B, Smith SW. Terminal QRS distortion is present in anterior myocardial infarction but absent in early repolarization. Am J Emerg Med. 2016 Nov;34(11):2182-2185. doi: 10.1016/j.ajem.2016.08.053. Epub 2016 Aug 27. PMID: 27658331.
= = =
======================================
MY Comment, by KEN GRAUER, MD (10/12/2024 — Updated for WordPress on 3/17/2026):
I found today’s 2 ECGs remarkable for a number interesting findings — including the reasons why I thought acute OMI unlikely.
- For ease of comparison in Figure-1 — I’ve put both tracings in today’s case together.
= = =
Striking Features / Technical “Misadventures” in ECG #1:
Among the findings in today’s initial ECG that caught my “eye” — are the following:
- P wave morphology in ECG #1 is “off”. By this I mean that: i) The largest P wave is not in lead II (as it almost always is when the rhythm is sinus). Instead, the largest P wave is in lead III (BLUE arrow); — and, ii) The P wave is negative in lead I (PINK arrow) — which usually suggests either an ectopic atrial rhythm or some type of lead misplacement.
- There is extreme low voltage in the limb leads of ECG #1. More than this — there is almost a null vector in lead II, which when present — essentially guarantees lead reversal.
- There is significant baseline artifact in the limb leads (short vertical BLUE lines, especially in lead aVL).
- There is huge biphasic amplitude for the QRS complex in lead V3.
- There are giant T waves in leads V2,V3,V4 (T wave amplitude attaining 19 mm in lead V3! ).
- There is ST elevation in each of the chest leads (being especially marked in leads V2,V3,V4) — this being the reason that cardiac cath was done.
- There are large J waves (Osborn waves) — which are especially large in leads V4 and V5 (within the dotted RED ovals in these leads).
= = =
Figure-1: Comparison of the initial ECG — with the repeat ECG done 1 hour later. (To improve visualization — I’ve digitized the original ECG using PMcardio).

= = =
Not a STEMI:
Reasons I did not think ECG #1 represented an acute STEMI — included the following:
- There was no history of chest pain. Admittedly — this 91-year old man with underlying comorbidities was not clinically in condition to provide a history — but I thought the case sounded more the result of hypoxemia and/or neurological insult.
- The shape of the elevated ST segments in leads V2-thru-V5 is consistently upsloping (ie, “smiley”-configuration) — with a similar morphology in most chest leads.
- There is no reciprocal ST depression.
- As per Dr. Nicholson — there is no T-QRS-D (Terminal QRS Distortion). Rather than loss of both a J wave and S wave — there is a “slur” (J-point equivalent) in lead V2 of ECG #2 (See My Comment in the November 14, 2019 post for illustration of T-QRS-D).
- Although the T waves are huge in leads V2,V3,V4 — considering greatly increased QRS amplitude in these same leads (with overlapping R waves and S waves) — I was not convinced these T waves were disproportionate.
- I thought the ST-T waves in the chest leads “looked” more like a repolarization variant than like an acute MI.
- And there are prominent J waves …
= = =
About the J Waves:
We periodically review the occurrence and clinical significance of Osborn waves (See My Comment in the February 2, 2024 post of Dr. Smith’s ECG Blog for more on this topic — with illustration in that post of huge, diffuse Osborn waves).
- By way of review — the Osborn wave has been described as a deflection with a dome or hump that occurs at the point where the end of the QRS complex joins with the beginning of the ST segment. This is the J-Point (ie, it Joins the end of the QRS with the beginning of the ST segment) — so Osborn waves are really exaggerated J waves.
- Although commonly associated with hypothermia — other conditions have also been associated with Osborn waves, including CNS disorders and severe cardiac ischemia (potentially relevant considerations — given the impaired mental status and the ST elevation in today’s case).
QUESTION: When do J waves become “large enough” to be called Osborn waves in a non-hypothermic patient?
- While fully acknowledging that I continue to wonder about the answer to this question — I thought the J waves in leads V4,V5 (within the dotted RED ovals in ECG #1) qualified for Osborn wave designation.
- Looking ahead, at the bottom tracing in Figure-1 — the J waves within the dotted RED ovals in ECG #2 looked even larger than those in ECG #1 (in further support of Osborn wave designation).
- Qualitatively — I thought the prominent J-point notching, as well as the “slur” of the terminal QRS in lead V6 supported my impression of a repolarization variant rather than an acute MI (the “slur” serving as a J-point equivalent — as recently described in My Comment in the October 3, 2024 post).
= = =
Did YOU Recognize the Lead Reversal?
As alluded to earlier — the clues to lead reversal in ECG #1 include: i) P wave morphology is “off”; — and, ii) There is almost a null vector in lead II.
- My favorite on-line “Quick GO-TO” reference for the most common types of lead reversal comes from LITFL ( = Life-In-The-Fast-Lane). I have used the superb web page they post in their web site on this subject for years. It’s EASY to find — Simply put in, “LITFL Lead Reversal” in the Search bar — and the link comes up instantly.
- This LITFL web page describes the 7 most common lead reversals. There are other possibilities (ie, in which there may be misplacement of multiple leads) — but these are less common and more difficult to predict. (For a list of lead reversal cases we’ve discussed in Dr. Smith’s ECG Blog — CLICK HERE — for a LINK to the Menu that can be found on top of every page in Dr. Smith’s ECG Blog).
- As described on the LITFL site — the specific form of lead reversal in ECG #1 of today’s case is RA-RL Reversal. The effect of this lead reversal is that Einthoven’s Triangle is reduced to a very narrow triangle, with the practical result that the neutral electrode is moved in space (and as a result — limb lead orientations may be distorted).
= = =
NOTE:
I have excerpted from the LITFL site the effect RA-RL reversal will have on each of the limb leads (Look toward the bottom of Figure-1).
- Take another LOOK at Figure-1.
- ECG #2 was recorded ~1 hour after ECG #1. If each of the effects listed for RA-RL reversal were to occur on the 6 limb leads in ECG #2 — Wouldn’t the result look like the limb leads in ECG #1?
- Therefore — we can suspect that IF the limb lead electrodes had been correctly placed at the time that ECG #1 was recorded — that the largest upright P wave would have been seen in lead II — and that there would not have been a null vector in lead II.
- As a final point — LITFL notes that because the neutral electrode has been “moved” when there is RA-RL reversal — that precordial voltages may also be distorted. I believe this is the reason we see such an unusually large amplitude biphasic complex in lead V3 of ECG #1 (that is no longer seen in lead V3 of ECG #2).
= = =
= = =