A 50-something presented with left shoulder pain.
He had an ECG recorded:
What do you think?
= = =
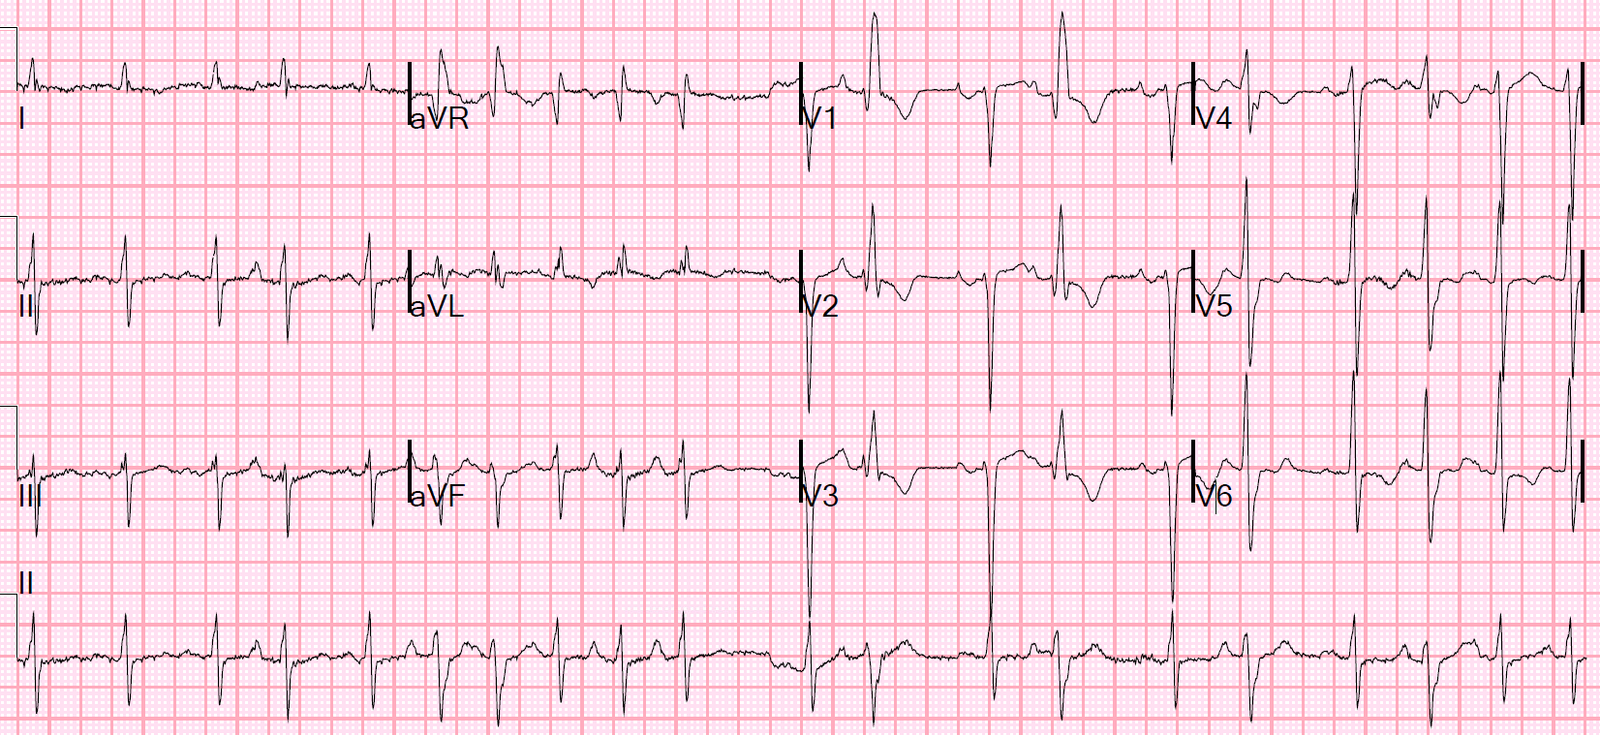
There is a huge amount of ST Elevation, but to my eye it was typical of normal variant. One might say there is terminal QRS distortion, but, although there is indeed absence of S-waves in BOTH V2 and V3, there is in fact very clear notching at the end of the QRS in both V2 and V3.
= = =
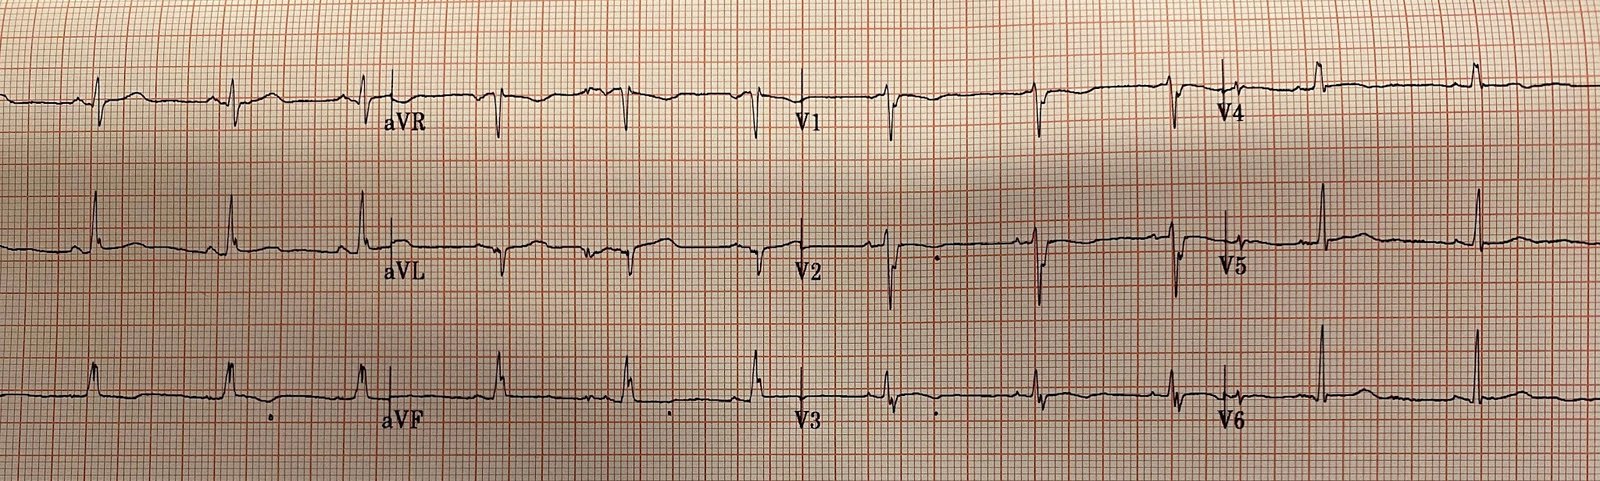
Fortunately, there was an ECG from about a year prior:

= = =
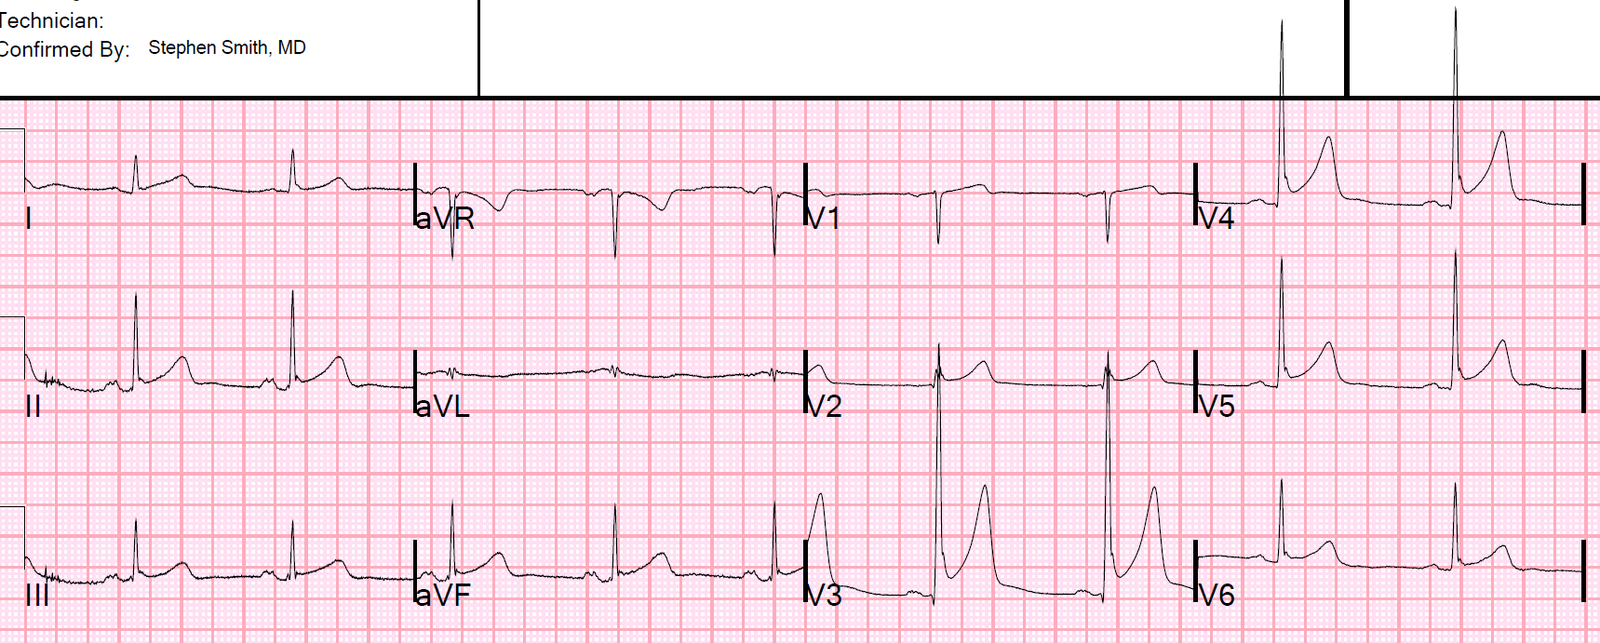
And here is one from about 10 years prior:

You can see here that the computer says, “suggest pericarditis” — but that I changed it to early repolarization.
Just because there is diffuse ST elevation does NOT mean it is pericarditis.
The most common etiology of diffuse ST elevations is, by far, early repolarization.
= = =
The patient had musculoskeletal pain.
= = =
======================================
MY Comment, by KEN GRAUER, MD (11/14/2019 — Updated for WordPress on 12/11/2025):
A subject well worth periodic review — is the concept of Terminal QRS Distortion (T-QRS-D). Prior to working with Dr. Stephen Smith — this concept was unknown to me. When present — T-QRS-D may provide invaluable assistance for distinguishing between early repolarization vs acute OMI (ie, When true T-QRS-D is present in a patient with new symptoms — it is virtually diagnostic of acute OMI). To review:
- T-QRS-D — is defined as the absence of both a J-wave and an S-wave in either lead V2 or lead V3 (and according to Drs. Smith and Meyers — probably also in lead V4). Although simple to define — this finding may be subtle! I fully acknowledge that it has taken me a while to become comfortable and confident in its recognition.
A picture is worth 1,000 words. I’ve taken the lead V3 examples in Figure-1 from previous cases posted on Dr. Smith’s ECG Blog:
- TOP in Figure-1 — Despite marked ST elevation in this lead V3 — this is not T-QRS-D, because there is well-defined J-point notching (BLUE arrow). This patient had a repolarization variant as the reason for ST elevation.
- BOTTOM in Figure-1 — This is T-QRS-D, because in this V3 lead there is no J-point notching — and, there is no S wave (RED arrow showing that the last QRS deflection never descends below the baseline).
= = =
Figure-1: Comparison between ST elevation in lead V3 due to a repolarization variant (TOP — from the April 27, 2019 post) — vs acute
OMI (BOTTOM — from the September 20, 2015 post), which manifests T-QRS-D (See text).

= = =
Regarding the current case — I have put together the first 2 ECGs that were shown above (Figure-2).
- Isn’t it tempting to say there is T-QRS-D in the initial ECG that was done in the ED ( = ECG #1 in Figure-2)? After all, there is no S wave in lead V3 …
= = =
Figure-2: The first 2 ECGs shown in today’s case (See text).

= = =
COMMENT on ECG #1:
The patient in this case was a 50-something man, who presented with left shoulder pain. As per Dr. Smith — there is marked ST elevation in lead V3 — with a lesser amount of ST elevation in inferior and lateral chest leads.
- The reason the ST-T wave appearance in lead V3 of ECG #1 does not qualify as T-QRS-D — is that despite lack of an S wave in this lead, there is J-point notching (or at least J-point slurring) that is
characteristic of repolarization variants. - Other ECG features in ECG #1 in favor of a repolarization variant instead of acute OMI include: i) A relatively short QTc interval and
tall R waves in the mid-chest leads; — ii) Lack of reciprocal ST depression; — iii)A similar “look” to the peaked T waves that we see in at least 9 of the 12 leads in ECG #1 (compared to a more localized ST-T wave picture that is typical with acute infarction); — and, iv) J-point notching or slurring that is typical for repolarization variants in no less than 7 of the 12 leads in ECG #1 (BLUE arrows in Figure-1).
BOTTOM Line: While the composite of the above features makes it more likely that ECG #1 does not reflect acute OMI — there nevertheless is a significant amount of ST elevation in multiple leads in this 50-something man who presented with new symptoms.
- Therefore — moreinformation was needed to attain greater certainty (ie, stat Echo looking for wall motion abnormality; additional ECGs on this patient; serial troponins).
- In this case — finding a prior ECG on this patient from a year earlier was revealing (ECG #2 in Figure-2). Neither the lack of S wave in lead V3, nor J-point notching or slurring were new findings (RED arrows in ECG #2). This confirmed the impression that the ST-T wave appearance in ECG #1 reflected a longterm repolarization variant in this patient.
- P.S.: Given that there is a very small-but-present percentage of lethal cardiac arrhythmic events in otherwise healthy young adut individuals who have repolarization variants — I no longer use the term, “BER” (Benign Early Repolarization) when I see this type of ECG finding (Zakka & Refaat-ACC, 2016). Instead, I simply call it “repolarization variant” — because this ECG finding is usually, but not 100% “benign”. If a patient with the ECG findings in ECG #1 presented with new, cardiac-sounding syncope — full evaluation would be in order.
Our THANKS to Dr. Smith for presenting this case!
- For additional examples illustrating distinction between T-QRS-D vs repolarization variants — Review of the October 6, 2015 post may prove insightful.
= = =
= = =