Sent by anonymous
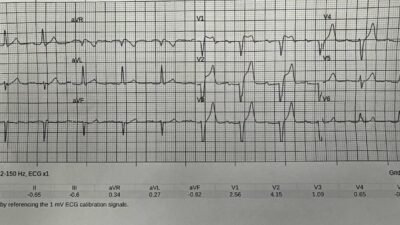
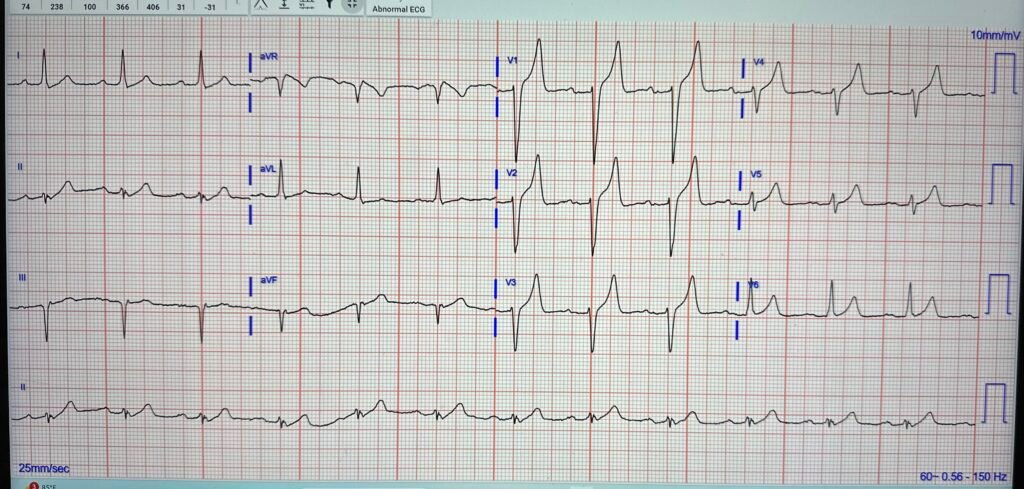
A man in his 70s with history of hypertension experienced 5 days of worsening generalized weakness and suffered a near-syncopal event. His family called EMS, who found him diaphoretic and ill appearing. Here is his EMS ECG:
The Zoll computer algorithm stated: “***STEMI***”
What do you think?
Unfortunately the EMS transmitted ECG has severely restrictive voltage cutoffs, not allowing us to see the entire QRS. There is STE in V1-V3, but no QRS context in which to judge them. The T waves in V3-V4 look either hyperkalemic or possibly hyperacute to me. The differential is acute coronary occlusion vs. hyperkalemia, less likely just LVH associated abnormal repolarization findings.
Smith: this was sent to mewith no information and I replied that I thought it would be OMI. I did not notice the S-wave cutoff. Pendell immediately responded with hyperkalemia — I did not see that.
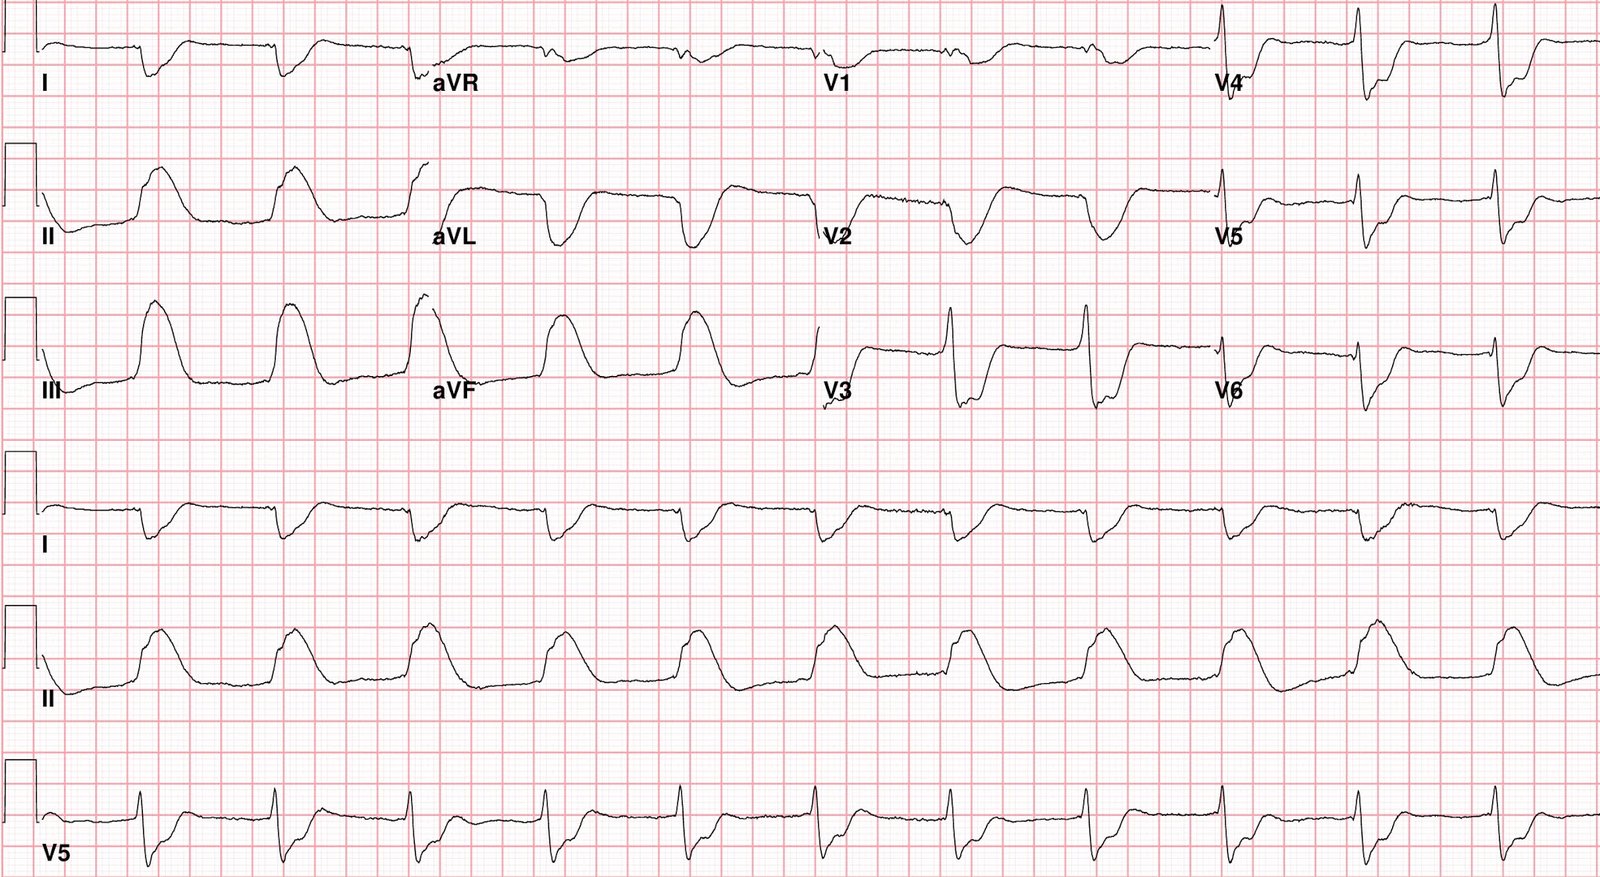
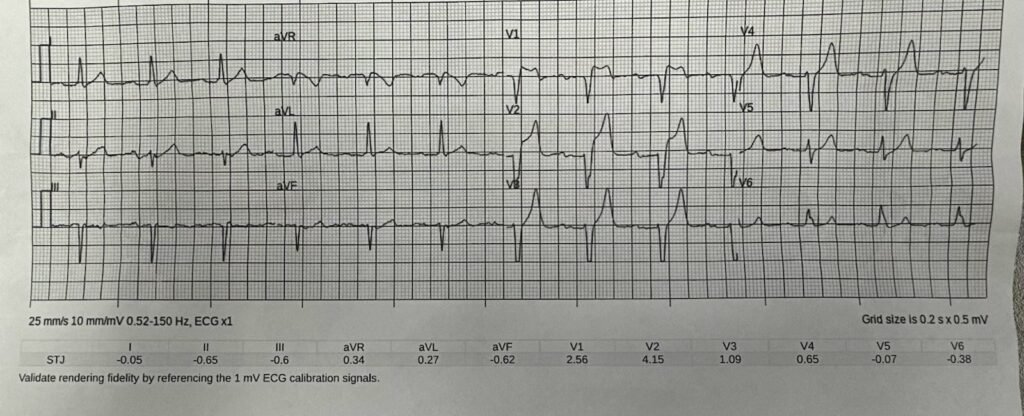
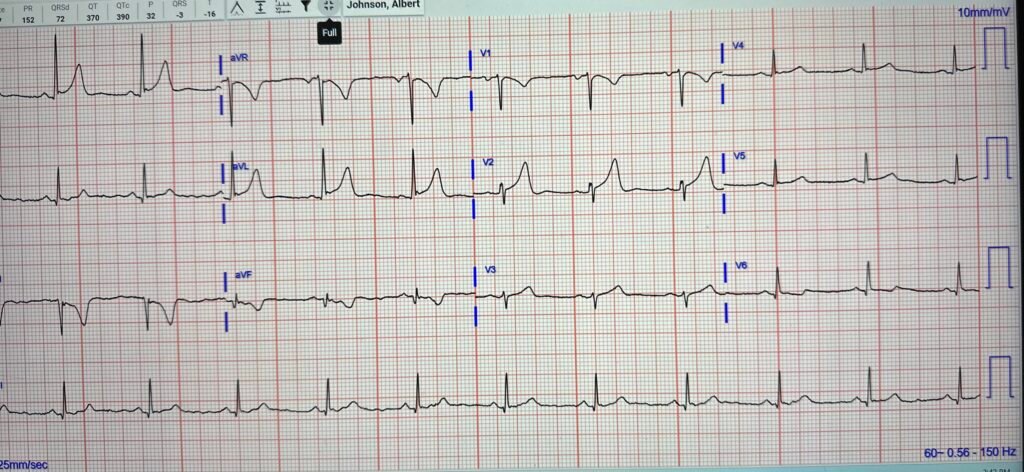
On arrival to the ED, here was the full ECG:
Now we have full QRS visible, and (as almost always I find) there are a lot of differences between the EMS ECG and the ED ECG. There is less STE, and more T waves have a hyperkalemic peaked appearance to me.
Smith: clearly not OMI now
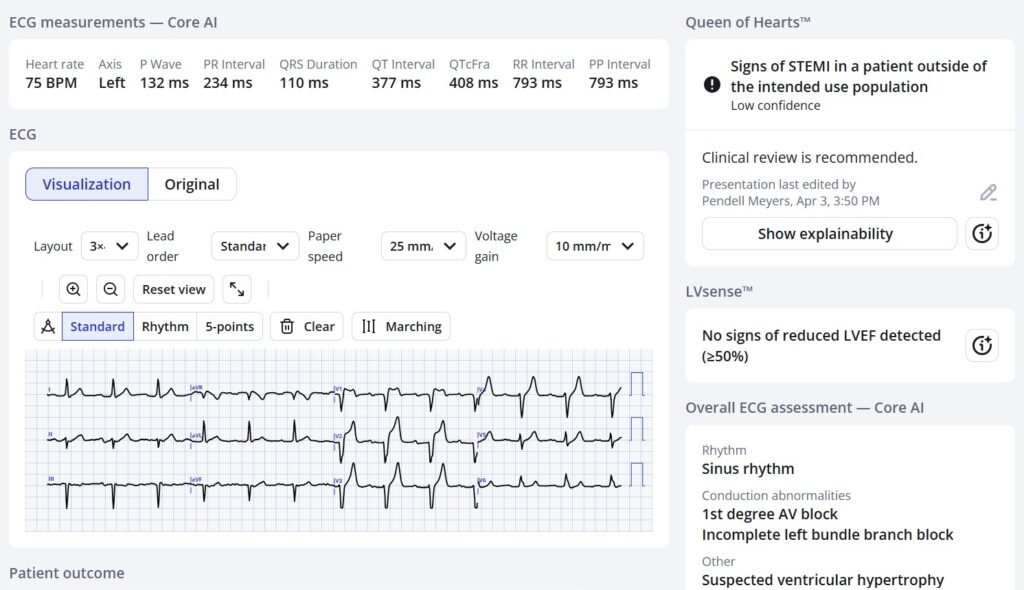
Like humans, the AI model is also at a disadvantage due to the EMS ECG voltage cutoff, and, because the Queen of Hearts uses the entire QRST including the critical findings of Proportionality, this S-wave cutoff leads to a false positive reading (though weakness without suspicion of ACS is of course not the intended use population):
Here the PMCardio Queen of Hearts AI ECG Model assesses the ED ECG, which does not have the S-wave cutoff:
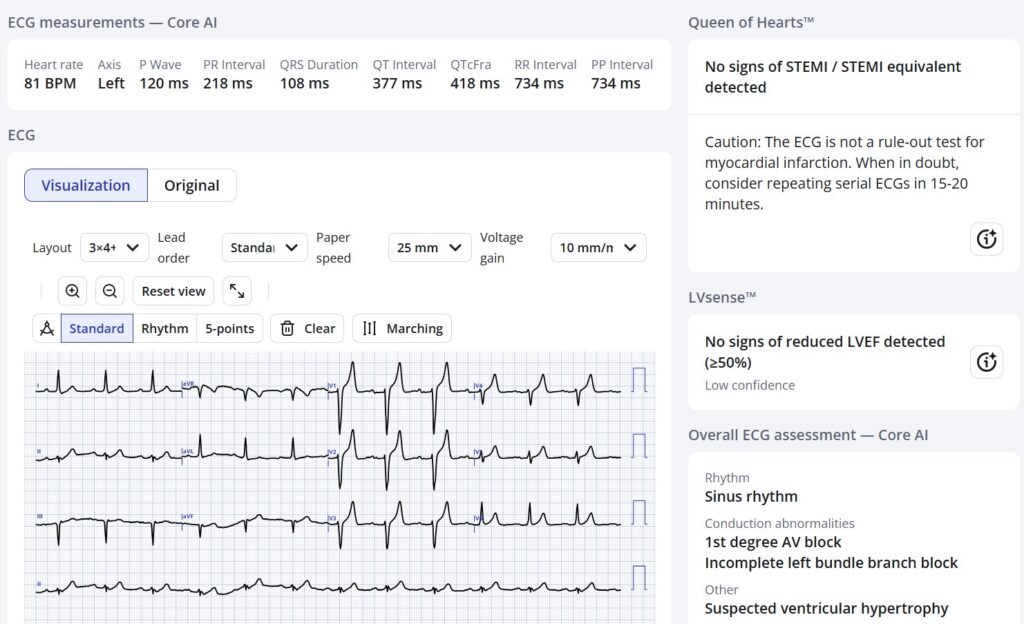
This time she sees that the ST Elevation and T-wave are not out of proportion to the S-wave (there is also some decrease in the ST Elevation in V2)
New PMcardio for Individuals App 3.0 now includes the latest Queen of Hearts model and AI explainability (blue heatmaps)! Available in the EU — Download now for iOS or Android. https://www.powerfulmedical.com/pmcardio-individuals/ Hopefully will get FDA approval soon for American users. (Drs. Smith and Meyers trained the AI Model and are shareholders in Powerful Medical). As a member of our community, you can use the code DRSMITH20 to get an exclusive 20% off your first year of the annual subscription. Disclaimer: Certain AI ECG Modules are CE-marked medical devices under EU MDR and are certified for marketing only in the European Union and the United Kingdom. PMcardio technology has not yet been cleared by the US Food and Drug Administration (FDA) for clinical use in the USA.
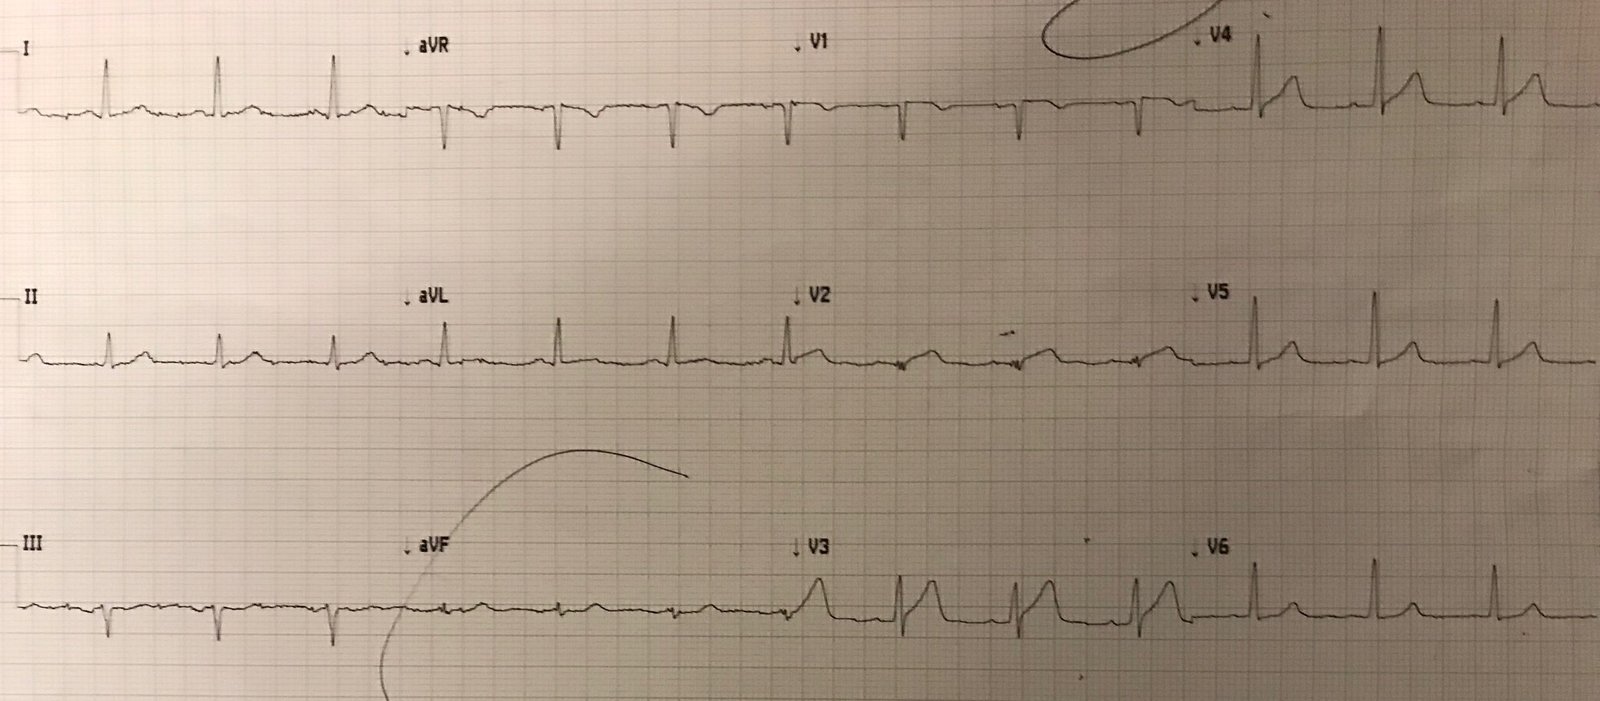
An old ECG was available in the EMR:
The physician had initially activated a code STEMI based on the EMS ECG. The cardiologist cancelled the code STEMI.
Point of care testing revealed a potassium of 9.1 mEq/L.
Hyperkalemia was emergently and successfully treated.
It is helpful to know that the most common symptom of hyperkalemia is “weakness”.
= = =
======================================
MY Comment, by KEN GRAUER, MD (4/5/2026):
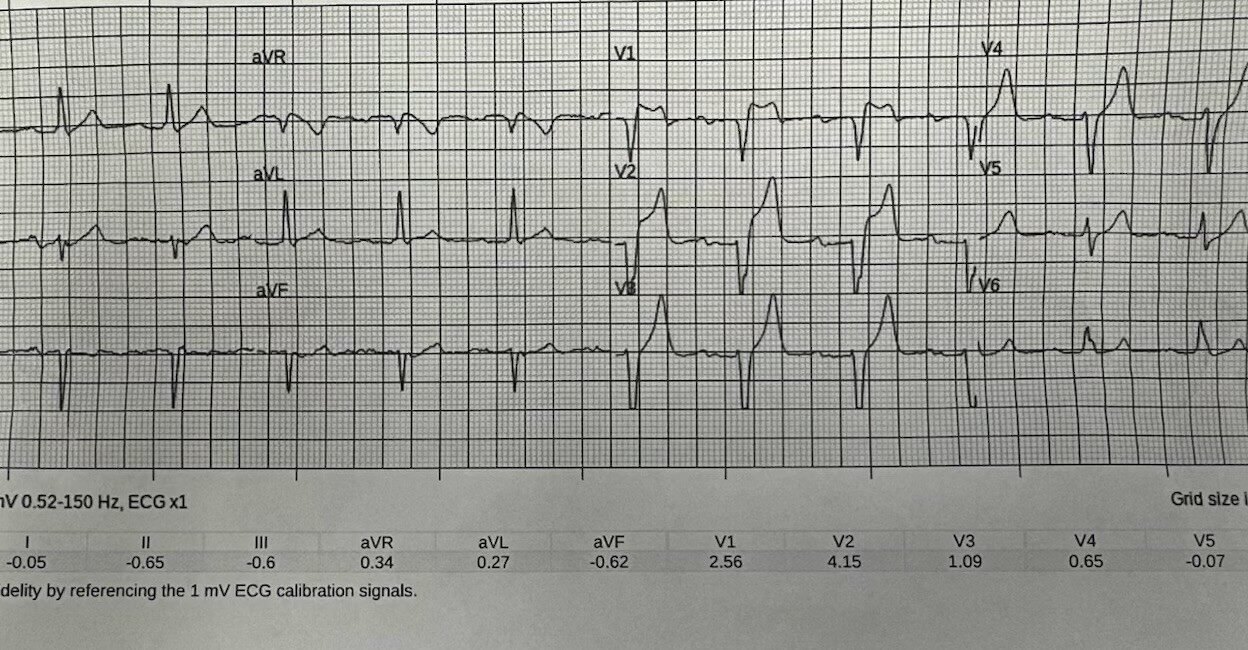
As per Dr. Meyers — today’s initial ECG is remarkable for the very tall, symmetric T waves in leads V2,V3,V4 — that present us with the differential diagnosis of hyperkalemia vs hyperacute T waves from acute LAD occlusion.
- I’ll add to this consideration of a transient superimposed Brugada Phenocopy pattern in leads V1 and V2 of the initial tracing.
= = =
Today’s Initial ECG . . .
To facilitate discussion in Figure-1 — I’ve labeled several interesting features of today’s initial tracing.
- As per Dr. Meyers — there is a limit to the amount of voltage that prehospital ECGs in most EMS systems are able to display. As a result — QRS amplitudes in these ECGs are automatically truncated once they exceed that limit (which appears to be 10 mm for the deepest S wave and tallest T wave in today’s tracings).
- It’s important to be aware of this automatic truncation effect so commonly seen in EMS ECGs — because one might otherwise misinterpret these seemingly “large” ST-T waves as disproportionate to a short S wave, and therefore presume this to represent a hyperacute T wave (Please see My Comment at the bottom of the page in the June 20, 2020 — the February 6, 2020 — and November 14, 2023 posts among others in Dr. Smith’s ECG Blog).
KEY Point: As per Dr. Meyers — QOH is at the disadvantage of often not being able to detect the subtle “cut-off” of this automatic truncation (dotted RED lines in leads V2,V3,V4 in Figure-1).
- As helpful as QOH (Queen-Of-Hearts) may be for assessment of acute OMIs — human oversight is essential in our interpretation of tracings to ensure that “technical misadventures” (like this automatic truncation effect in prehospital ECGs) do not pass unnoticed by QOH.
= = =
Figure-1: I suspect leads V1,V2 reflect superposition of Brugada Phenocopy (from hyperkalemia) onto hyperkalemic T waves.
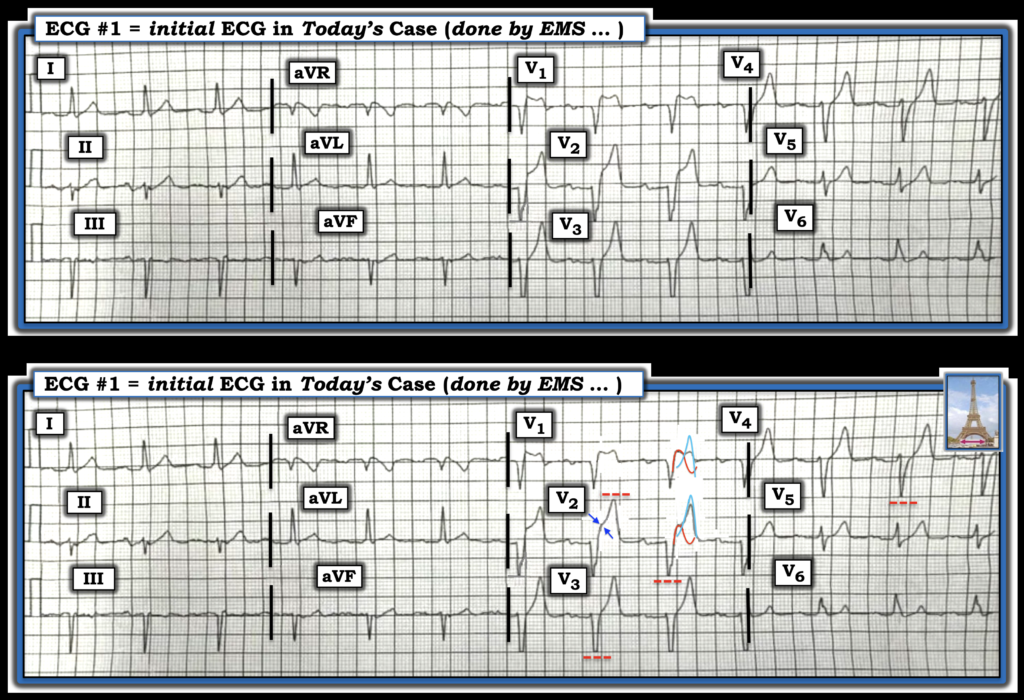
Explanation of Figure-1: Hyperkalemic T waves may produce tall, slender symmetric T waves with a narrow base (Eiffel Tower effect).
- My attention was immediately drawn to the unusual appearance of an elevated J-point “shoulder” (suggesting J-point ST elevation in leads V1 and V2, but not in lead V3 in ECG #1). This produces the unusual “double hump” in lead V1 that differs from the usual undisturbed downsloping ST segment of a Brugada-1 pattern.
- In the bottom tracing of Figure-1 — I’ve outlined in RED what I suspect would be the effect of a Brugada-1 pattern superimposed on hyperkalemic T waves in leads V1,V2 (shown in BLUE). This superposition of the Brugada-1 pattern in lead V2 could produce the J-point ST elevation that we see in this lead (double BLUE arrows).
- As is often the case — a Brugada-1 pattern may be seen in leads V1 and V2, but not in other chest leads.
= = =
The Serial ECGs in Today’s Case …
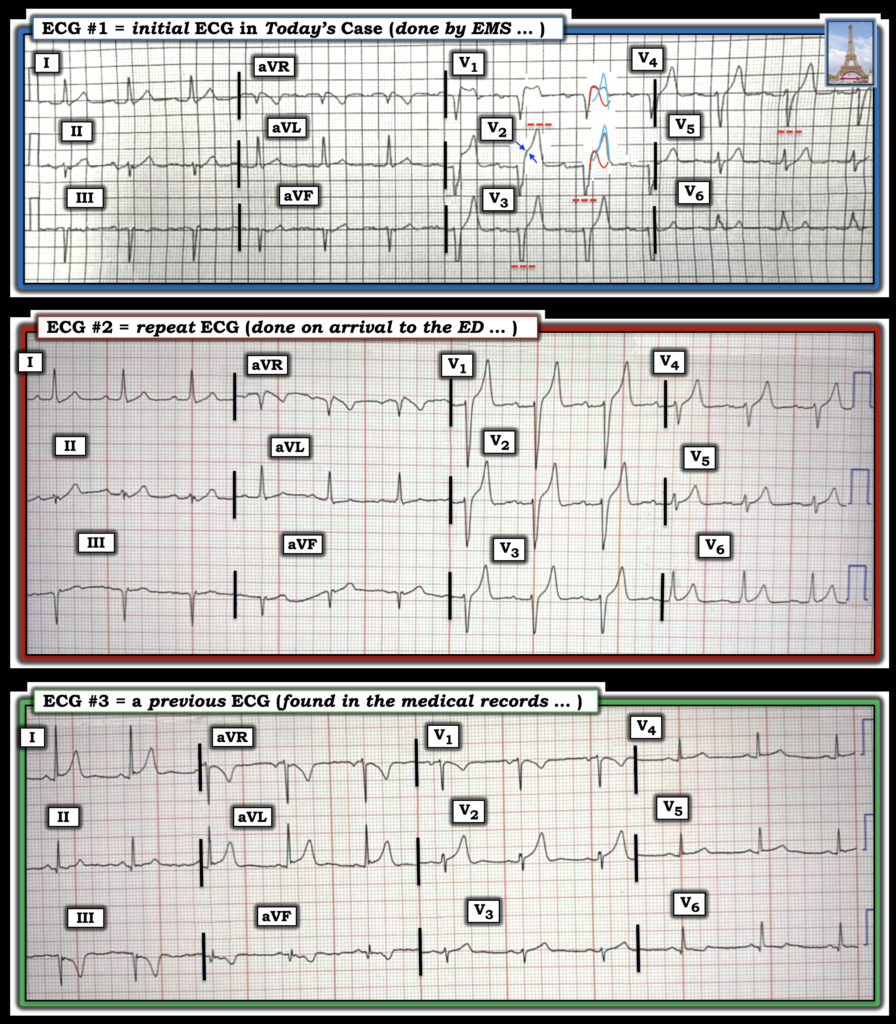
To facilitate serial assessment of today’s ECGs in Figure-2 — I’ve put all 3 tracings together.
- A bit later (after EMS arrival in the ED) — a repeat ECG was obtained. The very tall, slender T waves that now begin in lead V1 of ECG #2 are at this time more suggestive of hyperkalemia than hyperacute T waves in this patient who was not complaining of chest pain (and as per Dr. Meyers — serum K+ = 9.1 mEq/L).
- Note that this repeat ECG #2 (that was performed in the ED) no longer manifests the automatic truncation effect, such that we see the full amplitude of the deep S waves.
- Note also that the “shoulder” of J-point ST elevation that was seen in leads V1,V2 of ECG #1 is no longer present in ECG #2!
KEY Point: The previous ECG that was found in this patient’s records proves that that most of the ST-T wave abnormalities that we see in ECGs #1 and #2 are new. But this previous ECG #3 is not “normal”!
- By far, the most abnormal lead in ECG #3 is lead V2, which shows a clearly disproportionate ST-T wave with tall, peaked T wave!
- In addition — I thought the T waves in leads I and aVL were both more peaked than is usually seen — with the negative T wave peaking in leads III and aVF clearly abnormal.
- To Emphasize: Finding previous ECGs on our patients can be invaluable for confirming that ST-T wave changes on the current tracing are new. But it’s important to try to correlate prior tracings to ongoing clinical circumstance at the time that the prior tracing was obtained! For example, in ECG #3 — I suspect that the reason for the abnormality in multiple ST-T waves (although clearly much less than that seen in ECGs #1 and #2) — may have been the result of some residual hyperkalemia from a previous episode of high serum K+.
- Editorial Comment: I vividly recall an elderly compromised patient in our practice who had frequent recurrent episodes of hyperkalemia that were regularly precipitated by dehydration. As the faculty who read all of our clinic ECGs over my 30 years in academia — I’d be able to instantly recognize another episode of developing dehydration from new T wave peaking on this patient’s ECGs. Perhaps the 70’s man in today’s case was also a patient subject to recurrent hyperkalemic episodes (a theory I’d be curious to explore on review of this patient’s previous medical admissions).
= = =
Figure-2: The 3 ECGs in today’s case.
= = =
= = =