An elderly man with a history of diabetes and HTN presented with lethargy and weakness, decreased urine output, and hypotension. There was no history of any GI bleeding or other hemorrhage. There was no fever.
He had no CP or SOB, and it was unknown if there was a previous history of atrial fibrillation. He was on atenolol, but it was not known if this was simply for hypertension, or for atrial fib.
He was not anti-coagulated.
Blood pressures ranged from 83/45 to 125/83, lower than usual. HR ranged from 110 to 145.
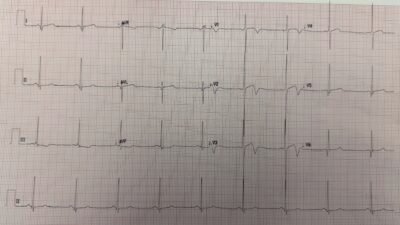
He had an ECG recorded upon arrival:
What do you think?
= = =
There is atrial fibrillation with a rapid ventricular response (rate of approximately 120). There are aberrantly conducted beats (Ashmann’s phenomenon–see Ken’s analysis below), which are easily confused with PVC couplets. There is ST depression in V2-6 that is clearly ischemic.
Is it OMI?
The ischemia on the ECG could be of several possible etiologies:
- New or Old Atrial fibrillation with posterior OMI.
- New atrial fib with RVR causing demand ischemia (but the rate is not terribly fast).
- Old atrial fib with poor rate control causing demand ischemia.
- OMI or ACS causing Subendocardial ischemia with possible additional ischemia from atrial fib with RVR
- Hemorrhage/dehydration/sepsis/etc., with new or old atrial fib, resulting in reflexive tachycardia and demand ischemia.
PEARL from Smith: although ST depression maximal in V1-4 is extremely specific for acute OMI, in the presence of atrial fibrillation with RVR it is NOT!!
Does the PMCardio Queen of Hearts know whether it is OMI or not?= =

She thinks it is not. That is very interesting. She understands that in the context of atrial fibrillation with RVR (tachycardia), ST depression in V1-V4 is most likely subendocardial ischemia.
As you will see below, this turned out to NOT be OMI, but rather it was supply demand subendocardial ischemia. The Queen is very good at detecting mimics, as this paper shows. In this study, she decreased false positive activations from 42% to 8%!! All the while diagnosing true OMI on 92% of first ECGs, compared to 71% for the standard of care.
PMcardio for Individuals now includes the latest Queen of Hearts model, AI explainability (blue heatmaps), and %LV Ejection Fraction. Download now for iOS or Android: https://individuals.pmcardio.com/app/promo?code=DRSMITH20. As a member of our community, you can use the code DRSMITH20 to get an exclusive 20% off your first year of the annual subscription. Disclaimer: PMcardio is CE-certified for marketing in the European Union and the United Kingdom. PMcardio technology has not yet been cleared by the US Food and Drug Administration (FDA) for clinical use in the USA.
Case Continued
To find the answer, it is wise to assess volume status, which can be done with ultrasound:
A bedside ultrasound was done from the subcostal view, concentrating on the IVC. If this is due to etiologies 1-4, one would expect a full IVC. If etiology 5, then one expects a flat and/or collapsing IVC:
This shows a collapsing inferior vena cava (IVC), consistent with volume depletion
Another with a better view of the heart. RV is on upper part of the view, next the liver:
RV is quite small. LV is also small and has reasonably good contractility. This supports volume depletion.
The appropriate therapy would be fluids and further workup for hemorrhage/dehydration/sepsis/etc.
However, BOTH an esmolol bolus and drip, and IV fluids were started.
But beta blockade should NOT be given, at least not yet. In a volume depleted state, this patient needs the reflexive tachycardia for cardiac output.
By the time I arrived and was involved, the esmolol had not been at a high enough dose to do any harm.
His lactate returned as 3.3 mEq/L and first troponin at 0.139 ng/mL. I was quite certain that this was a type II (demand ischemia) MI and that this patient was not having ACS.
I assume that cardioversion was appropriately not done because the risk of thromboembolism, but other reasons not to do it are: 2) if the patient is in chronic atrial fib, it is unlikely to work and 3) the etiology of mild shock is NOT the atrial fib with RVR, but some other illness that can be at least partly alleviated with IV fluids.
I stopped the esmolol and gave the patient 2 liters of fluid. After fluids, the IVC was less collapsing:
The volume status is now better, at least relatively. It still may not be enough: when patients are in atrial fib, they usually need higher filling pressures for good cardiac output, so some IVC fullness would be good, as long as it does not lead to pulmonary edema, best evaluated with B-lines.
There were no B-lines.
But the patient monitor then showed a regular tachycardia without any P-waves. In other words, there was spontaneous conversion out of atrial fib to a regular narrow complex rhythm. The rate was very constant at 140 and so I wondered if this was SVT or sinus tach. Another 12-lead ECG was recorded:
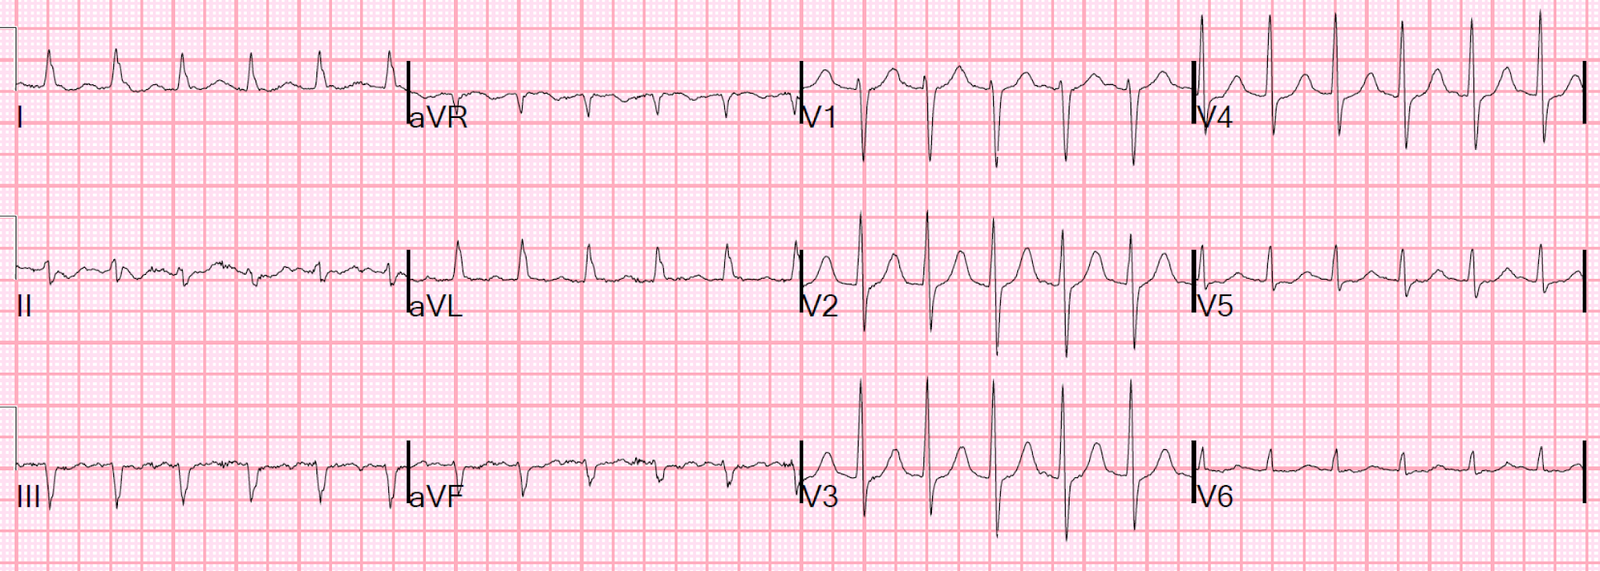
Now there is a regular supraventricular rhythm. There are probable P-waves, but I wasn’t entirely certain.
What to do?
Lewis leads.
= = =
I went into the patient’s room, and, according to the instructions on LifeintheFastLane, I changed the monitor leads around (this is not a 12-lead!)
- Right Arm (RA) electrode on manubrium
- Left Arm (LA) electrode over 5th ICS, right sternal border.
- Left Leg (LL) electrode over right lower costal margin.
- Right Leg (RL) electrode in standard position on right leg
- Monitor Lead I or II
I printed out the monitor strip. This is what I recorded:
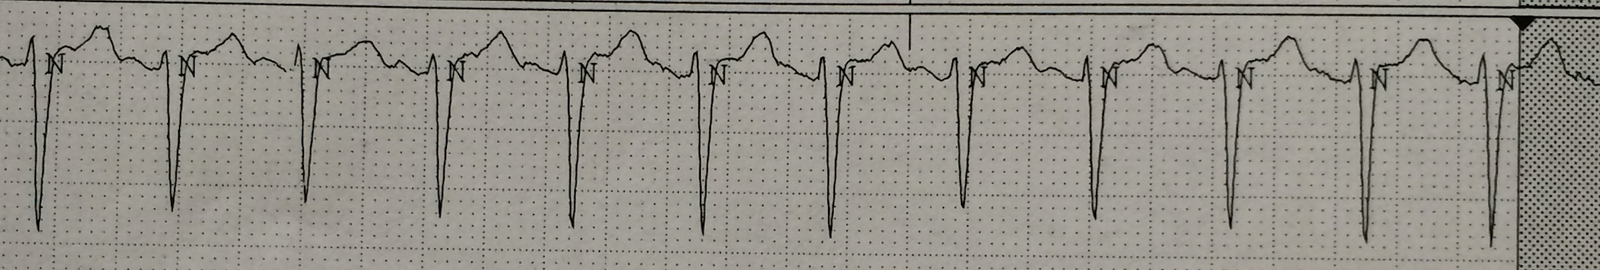
Now the P-waves are obvious.
= = =So the patient now has sinus tachycardia.
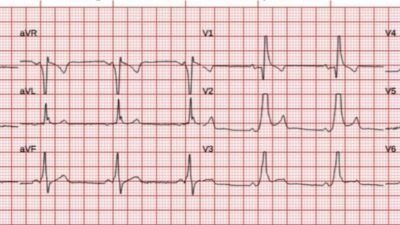
I gave more fluids and the heart rate came down. Here is the next ECG:
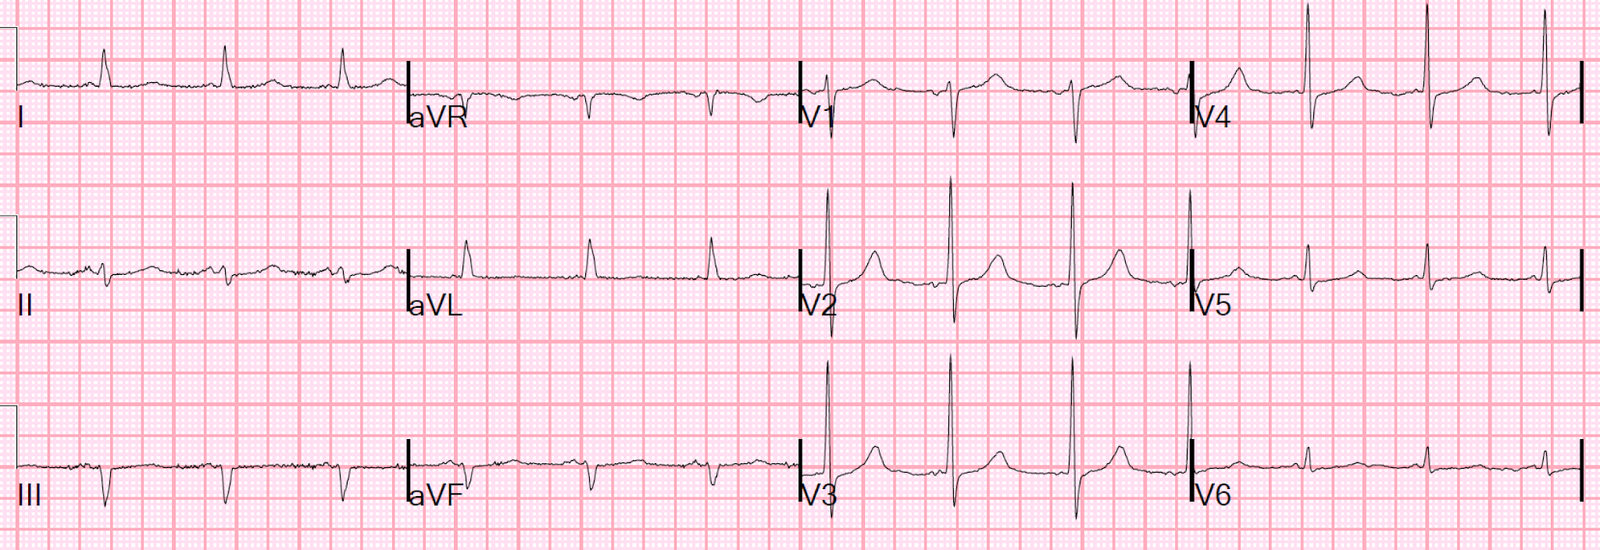
Normal.
= = =
Later, the second troponin I returned at 0.562 ng/mL. When the third returned, it was 2.165 ng/mL.
He developed a fever and urine showed WBC’s. He was treated for urosepsis and did well. He did not have ACS.
Learning Points:
1. Not all myocardial infarction is due to ACS. This was a Type 2 MI. See here for a recent Delphi article on Type 2 MI.
2. Subendocardial supply demand ischemia in the setting of AF with RVR may be maximal in V1-V4
2. Atrial fibrillation with RVR may be a consequence, not a cause of, illness
3. Volume status is critical in the management of Atrial fibrillation with RVR
4. If you are not certain of a source of SVT, do Lewis leads.
= = =
=====================================
MY Comment, by KEN GRAUER, MD (11/23/2025):
I found today’s case a masterful demonstration by Dr. Smith of the following attributes:
- — i) Optimal ECG interpretation (ie, No acute OMI — but rather DSI = Diffuse Subendocardial Ischemia);
- — ii) Clinical correlation (The history being much more suggestive sepsis/dehydration — without any chest pain to suggest recent MI );
- — iii) Astute use of diagnostic modalities readily available to emergency physicians, albeit all-too-often not thought of (ie, Bedside Echo to confirm volume depletion as a major problem, and potential precipitant of AFib — and then application of a Lewis Lead to confirm sinus rhythm after treatment, but with the regular ECG too equivocal to allow identification of P waves);
- — iv) Moment-to-moment follow-up of the patient to test your clinical deductions and ensure that your treatment is working (with confirmation that there was no acute coronary occusion — but instead that treatment of volume depletion and urosepsis was sufficient for patient improvement and restoration of sinus rhythm).
= = =
I focus My Comment on a few additional points regarding the initial ECG:
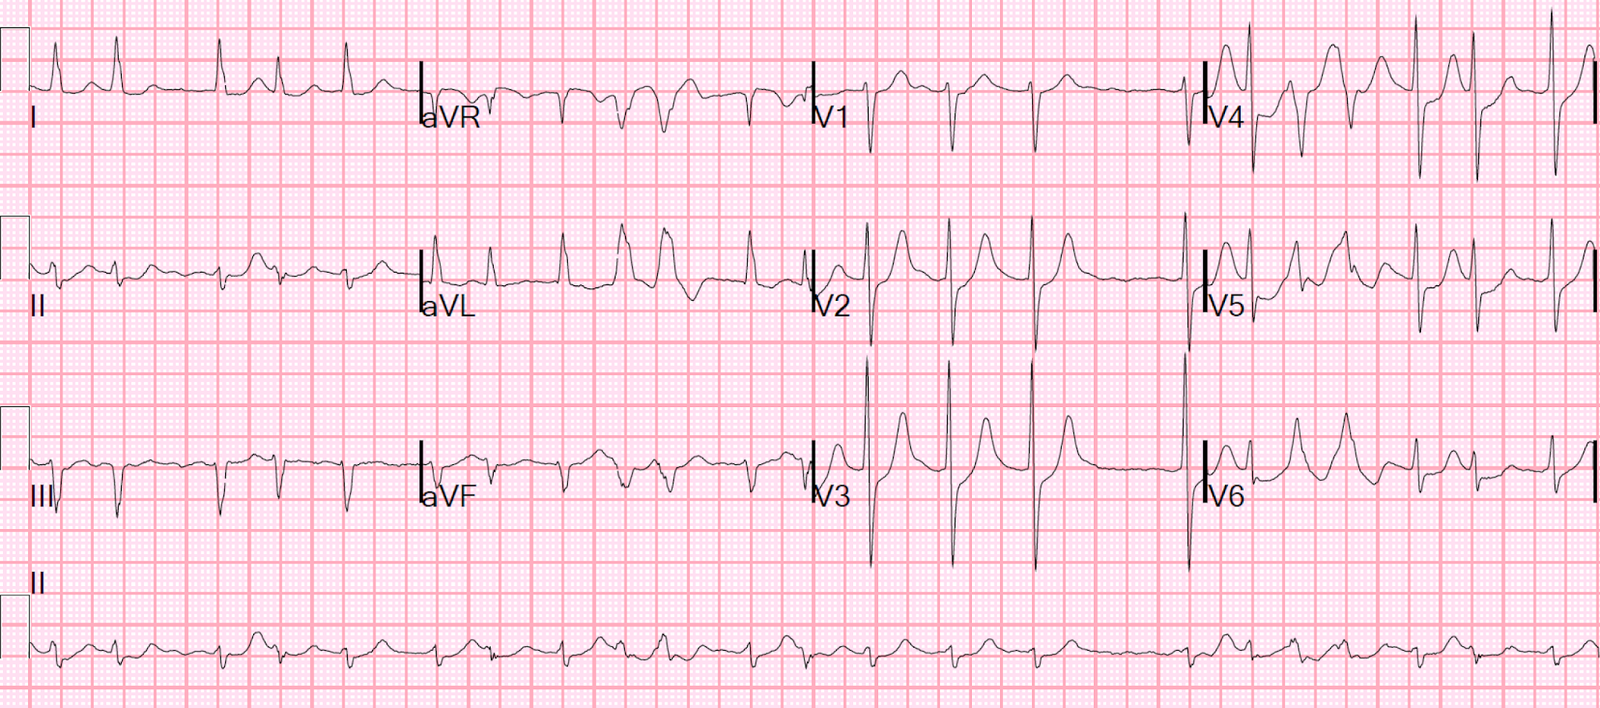
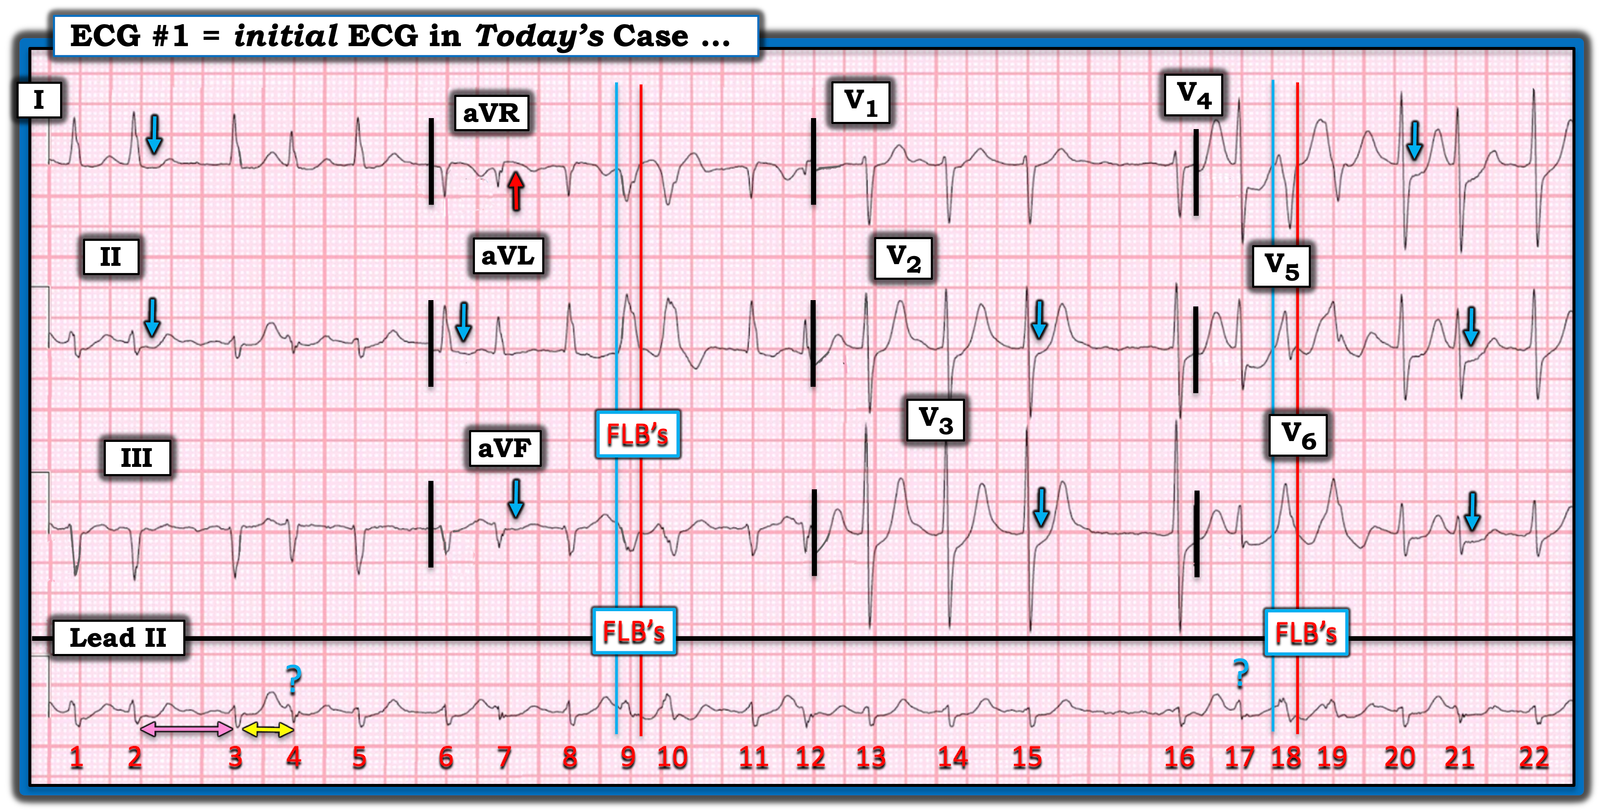
- For clarity in Figure-1 — I’ve reproduced and have labeled today’s initial ECG.
- I’ve added an ADDENDUM below with brief review on the concept of aberrant conduction and illustration for Lewis Lead placement.
= = =
Today’s Initial ECG:
As per Dr. Smith — today’s initial ECG shows AFib with a moderately rapid ventricular response.
- And, as per Dr. Smith — there clearly is ischemia, with ST depression in 9 leads (BLUE arrows in Figure-1) — with subtle ST elevation in lead aVR (RED arrow). As emphasized often in Dr. Smith’s ECG Blog (See My Comment in the July 25, 2024 post) — this combination of diffuse ST depression with ST elevation in aVR is most conveniently classified as DSI (Diffuse Subendocardial Ischemia) — which practically speaking means either: i) Severe underlying coronary disease (but most often not acute coronary occlusion); — ii) “Something else” (ie, a sustained tachycardia; shock; profound hypotension; GI bleeding; septicemia; anemia; etc.); — or — i) and ii) together.
- Mechanisms by which AFib may precipitate DSI include: i) Loss of the “atrial kick” (which may account for between 5-40% of cardiac output) — with this effect being especially impactful if the onset of AFib is new; — and; ii) The rapid rate of new AFib, which disproportionately shortens the period of diastolic filling (thereby greatly reducing cardiac output) — with this effect especially impactful if associated with hypovolemia or acute MI.
= = =
Are the FLB’s aberrantly conducted or PVCs?
I’ve labeled beats #9,10 and #18,19 in Figure-1 as FLB’s (Funny-Looking Beats) — because in this AFib rhythm, these 4 beats are wide and clearly look different than the underlying normally conducted QRS complexes (That these FLBs are truly different from the other QRS complexes is best seen by looking at simultaneously-recorded leads aVR,aVL,aVF; and V5,V6).
- To Emphasize: Whether beats #9,10 and #18,19 are PVCs or aberrantly conducted supraventricular complexes is admittedly academic — with the “good news” being that regardless of what the etiology of these beats is, they do not need to be treated, and they will probably go away once this patient’s hypovolemia and septicemia are treated, and once the heart rate slows. That said — it’s worth discussing assessment of these FLB’s in the setting of AFib, since a longer run of FLB’s might simulate VT.
- Assessment of wide beats in association with AFib is often challenging because we don’t see P waves. While true that the rapid rate of new AFib predisposes to aberrant conduction — the occurrence in similar-looking pairs to me suggests that they are more likely to be ventricular couplets.
- To facilitate defining the beginning and end of the QRS for these FLB’s — I added vertical time lines (the BLUE lines for the beginning of the QRS — and the RED lines for the end of the QRS). The all upright R wave in lateral leads aVL and V6 with predominantly negative QRS in lead V4 could be consistent with LBBB aberration.
- That said — cycle-sequence comparison is inconsistent for aberrant conduction. The concept is that aberrant conduction results when early beats occur during the RRP (Relative Refractory Period). The shorter the coupling interval (double YELLOW arrow) — the greater the chance that an early supraventricular impulse will fall within the RRP and be conducted with aberration. The longer the preceding R-R interval (double PINK arrow) — the more the RRP of the next beat will be prolonged (This is the Ashman phenomenon — which I address in the ADDENDUM, and discuss in detail in the Sept. 16, 2024 post).
- Against aberrant conduction in Figure-1 — are the beats with the BLUE question marks — since, if beats #9,10 and #18,19 are aberrantly conducted supraventricular impulses — then beats #4 and #17 should also have been conducted with aberrancy given their cycle-sequence features.
- BOTTOM Line: I don’t think we can conclude whether the FLB’s in Figure-1 are PVCs or aberrantly conducted — in which case I favor the default of assuming them to be ventricular couplets. But as stated above in my 1st bullet — these beats do not need to be treated — and these FLB’s will probably go away once this patient’s underlying problems can be addressed (Please check out my 5-minute ECG Video on aberrant conduction in the ADDENDUM below).
= = =
Figure-1: I’ve reproduced and labeled today’s initial ECG.
= = =
= = =
ADDENDUM:
1) The “Whys” of Aberrant Conduction:
- In this 4:45 Minutes video (63 MB- mp4) — I review WHY some early beats and some SVT rhythms are conducted with Aberration (and why the most common form of aberrant conduction manifests RBBB morphology).
- NOTE: In addition to QRS morphology and the coupling interval of early beats — is the effect of the R-R interval preceding the wide beat (which with bradycardia, predisposes to aberrant conduction by prolonging the refractory period of the next beat). I review this important additional concept with my user-friendly approach to the Ashman phenomenon (See My Comment at the bottom of the page in the September 16, 2024 post in Dr. Smith’s ECG Blog).
= = =
2) Regarding Lewis Lead Configurations:
Over the years there have been multiple versions of “the Lewis Lead”. The original version was put forth by Sir Thomas Lewis in 1931 — when he was looking for the best way to view atrial activity during atrial flutter (Beuscher — FOAMfrat, 4/19/2018).
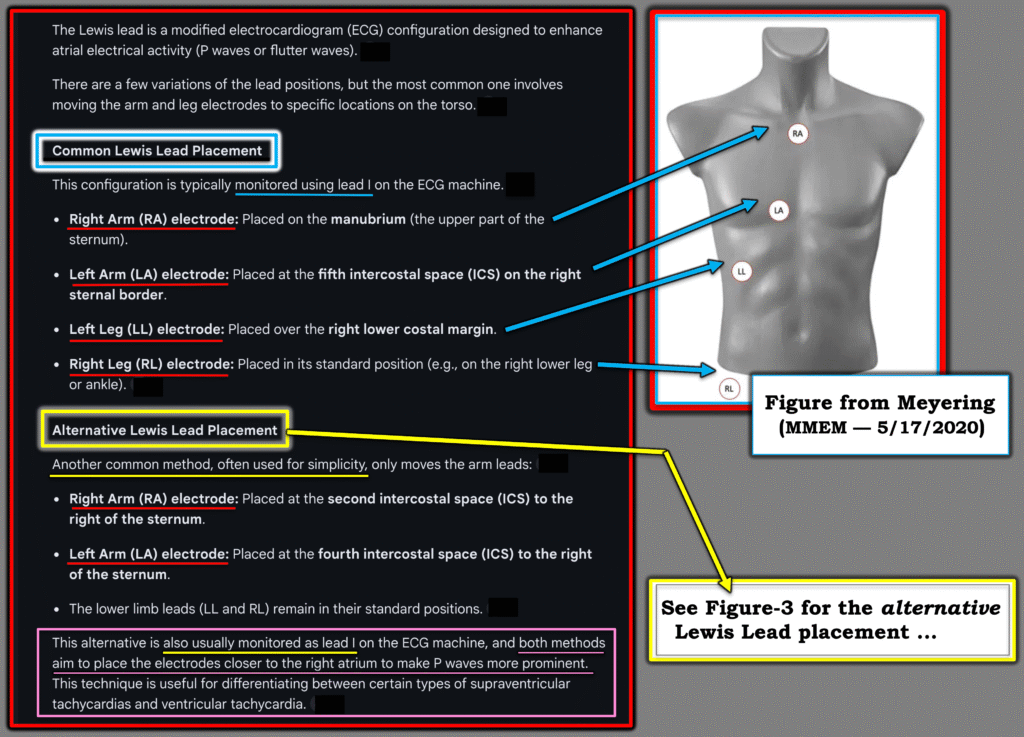
- In Figure-2 — I show the 2 most common among many versions that I saw referenced on the internet (Meyering — MMEM, 5/17/2020). I’ll add that each time I asked AI for its “answer” — the placements I received would differ slightly.
- The alternative Lewis Lead Placement (which is the method I cited for years) — is actually the original lead placement described in 1931 by Lewis (Illustration below in Figure-3 — as well as in YELLOW in Figure-2).
- The common Lewis Lead Placement (in BLUE in Figure-2) — appears to have become the most frequently used method in recent years. It is often described as “the S5 Lead” (as advocated by Marriott).
Final Thoughts: You have more than one option for anatomic placement when attempting a Lewis lead. I don’t know if any one placement is superior to any other (It probably depends on the patient).
- The alternative Lewis Lead Placement (as shown in Figure-3) is simplest — because you only need to adjust the RA and LA electrodes.
- The goal of any of these placements is to try to maximize the size of atrial activity on your recorded tracing. The “result” of your Lewis Lead placement is viewed in Lead I — which records the electrical difference between the LA and RA electrodes. In your mind’s eye (as you look at the pictures of the chest in Figures-2 and -3) — We can imagine the electrical difference between LA and RA electrodes as attempting as much as possible, to isolate the recording of atrial activity that anatomically lies beneath these 2 electrodes.
- With either approach — Try to adjust calibration to 1mV=20 mm (which is twice normal size) — as this may maximize atrial size in recording.
- Bottom Line: Lewis lead placements are easy to apply. In a hemodynamically stable patient with a perplexing arrhythmia for which standard lead placement fails to reveal atrial activity — We should consider a Lewis Lead more often than has been done.
= = =
Figure-2: The 2 most common versions of a “Lewis Lead” (The chest picture with lead placements adapted from Meyering — MMEM, 5/17/2020).
= = =
Figure-3: The original Lewis Lead (in YELLOW in Figure-2).