Late in an evening shift, during a lull in care, I was reading a list of ECGs, one after another, on the computer queue and saw this one, which had been recorded 12 hours earlier in the day:
 |
| What do you think? |
I thought to myself:
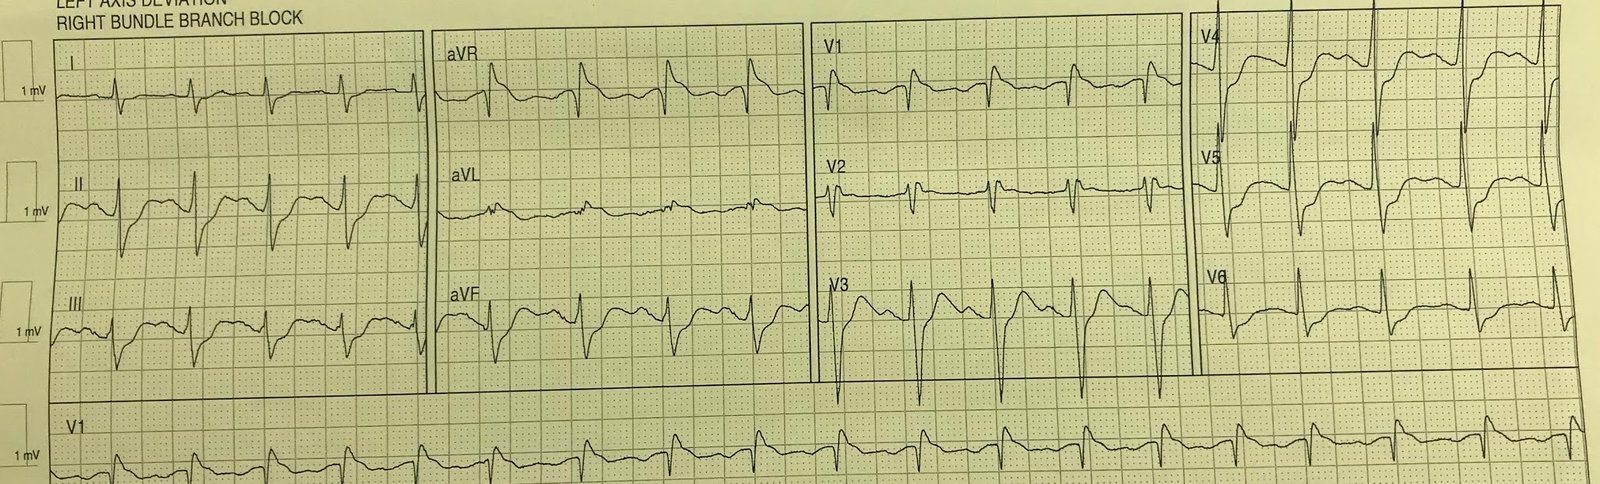
“Hmmm, there is terminal T-wave inversion in V2, and the suggestion of it in V3. But the QTc interval is too short for Wellens (377 ms by the computer, but I measure it as even shorter),” so I confirmed the computer interpretation of “non-specific ST-T abnormalities,” and moved on. I still think that, by itself, this ECG is not diagnostic.
There had been an ECG recorded 110 minutes earlier, but I did not notice that and did not look at it. Here it is:
 |
| What do you think? |
Interpretation: some minimal ST Elevation in V2. The ST segment is straight, which is might be very suspicious for MI, but here it does not strike me as significant. aVL and III are also suspicous, but not diagnositic.
The computerized QTc was 394 ms. If we do the 4-variable formula, it comes to 15.11 which is extremely low. At a cutoff of 17, the formula is > 95% sensitive.
So each ECG, on its own, is negative.
But if you see them side-by-side, and in the right clinical context, one would now highly suspect that the first ECG presented (the 2nd recorded) is Wellens’, and the 2nd presented (the 1st one recorded) was an LAD occlusion.
The patient indeed presented with chest pain:
“A 30-something male with 2 days of worsening chest pain that he describes as pressure. He endorses associated SOB and pain radiating down his left arm as well. He has some increased pain with deep inspiration it denies pain with movement or palpation. He denies history of cardiac disease.”
The patient’s pain on the 2nd ECG had been resolved (this is consistent with Wellens’ syndrome). It appears that the triage MD saw the first ECG (which is non-diagnostic), and the 2nd providers saw only the 2nd ECG, which is also non-diagnostic.
In this case, 2 non-diagnostic ECGs make for a diagnostic pair of ECGs. But no one saw them both at once!
The first troponin I returned elevated at 0.101 ng/mL. The patient’s pain returned and so a NTG drip was started. The bed became available before anyone knew if the patient’s pain was resolved. And he left for his inpatient bed.
Fortunately, when he arrived, the MDs upstairs saw him immediately and realized he had uncontrolled pain on the NTG drip, so they activated the cath lab immediately.
Here is the angiogram result:
90% hazy stenosis of the proximal LAD, no improvement with Intracoronary NTG x 100 mcg, 200 mcg, 300 mcg – suggestive of plaque rupture/culprit
Impression and Recommendations:
Culprit for NSTEMI is a 90% thrombotic stenosis of the proximal LAD. Stented.
Here is the post cath ECG:
 |
| There appears to be pseudonormalization of the T-waves! I suspect they were pseudonormalized BEFORE the angiogram, when the pain had recurred, and that this is residual after opening the artery. It often takes hours for the reperfusion T-waves to evolve after reperfusion, or (as in this case) to be re-established after re-reperfusion(see below). |
And the next AM:
 |
| Typical reperfusion T-waves |
Learning Points:
1. Always look at all the EKGs. By themselves, they may appear nearly normal. But seen in evolution, they may be diagnostic
2. Always assess the response to therapy before deciding the patient does not need the cath lab now.
![]()
===================================
MY Comment, by KEN GRAUER, MD (11/1/2019):
===================================
Superb case by Dr. Smith for many reasons. Having served the function of “ECG Over-reader” for all resident and faculty tracings done in our Family Medicine Residency Program throughout my 30-year career in academic medicine — I am well aware of the challenge of going through stacks of tracings without any history to go along with the ECGs that are placed in front of you.
- The question is always WHEN are there findings on an ECG that may have been missed? — and which may need immediate clinical correlation in order to ensure that the patient is appropriately cared for?
- Clearly — there just isn’t time to find out the history, and learn what the provider did for each patient whose ECG appears in the large stack of tracings in front of you. So, one has to be selective in choosing which cases to pursue. The clinical presentation in this blog post provides an excellent and insightful example of these principles.
For clarity — I have numbered the 4 tracings in this case in the order in which these ECGs are shown above (Figure-1).
- My comments provide a slightly different perspective …
- In my opinion — the decision-to-be-made is not whether to activate the cath lab or not. Instead, one needs to decide whether to STOP what you’re doing to get more clinical information before moving on to the next tracing in the stack.
 |
| Figure-1: The 4 ECGs presented in this case (See text). |
ECG #1 ( = the 1st ECG we were given to look at — but actually the 2nd ECG that was done in the ED on this patient). Since ECG #1 was interpreted “cold” (ie, knowing only that it was recorded 12 hours earlier — but without the benefit of any history or awareness of other tracings on this patient) — I’ll comment on this tracing from that perspective.
- The rhythm in ECG #1 is sinus bradycardia at ~58/minute. All intervals are normal. The frontal plane axis is close to 0 degrees. There is no chamber enlargement.
- Regarding Q-R-S-T Changes — there appear to be tiny (probably insignificant) q waves in leads I, II and aVL. It is important to note that in both leads III and aVF — there is a small initial upright deflection (r wave) — so that these leads manifest an rSR’ (or RBBB-like) configuration. Regarding R wave progression — Transition is slightly delayed (ie, the R does not become taller than the S wave is deep until between V4-to-V5).
- ST-T wave appearance is remarkable in ECG #1. There is slight-but-real ST elevation in each of the inferior leads (as judged in comparison to the PR segment baseline). In lead aVL — the ST segment is flat, with a hint of shallow T wave inversion in one of the complexes shown. The ST segment in leads V1-thru-V3 is coved, especially in leads V2 and V3. As per Dr. Smith — there is a hint of terminal T wave inversion in V2 and V3. Artifact in leads V5 and V6 renders ST-T wave assessment in these leads useless, beyond saying that there do not appear to be acute changes.
- PEARL #1 — Lead III is a right-sided lead. As a result — you may sometimes see an rSR’ pattern in lead III that is functionally comparable to the rSR’ pattern that we are used to seeing in lead V1 when there is either complete or incomplete RBBB. When the QRS complex is not wide (as in ECG #1) — I think of this rSR’ pattern that we see here in lead III as an incomplete RBBB “equivalent” (which is supported in ECG #1 by the finding in lead I of a narrow, terminal s wave). This is relevant to this case — because normally with RBBB patterns — the ST-T wave will be oppositely directed to the last QRS deflection ( = the R’) in lead V1. But instead of ST-T wave depression in leads III and aVF — there is slight ST elevation in each of the inferior leads, and the T waves are most definitely upright.
- BOTTOM LINE re ECG #1: This is not a normal tracing. As per Dr. Smith — the ST segment coving in leads V2 and V3, especially given that hint of terminal T wave inversion — could reflect an ongoing acute event (ie, ischemia and/or development of a Wellens’ pattern ECG). In addition — the upright T waves in leads III and aVF, in association with the rSR’ pattern in these leads — together with slight-but-real ST elevation (when there should be ST-T depression in these leads with an IRBBB pattern) could reflect an acute ongoing event. Although these findings are subtle — in an ED setting, I would have STOPPED after seeing ECG #1 to find out what was going on with this patient on the basis of this tracing alone.
Comparing ECG #2 (obtained 110 minutes earlier, when the patient first presented to the ED) — with ECG #1:
- As per Dr. Smith — the KEY to this case is the change in appearance of the ST-T waves in leads V2 and V3 between ECG #1 and ECG #2. There is now in ECG #2 ST segment straightening with slight elevation in lead V2 — with no hint of terminal T wave inversion. In addition — the ST segment in lead aVL is now coved in appearance (it was not coved in ECG #1) — and it looks to me like there is no ST elevation in leads III and aVF (whereas there was in ECG #1).
The last 2 tracings are insightful. ECG #3 — obtained after stenting the “culprit” proximal LAD — shows further evolution.
- It sounds as if there may have been reocclusion and then reperfusion. The ST-T waves in the precordial leads looked to me as I would have expected them to look prior to this patient’s acute event. Note in particular that the ST segment in lead aVL of ECG #3 is no longer coved — and that the ST-T wave in lead III is now oppositely directed to the last deflection of the QRS ( = the R’) in this lead.
- ECG #4, done the following day — then shows the typical ST-T wave evolution of reperfusion T waves in the precordial leads. Note how we also see the marked changes of reperfusion ST-T waves in the limb leads of ECG #4!
- PEARL #2 — I believe that the evolution of ST-T wave changes that we see serially in the 4 tracings in Figure-1 confirm what I suggested in PEARL #1 — namely, that the initial inferior lead ST elevation with clearly upright T waves in leads III and aVF (that manifest an IRBBB pattern) — was indeed an additional important subtle clue in ECG #1, that an acute process might be ongoing — and that immediate clinical correlation should be sought at this point.
Our THANKS to Dr. Smith for this highly insightful case!
![]()