
This is an elderly woman with a history of HFrEF (EF 20%), CKD, hypertension, dyslipidemia, decompensated Cirrhosis, Hepatic Encephalopathy, Hx of Esophageal varices, and A-fib with RVR on carvedilol, type 2 diabetes who presents to the ED with sore throat, generalized body pain, agitation, chest pain, and shortness of breath. She was a difficult historian and easily agitated.
An EKG was ordered 24 minutes after arrival and completed 41 minutes after arrival.
What do you think?
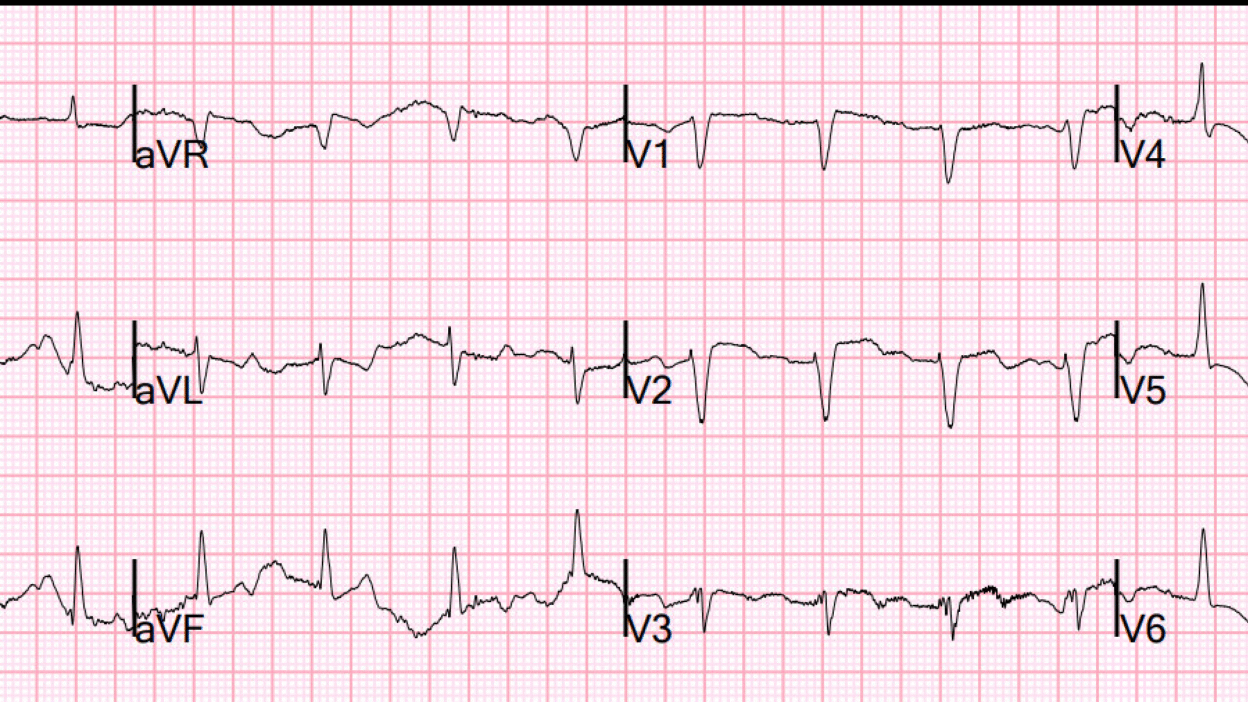
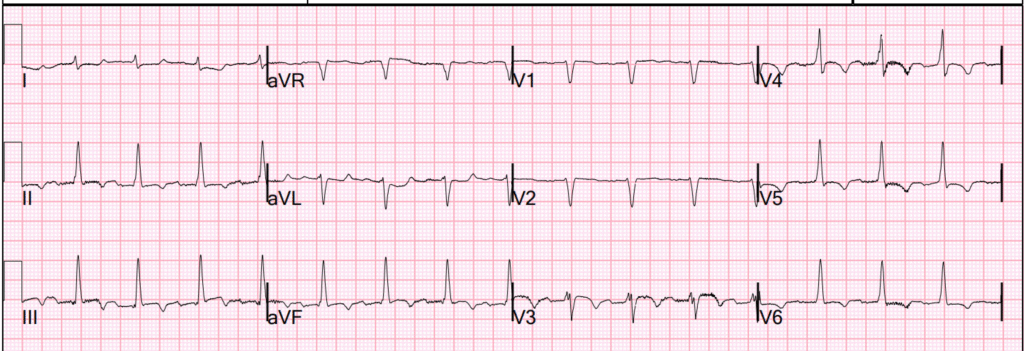
There is unfortunately a lot of baseline wander and artifact. Nevertheless, you can clearly see P-waves in lead I (sinus rhythm at a rate of 100), Intraventricular conduction delay (IVCD, 120 ms), AND inferior ST Elevation with reciprocal ST depression in aVL.
This is OMI until proven otherwise.
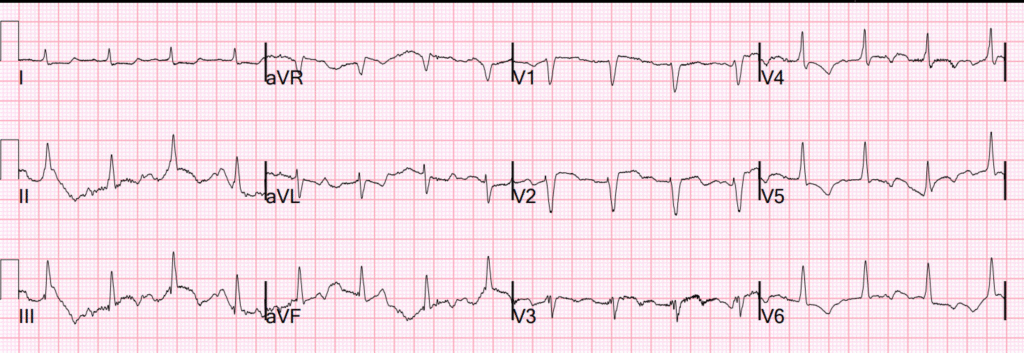
There was even a previous ECG for comparison:
So all of the findings are new, confirming Acute OMI. Here the QRS is only 102 ms.
The PMCardio Queen of Hearts AI Model agrees:
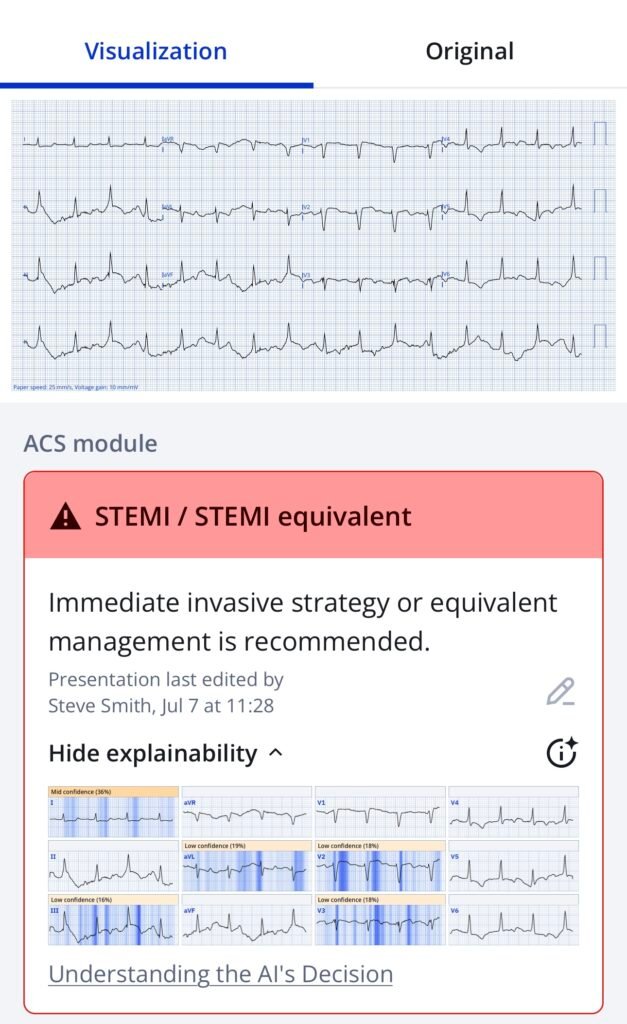
New PMcardio for Individuals App 3.0 now includes the latest Queen of Hearts model and AI explainability (blue heatmaps)! Download now for iOS or Android. https://www.powerfulmedical.com/pmcardio-individuals/ (Drs. Smith and Meyers trained the AI Model and are shareholders in Powerful Medical).
K returned 20 minutes later at 6.2 mEq/L. This probably explains the wide QRS, but there are no other features of hyperK on the ECG.
More importantly, the first troponin returned at 3569 ng/L.
In the context of chest pain and shortness of breath, this is all but diagnostic of very high risk acute type 1 MI requiring the cath lab (for a patient who is eligible). With the ECGs, this is Occlusion MI (OMI) until proven otherwise.
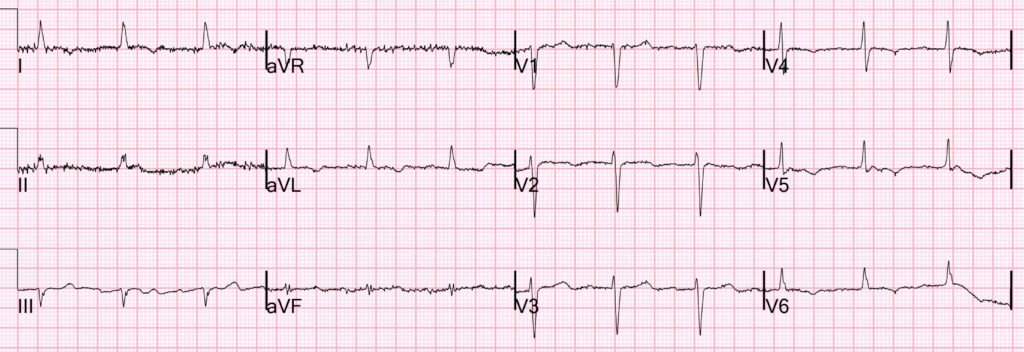
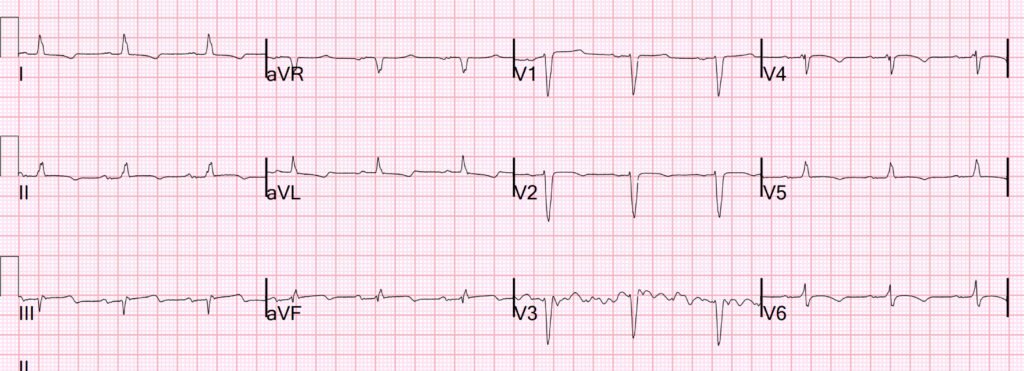
So another ECG was recorded 34 minutes after the first:
This is diagnostic of inferior OMI (STE in inferior leads with reciprocal STD in aVL), probably with some reperfusion (since the inferior T-waves are inverted, and the T-wave in aVL is reciprocally upright.
One would only confirm reperfusion if all symptoms were resolved. If ANY continued symptoms, then the patient must be considered to have persistent ACTIVE (not reperfused) OMI.
It is unclear if the chest symptoms had resolved or not.
The most up to date PMCardio AI ECG Model, which diagnoses both Active OMI and Reperfused OMI, but which is not available to the public, states with high confidence that this is both active OMI and reperfused OMI.
_______
On Bedside ultrasound, there is a severely reduced EF (10% vs. previous 20%), and regional wall motion abnormality vs. akinesis apically. The IVC appeared plethoric, concerning for volume overload, and there were B-lines diffusely concerning for pulmonary edema. Chest X-ray showed cardiomegaly and pulmonary edema. Hemoglobin was 8.1 g/dL (baseline).
After all this information was collected, the ED staff was worried about OMI with new pulmonary edema and worsening LV function, and called cardiology to discuss the patient and the ECG findings.
Cardiology was reportedly very skeptical that this is ACS. They were also reluctant to intervene given her complex history of hepatic encephalopathy, hyperglycemia, and hyperkalemia along with CKD.
So the plan was to medically optimize, then reassess.
While being transported to another room, apparently off a monitor, She suddenly became unresponsive and was found to be pulseless. The initial rhythm was asystole.
She was resuscitated without defibrillation.
The physicians assumed the arrest was due to hyperkalemia. She was treated for hyperkalemia with shifting therapy.
Follow-up
Formal echo: Decreased left ventricular systolic performance, severe. The estimated left ventricular ejection fraction is 10-15% (previous 20-25%). Regional wall motion abnormalities: anterolateral/inferolateral – akinetic. mid to basal inferior – akinetic. apical anterior septum and apex, probable.
The hs Troponin I peaked at greater than 60,000 ng/L. This establishes a very large acute OMI.
The Cardiology note remained skeptical of ACS, indicating that this is probably an exacerbation of HFrEF: “Patient likely suffered from acute HF exacerbation. Unsure of etiology of cardiac arrest, could be related to hyperkalemia/acidosis. Elevated troponins and EKG changes likely in the context of supply/demand mismatch but cannot rule out ACS.”
2 days later, this ECG was recorded:
New inferior Q-waves, and obvious OMI (possibly reperfused). The cardiology read of this ECG was “inferior ST Elevation not meeting STEMI criteria.” (But it is obvious OMI)
STEMI criteria are worthless!
By 5 days later, there is finally acknowlegement that an angiogram would be indicated if the patient had a reasonable prognosis:
“Unfortunately, patient’s prognosis remains poor. Her severe LV dysfunction, decompensated cirrhosis, CKD, high bleeding risk with thrombocytopenia and history of recurrent GI bleeds, make ischemic evaluation with coronary angiogram and not actionable.”
No angiogram was ever done.
If this had been recognized on the first ECG, and the patient had PCI immediately, would she have survived? Maybe not, as she has a lot of comorbidities.
But we should be making these decisions for the right reasons. We should be able to make the diagnosis immediately, then decide whether or not the intervention is appropriate for a severely chronically ill patient.
It would be preferable to say right from the start: “This is clearly an acute coronary occlusion, but in consultation with the family, we will not pursue intervention.”
The patient did die.
======================================
MY Comment, by KEN GRAUER, MD (8/22/2025):
Hyperkalemia is notorious for the multiple ways in which this entity may present.
- Textbooks often describe sequential development of tall, peaked T waves — QRS widening — loss of P wave amplitude — and ultimately sine wave QRST appearance, terminating with VFib or asystole.
- As we often emphasize, although some patients do seem to follow the above sequence for developing ECG abnormalities — many patients do not. Tall peaked T waves are not uniformly the 1st ECG sign of hyperkalemia — and some patients (as seen in today’s case) may develop cardiac arrest as their 1st manifestation of hyperkalemia!
It is with these thoughts in mind that I thought it worthwhile to Take Another LOOK at today’s initial ECG — and the repeat ECG — since significant Hyperkalemia was present at the time each of these tracings was recorded.
- How much of a role hyperkalemia played in the development of this patient’s cardiac arrest? — vs — acute ischemia from acute infarction? — vs — some combination of hyerkalemia & acute infarction, is unknown.
- What is known — is that I never would have suspected hyperkalemia from either ECG #1 or ECG #2 (See Figure-1).
========================
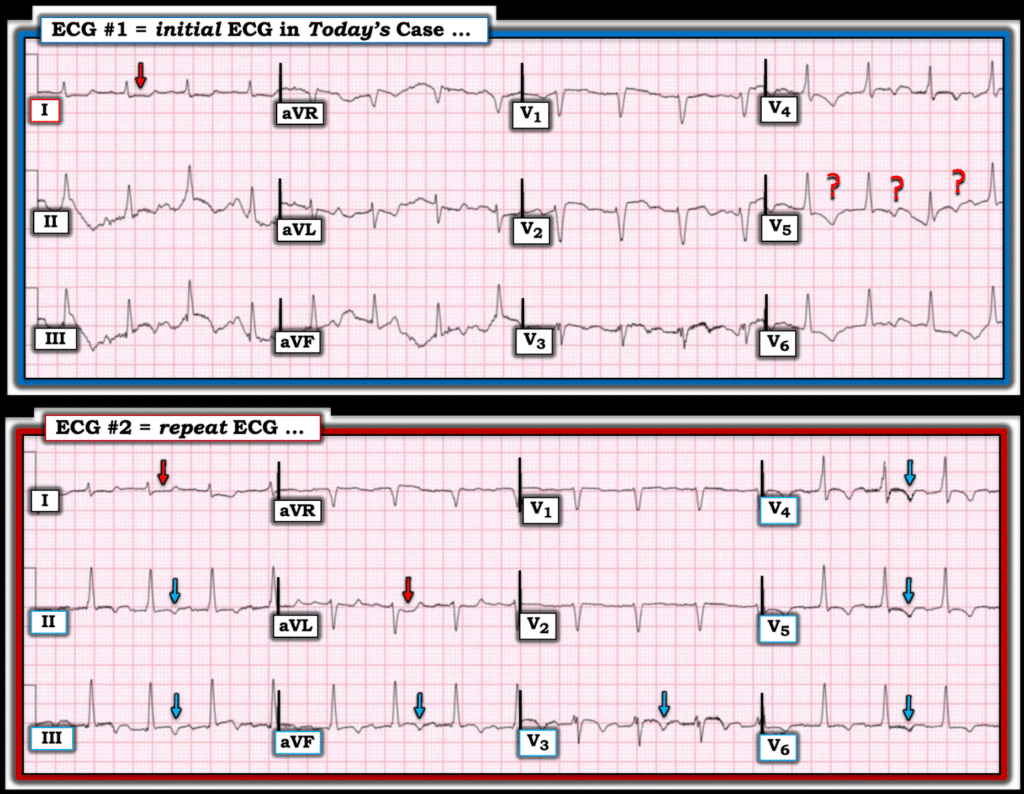
Figure-1: Comparison between the initial ECG and the repeat ECG in today’s case. Significant hyperkalemia present with both tracings.
The Initial ECG in Today’s CASE:
The presence of artifact in virtually all leads in ECG #1 make this tracing exceedingly difficult to interpret. About the only lead in this initial ECG that shows consistency in QRST appearance is lead I — which considering tiny size of the QRS complex, manifests worrisome flat ST depression.
- Despite the artifact — we are able to say that the QRS complex in ECG #1 is narrow.
- Detection of P waves is extremely difficult. I believe P waves are present with a constant PR interval in lead I — but these P waves are truly tiny in lead I — and not consistently seen in any other lead. I initially thought the rhythm was sinus, with artifact as the cause of non-visualization in other leads — but is reduced P wave amplitude a manifestation of this patient’s hyperkalemia?
- Especially in view of the clearly abnormal flat ST depression in lead I — we can imagine ST-T wave changes of ischemia in other leads — but is there enough consistency in complexes to rule out artifactual ST-T wave deviation? Clinically — this is an ECG that needs to be repeated for assessment of ischemia.
- PEARL: Significant hyperkalemia is notorious for masking ECG signs of ischemia/infarction. This is because the ECG shows us the net effect of hyperkalemia and whatever other conditions may be operative. For example — IF T waves would have been peaked in this tracing because of significant hyperkalemia — What will happen to such T wave peaking if acute ischemia was causing ST depression/T wave inversion?
The Repeat ECG:
Despite treatment measures — hyperkalemia persisted at the time ECG #2 was recorded.
- The rhythm remains regular — and the QRS is still narrow.
- Based on the appearance of atrial activity in lead aVL — I once again suspected that the rhythm was probably sinus in ECG #2. That said — baseline artifact rendered me far from certain about the rhythm.
- That said — the overall consistency of QRST waves in ECG #2 was improved enough, that compared to ECG #1 — flat ST depression in leads I,aVL (RED arrows in ECG #2) — with ST coving and symmetric T inversion in 7 other leads (BLUE arrows) strongly suggests reperfusion T waves (but once again — this is not the ECG of a patient with significant hyperkalemia).
==========================


