This was sent to me by Mohammed Shogaa:
Case:
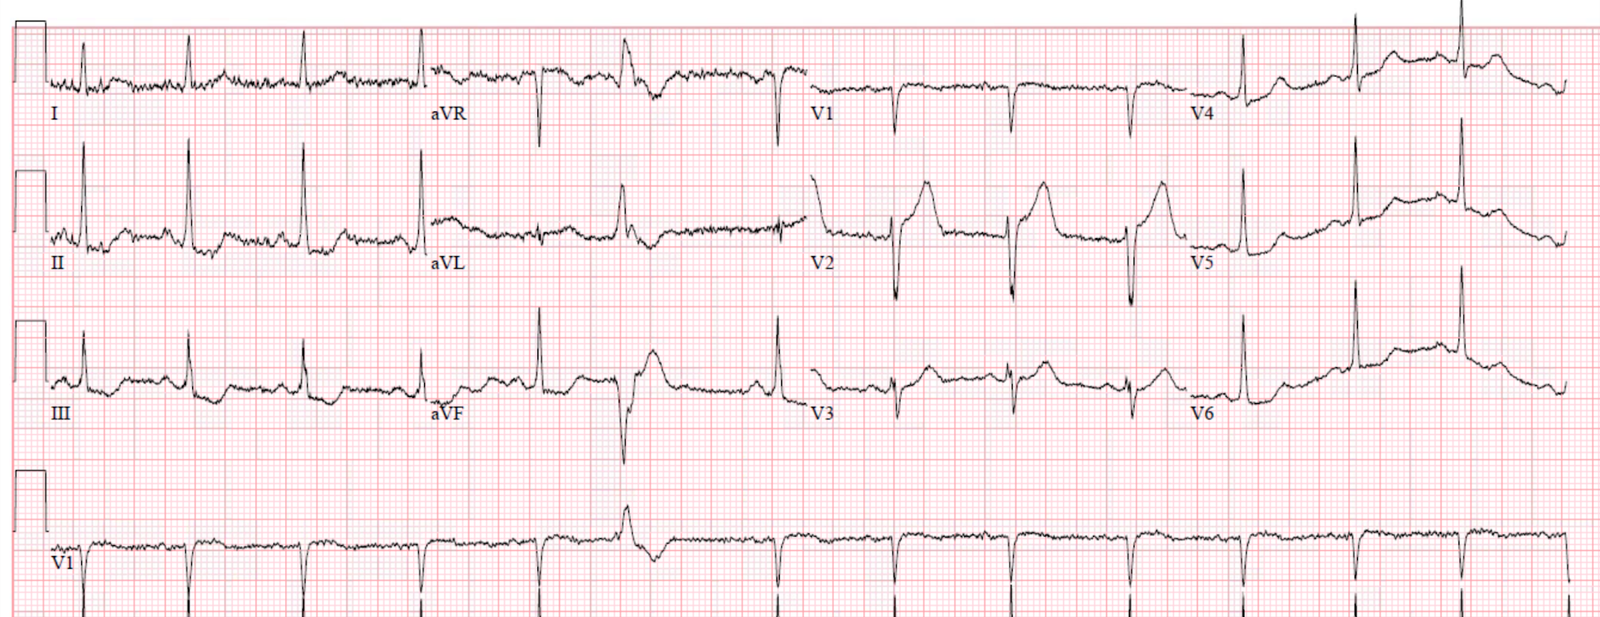
A previously healthy patient presented in acute pulmonary edema, and had this ECG recorded:
 |
| Sinus tachycardia What do you think? |
Mohammed was impressed by the concordant ST depression in inferior leads. This is indeed a good sign of OMI in LBBB, and in this case it is indeed helpful to make the diagnosis.
Inferior ST depression in normal conduction, as I have always written, is RECIPROCAL to ST elevation in lead aVL, and is often more visible than the STE in aVL (see example images at end of post). Here, there is indeed STE in aVL, but it is less than 1 mm. Our data would suggest that concordant STE in aVL that is less than 1 mm is not as specific as one might like for OMI, although it is indeed abnormal and should really heighten your suspicion.
When it is accompanied by inferior reciprocal concordant STD, that should make you even more suspicious.
Here the inferior reciprocal STD is indeed more than 1 mm. So I would call this diagnostic of OMI in LBBB, even though, technically, it does not meet the Smith Modified Sgarbossa criteria.
There is also excessively discordant ST depression (ST/S greater than 30%) in lead V6. This is very specific for occlusion!
Which artery is it?
Just as in normal conduction, the measurements of ST Elevation in many OMI do not meet the STEMI “criteria,” the measurements in LBBB frequently do not meet the Smith Modified Sgarbossa criteria.
Criteria are simply cutoffs with imperfect sensitivity and specificity.
Of leads V1-V4, V2 has the most proportionally discordant STE, with STE at 2.5-3 mm and an S-wave of 13 mm. If we assume STE is 3 mm, then the ratio is 3/13 = 0.23. Remember that 25% is 80% sensitive and 99% specific. But 20% is 84% sensitive and 98% specific. So really, 20% is a very useful cutpoint.
The cath lab was activated.
A 100% LAD occlusion, proximal to the first diagonal, was found and opened.
Here are the subsequent ECGs:
 |
| Much more normal LBBB |
Later still:
 |
| More normalized |
Later still:
 |
| The LBBB is resolved and there are (Wellens’-like) inverted reperfusion T-waves in V1-V3. |
Learning Point:
Criteria are guidelines only.
This first ECG had 2 different findings that ALMOST met the Smith modified Sgarbossa criteria. Plus excessively discordant ST depression, which is the 2nd of 2 Smith modified rules (ratio of STD greater than 30% of preceding R-wave).
Both strongly suggested a proximal LAD occlusion.
References
Meyers HP et al. Validation of the modified Sgarbossa criteria for acute coronary occlusion in the setting of left bundle branch block: A retrospective case-control study
Here are 3 cases of high lateral OMI in which the STD in inferior leads is more apparent than the STE in I and aVL:


![]()
===================================
Comment by KEN GRAUER, MD (5/24/2019):
===================================
Objective assessment of acute patients with LBBB has been greatly facilitated by Smith-Modified-Sgarbossa Criteria (SMS Criteria). As discussed in detail by Dr. Smith above — application of these criteria to the case at hand predicted acute OMI for this patient who presented to the ED in acute pulmonary edema.
- The “beauty” of SMS Criteria — is that they provide a method with user-friendly calculations that clinicians can readily learn to apply.
- In addition to the use of SMS Criteria — I have always favored a qualitative approach, in which recognition of ST-T wave Shaping that just should not be there reliably clues me into accurate diagnosis. The more leads on a 12-lead tracing that show abnormal ST-T wave morphology — the more comfortable I am that there is acute pathology. And when there are multiple leads showing ST-T wave changes that “shouldn’t be there” in addition to objective SMS Criteria — I become even more confident in my diagnosis.
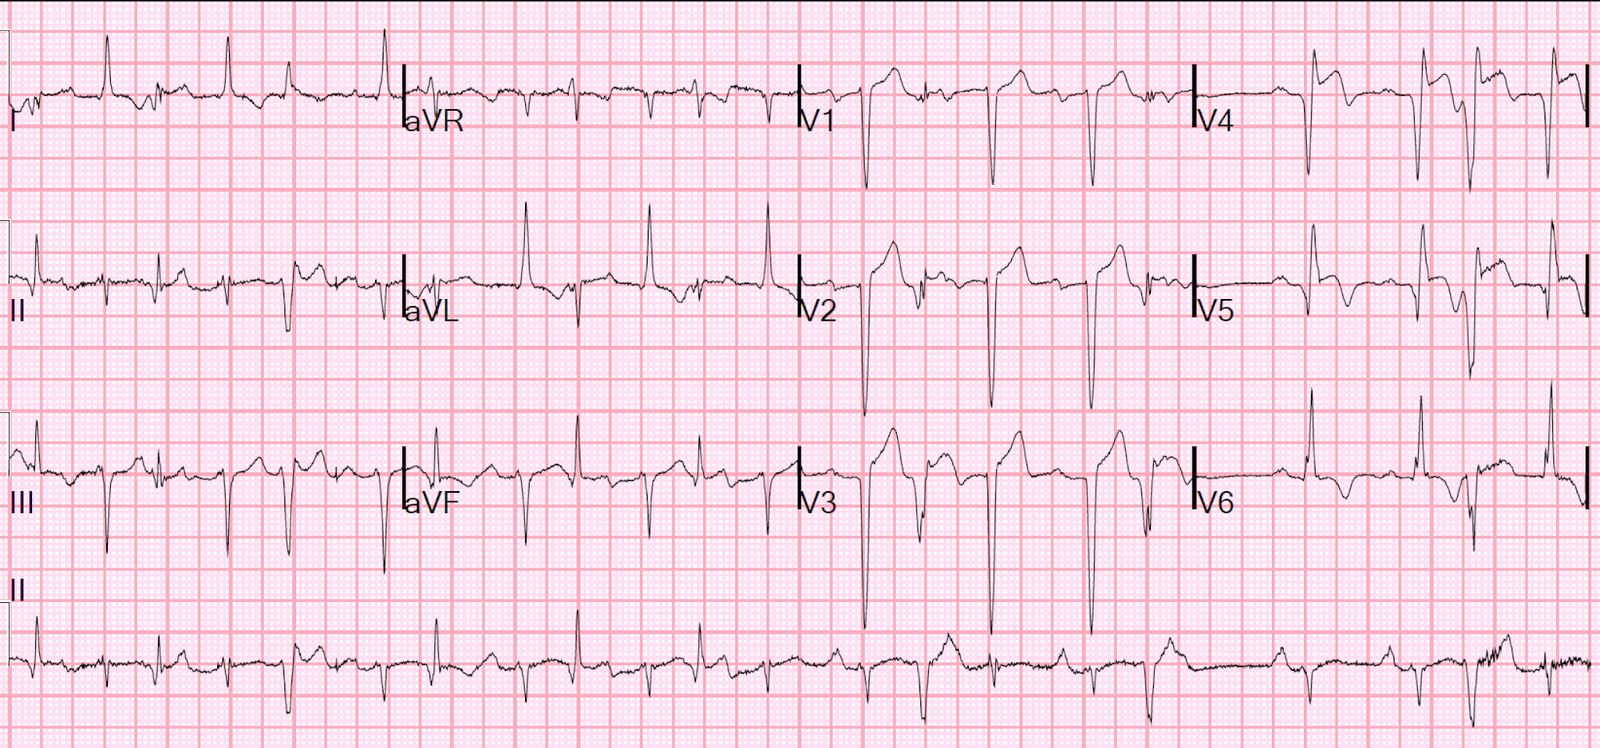
- NOTE — It may take a while to become comfortable with qualitative assessment when there is LBBB. Herein lies the “art” of electrocardiography. In the hope of illustrating this concept — I’ve put together the initial ECG obtained in the ED on this patient ( = ECG #1 in Figure-1) — together with the 3rd ECG in this case, that was obtained some time after reperfusion ( = ECG #3).
 |
| Figure-1: The 1st and 3rd tracings obtained from the patient in this case (See text). |
The
problem in diagnosis that arises — is that LBBB
may: i) Mask infarction Q waves; ii) Produce poor R wave progression, if not frank
anterior QS complexes; iii) Manifest ST-T
wave depression in lateral and also inferior leads as an expected
repolarization change from LBBB without ischemia; and/or, iv)Result in at
least some degree of anterior ST elevation (and/or anterior T wave peaking).
- Taking these expected
physiologic changes of LBBB into account — I look first for ST-T wave
changes that simply do not reflect a physiologic response. - In my experience, when there is an
acute event in a patient with LBBB — only 1 or a few leads may show ST-T
wave Shaping that just should notbe there. In such cases, once I identify
even 1 or a few leads are definitely abnormal — it often
becomes easier to appreciate more subtle morphologic abnormalities in other
leads. - The more leads showing definitely
abnormal ST-T wave morphology — the greater the likelihood of an acute
cardiac event. This is especially true when SMS Criteria are also positive.
My Thoughtson ECG #1:
In this case —
I thought there were no less than 7 leads showing definitely
abnormal findings in the initial ECG ( = ECG #1 in Figure-1).
- My
attention was immediately captured by the shape
of the slight-but-definite ST elevation in lead aVL (RED
arrow in this lead). The rounded shape of this ST segment
with downward coving is not a normally expected response. - Each
of the inferior leads in ECG #1 show reciprocal
ST depression. The most markedly abnormal shape
is the abrupt angulation (GREEN arrow) at
the point where the end of the QRS complex joins the beginning of the ST
segment. The horizontal “ledge-like” ST depression
seen in these inferior leads (BLUE arrows) is distinctly abnormal. - Similar,
clearly abnormal horizontal “ledge-like” ST depression is also
noted in lead V5 (BLUE arrow in this lead). This shape of
ST depression should not be seen with non-ischemic LBBB. - Finally
— the acute angulation where the elevated J-point merges
with the ST segment especially in lead V1, but also in lead
V2 is clearly abnormal in shape (RED arrows in these leads). - In contrast
— I thought the ST-T wave shape in other leads was far less decisive. The shape
of the downsloping ST segments in leads I and V6 is not
unlike the shape of lateral ST-T wave depression expected in non-ischemic LBBB. I found the shape of
the ST segment in lead V3 the most difficult to assess. This ST segment
in lead V3 lacks the angulation highlighted by the RED arrows in leads V1 and
V2 — so by itself, I would not have been convinced of abnormality. However,
in the context of clear abnormality of the ST segment in neighboring
leads V1 and V2 — I suspected abnormal ST elevation extended at least to
lead V3. I thought the ST segment in lead V4 was indecisive.
BOTTOM Line: Although there
is no mention of chest pain in this case — acute pulmonary edema is clearly a
clinical setting that is commonly associated with acute MI. In this clinical
context — the presence of LBBB (not known to be new or old) + at
least 7 (if not 8) leads with clearly abnormal ST-T wave
deviation in the distribution we see in Figure-1 strongly suggests acute
LAD occlusion until proven otherwise.
My Thoughtson ECG #3:
- The
best way to improve on recognition of clearly abnormal
ST-T wave findings in the setting of LBBB — is to routinely go back and
compare the initial ECG of each case you encounter, with follow-up
tracings obtained after acute reperfusion. NOTE the dramatic
improvement in ST-T wave appearance in ECG
#3 — compared to the clearly abnormal
ST-T wave findings in each of the 7 highlighted leads in ECG #1 (Figure-1).
![]()