A 60-something called 911 for chest pain.
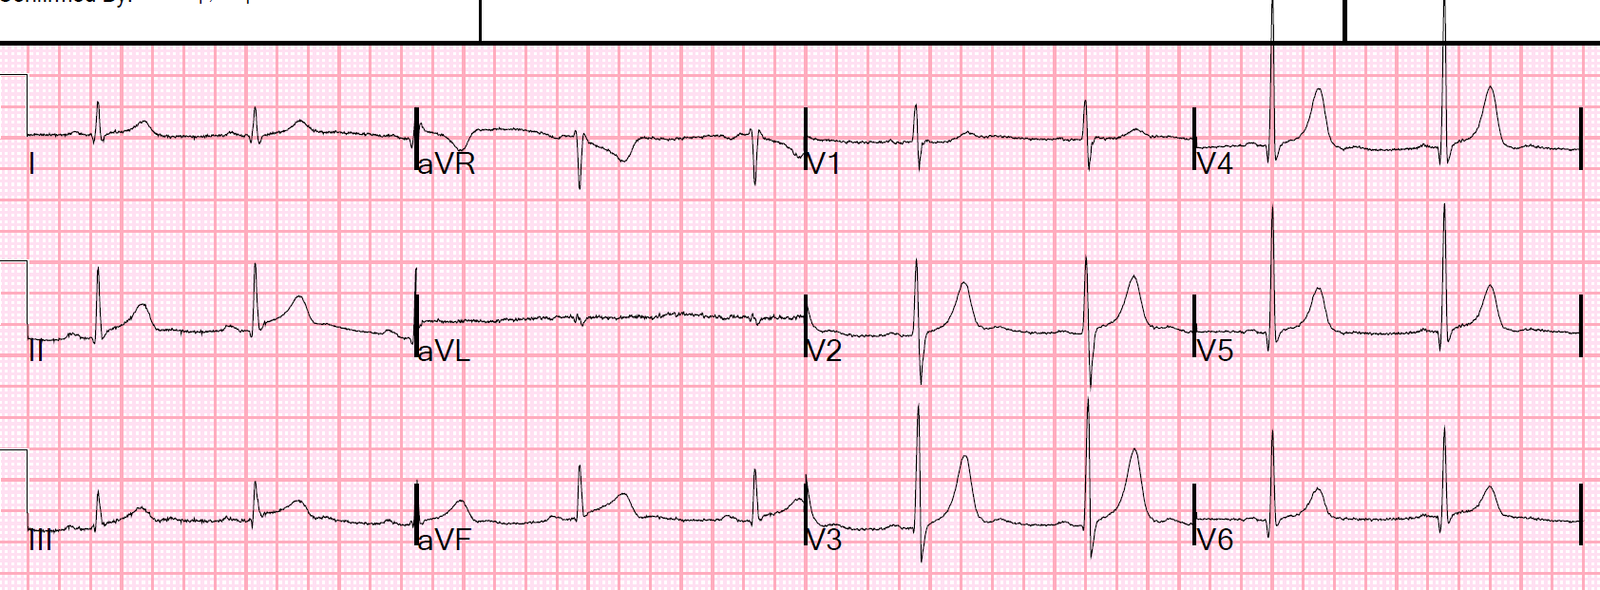
Medics recorded an ECG at time zero:
 |
| What to you think? |
There is no ST elevation, but V2 has a definite hyperacute T-wave. Inferior leads have a tiny bit of ST depression (this is very significant). aVL has a tiny amount of coved ST elevation in the presence of a tiny QRS. These are all very very suspicious for proximal LAD OMI.
They recorded another at 20 minutes:

 |
| Evolving anterior OMI, but with barely any ST Elevation. Look at the huge size of the T-wave in V4 relative to the R-wave. Increasing STE in aVL Increasing inferior reciprocal ST depression If you doubted LAD occlusion on the first one, there is no doubt any more. This is diagnostic |
Repeat at 25 Minutes:

 |
| Further evolution. Absolutely diagnostic of acute LAD occlusion. |
And another at 30 minutes:

 |
| The computer never noticed the myocardial infarction on any of these ECGs. |
The patient arrived in the ED.
This is the first ED ECG (at t = 40 minutes):
 |
| Computer did not comment on acute MI. The attending physician brought this to me without any of the other ECGs and asked my opinion: With 3 seconds, I said: Acute LAD Occlusion. It is diagnostic of LAD occlusion all on its own, without even comparing to the others. This is what my partner thought also, but just wanted confirmation. |
The cath lab was activated.
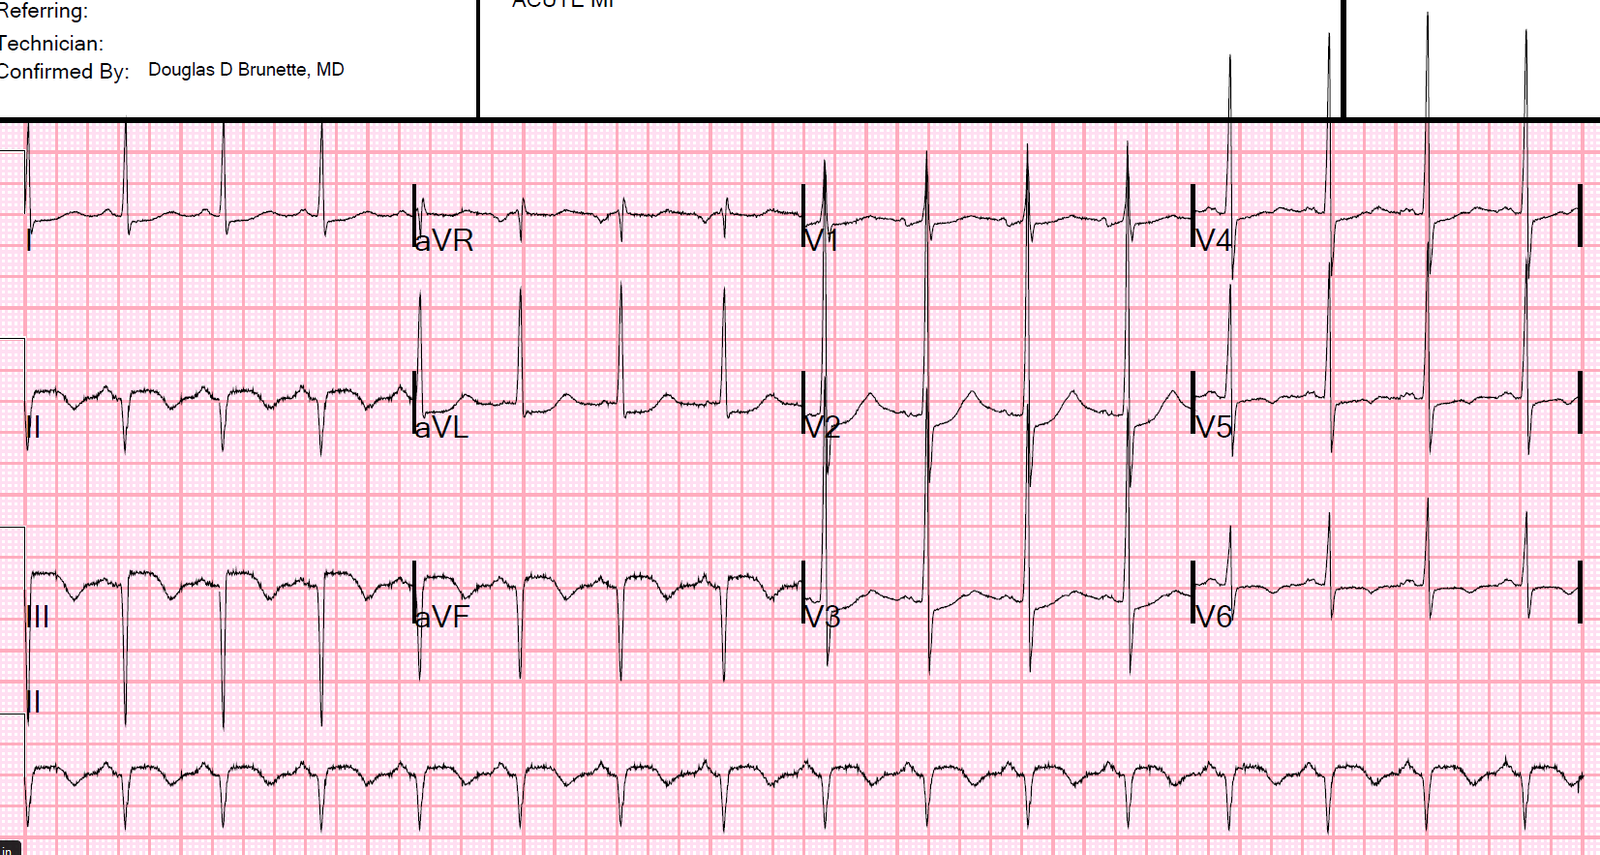
2nd ED ECG 60 minutes
 |
| Now there is diagnostic ST Elevation, but barely. Computer still did not comment on STEMI |
A Proximal LAD occlusion was found and stented.
ECG after reperfusion
 |
| Typical Reperfusion T-waves, similar to Wellens’ waves (and same pathophysiology), but different in that true Wellens’ waves have preservation of R-wave. This has a QS-wave in V2 because of extensive infarction, in spite of rapid reperfusion. |
Next day
 |
| QS-waves with reperfusion T-waves again |
Peak trop I 85.6 ng/mL (very large OMI)
Anterior Wall Motion Abnormality
At no point in time did the computer read a STEMI
Learning Points:
1. Acute LAD occlusion frequently does not manifest ST Elevation that meets “criteria”
2. Look for hyperacute T-waves (relative to QRS amplitude/voltage)
3. Look for any inferior ST depression, even minimal
4. Do serial ECGs.
![]()
===================================
Comment by KEN GRAUER, MD (6/26/2019):
===================================
Our THANKS to Dr. Smith for this superb example of serial evolution of acute LAD occlusion (OMI) — starting in the prehospital phase — passing through the ED — and following reperfusion of the occluded artery.
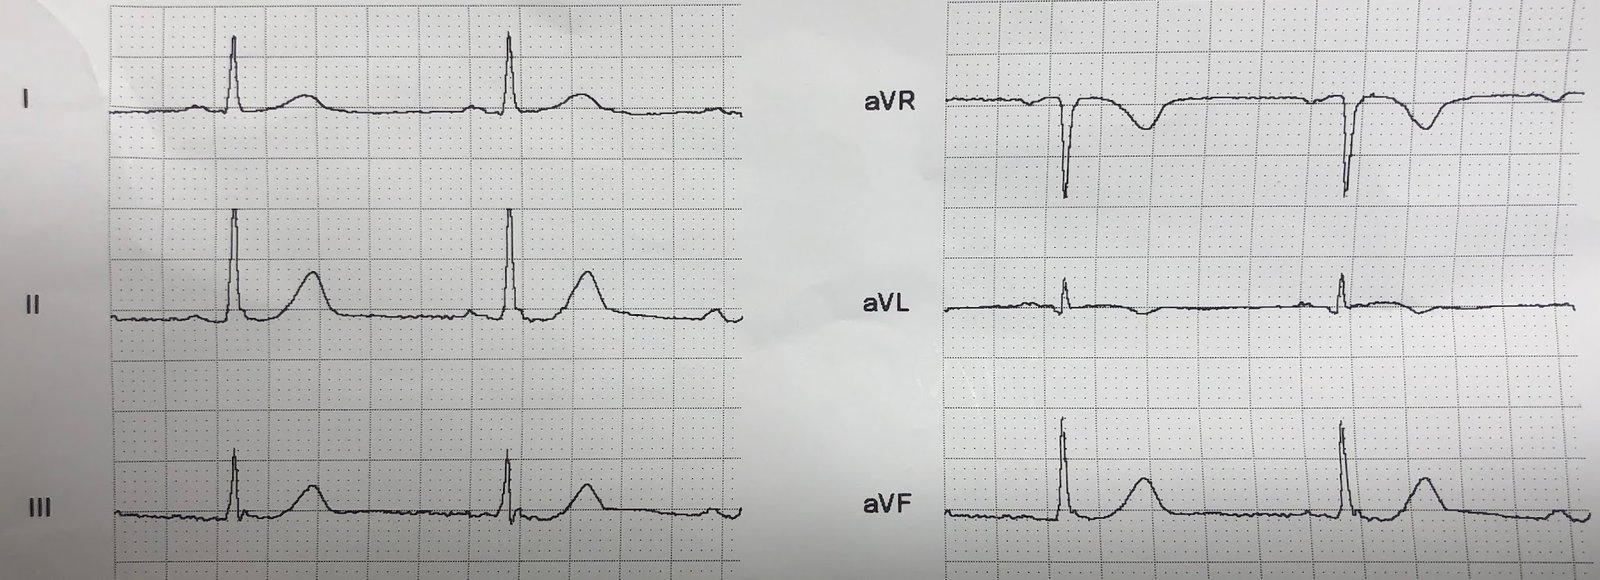
- I limit my comments to ECG #1 = the initial ECG done by medics in the field on this 60-something patient with new-onset chest pain. For clarity — I’ve put the 2 parts of this tracing together, and have added a few aids for ST segment shaping to facilitate visualization (Figure-1).
 |
| Figure-1: The initial ECG in this case, done by medics in the field (See text). |
My THOUGHTS on ECG #1 — Dr. Smith has done a great job with his tracing-to-tracing description of important findings for the 8 ECGs in this case.
- KEY Take-Home POINT: Given the history of new–onset chest pain in this patient — you should be 100% certain of the need for prompt cath from this 1st ECG alone. Your clinical assessment of ECG #1 in Figure-1 should be acute LAD occlusion until proven otherwise!
KEY ECG Findings in Figure–1:
- Leads V2 and V3 were the 1st to catch my eye! That the T waves in these 2 leads are hyperacute should be obvious from how disproportionate these T waves are compared to the tiny r wave in V3, and lack of any r wave at all in lead V2. Note how fat-at-their-peak and wide-at-their-base these T waves are. Note also straightening of the ST segment upstroke in lead V2 (angled BLUE line in this lead) — such that the normal upward concavity of the ST segment in lead V2 has been lost.
- There is loss of anterior R waves. A tiny initial r wave seems to be present in lead V1. This is completely lost by lead V2 (which manifests a deep QS complex). The r wave returns in lead V3 — but is still considerably smaller-than-it-should-be for a lead V3.
- Next, looking at “neighboring leads” — There is at least 1 mm of ST elevation with definite coving of the ST segment in lead V1 (“frowny”-shaped BLUE line in V1). This is not a normal lead V1 appearance — but rather reflects extension of the ongoing process (ie, the hyperacute T waves in leads V2 and V3). Thus, acute ST-T wave changes begin as early as lead V1.
- Continuing with the concept of “neighboring leads” — hyperacute T wave changes are clearly seen in lead V4 (with a disproportionately large T wave in V4, that is more than half the height of the R wave in this lead — as well as this T wave in V4 being fat-at-its-peak and wide-at-its-base). Although the T waves in leads V5 and V6 are not particularly tall — they share the fatter-at-their-peak-than-they-should-be appearance that we have already seen in leads V2-thru-V4. Leads V5 and V6 also manifest scooped and slightly depressed ST segments — that in the context of everything else are not normal.
- NOTE: Confirmation that ST-T waves in all 6 chest leads were abnormal in ECG #1 is forthcoming through comparison with the last 2 tracings (obtained after reperfusion) in this case.
PEARL: When contemplating the likely location of acute LAD occlusion — I look for the following 3 Clues, which when present suggest a more proximal LAD lesion:
- Is there ST elevation (or at least acute-looking ST segment coving) in lead aVL? ( = Yes, in Figure-1 — as suggested by the coved BLUE line in lead aVL). Note that this ST coving in lead aVL ends with terminal T wave inversion. There is also a surprisingly wide q wave in lead aVL, which may reflect the ongoing acute process.
- Is there reciprocal ST depression in the inferior leads? ( = Yes, in the form of scooped ST segments — as highlighted by curved BLUE lines in these inferior leads). Inferior lead T waves also look prominent in Figure-1 (a bit larger, and fatter-than-they-should-be at their peak).
- How early in the chest leads do acute/hyperacute ST-T wave changes begin? ( = slight ST elevation with ST coving begins as early as in lead V1 in ECG #1).
Bottom Line: Given the history of new-onset chest pain — You should be able within a minute (or less) of seeing this initial ECG in Figure-1 to: i) Be confident in strongly suspecting acute proximal LAD occlusion until proven otherwise; and, ii) Know that you should immediately contact the cardiologist on call as you are activating the cath lab!
- As per Dr. Smith — the diagnosis of acute proximal LAD OMI is solidified beyond doubt by subsequent tracings — but these subsequent tracings were not needed to justify immediate cath lab activation in this case. All that was needed given the history of new chest pain — was a quick look at ECG #1 in Figure-1.
![]()