A 61 y.o. male with a history of HTN and ETOH developed squeezing epigastric abdominal pain with associated vomiting and diaphoresis, followed by a syncopal episode which lasted about 10 seconds.
When medics arrived, he denied any chest pain, shortness of breath, or palpitations prior to the syncopal episode.
They recorded a prehospital ECG and diagnosed STEMI and activated the cath lab prehospital.
I heard that a prehospital cath lab activation was on its way.
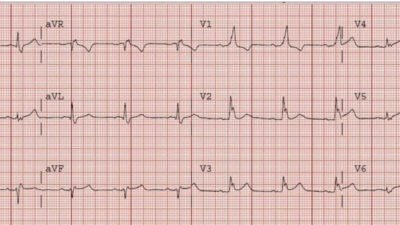
The patient arrived and we viewed the prehospital ECG:
 |
| There is ST elevation in V1 and V2 There is ST depression in II, III, aVF There is ST depression and T-wave inversion in V5 and V6 There is T-wave inversion without STD in V3 and V4 What do you think? |
It is worrisome for high lateral OMI (with reciprocal STD in inferior leads), and even for LAD OMI (STE with Q-waves in V1, V2)
However, I thought it was likely a false positive. I always try to go and see these prehospital activations right when they arrive whether he will be my patient or not, in order to view the prehospital ECGs, because they are so often false positives.
The combination of ST elevation in V1 and V2, with ST depression and T-wave inversion in V5, V6 should always make you think of LVH with chronic ST-T abnormalities, even if the voltage does not meet LVH criteria (of which there are many because they are so insensitive and nonspecific).
STE in V1 and V2, with ST depression in V5 and V6 is a pattern that occurs in Septal OMI, but it looks different that this and does not have the deep lateral T-wave inversion.
I have put an example of LAD OMI with STE in V1, V2 and STD in V5, V6 at the end of the post.
History
Upon questioning the patient, he had no chest pain or SOB. Whenever the only presenting symptom is syncope, without any other symptom, I am very skeptical that coronary occlusion (OMI) is the etiology. It is certainly possible, but the pretest probability is very low.
Abdominal pain can of course be a symptom of ACS, but it was brief and seemed to have resulted in a vasovagal event.
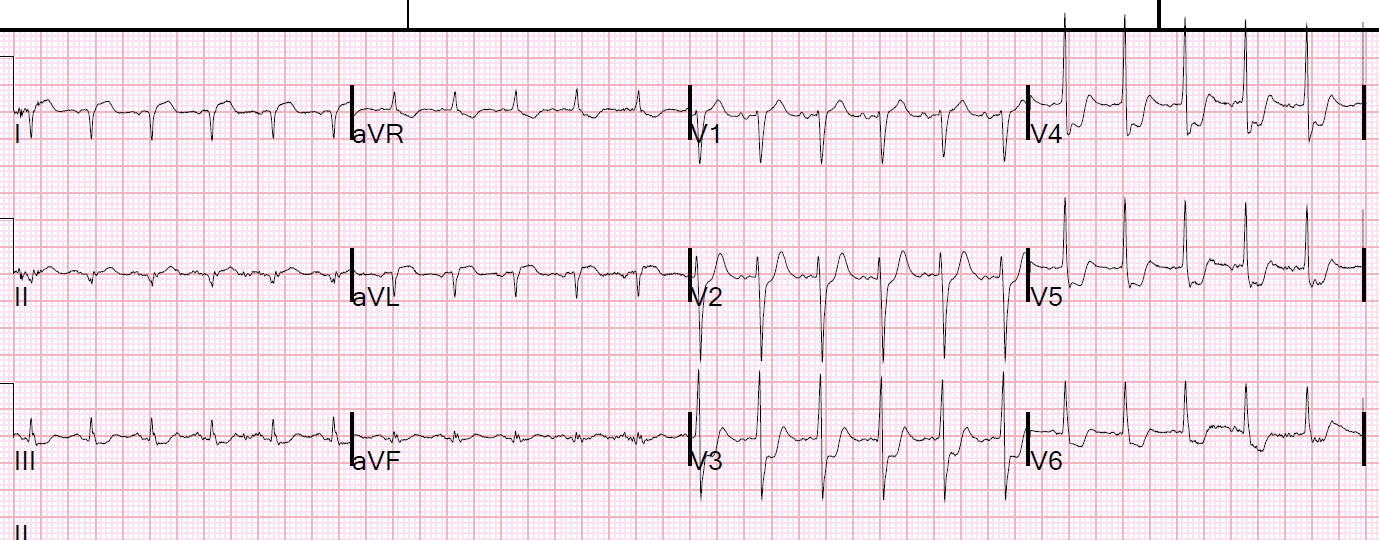
We recorded an ED ECG:
 |
| The STD, STE, and T-wave inversion are all there, but in this one the voltage is indeed high and diagnostic of LVH. The inferior ST depression is still worrisome for possible high lateral OMI. |
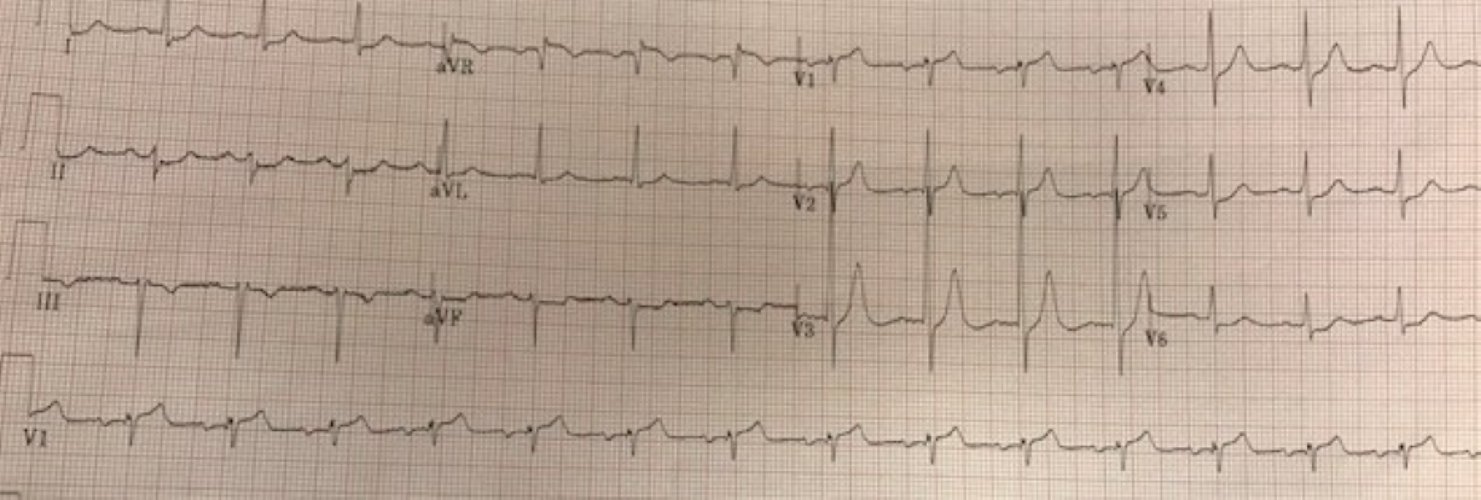
We looked for, and found, an old ECG from 5 years prior:
 |
| LVH with scary looking STE in V1-V3.
Scary looking, but all STE is due to LVH. The ST depression in inferior leads is new, but it may still be chronic, as this ECG was recorded 5 years prior. |
We did a bedside echo:
This shows concentric LVH with good function of all walls. However, it is easy to miss a wall motion abnormality, especially a high lateral WMA.
20 minutes later, a repeat ECG was recorded and it was identical.
The initial troponin returned undetectable.
We decided that this was very unlikely to be OMI, and admitted the patient for rule out MI and further testing.
ALL TROPS WERE UNDETECTABLE
A formal ultrasound was done:
Normal estimated left ventricular ejection fraction at rest.
Normal estimated left ventricular ejection fraction improved with stress.
No wall motion abnormality at rest.
No wall motion abnormality with stress.
Next day, a stress echo was done:
The exercise stress echocardiogram is normal.
The stress electrocardiogram is non-diagnostic.
The patient did not report angina with stress.
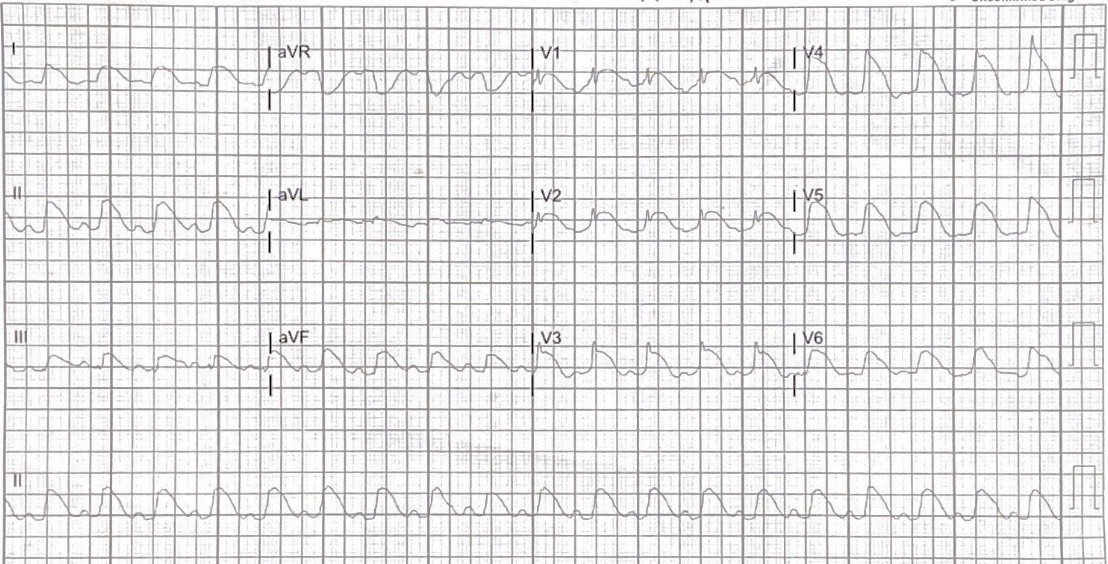
Typical subtle ECG of LAD occlusion, in which ST depression in V5, V6 make it far MORE likely to be OMI (whereas with deep T-wave inversion, it makes it less likely, and more likely to be LVH)
 |
| This was an acute LAD OMI that was missed. |
![]()
===================================
MY Comment by KEN GRAUER, MD (2/6/2020):
===================================
I love this case — because of the important lessons it holds regarding ECG recognition of LVH.
- For clarity — I’ve reproduced in Figure-1 the prehospital ECG ( = ECG #1) and the initial ECG done in the ED ( = ECG #2). I’ll explain below the 3rd image in this Figure.
 |
| Figure-1: The prehospital ECG, the initial ECG done in the ED — and a mirror-image view of leads V1, V2 from the initial ED ECG (See text). |
My THOUGHTS on ECG #1: Given the initial history ( = a 61yo man with a history of alcohol use, syncope, and abdominal but not chest pain) — I thought the probability of an acute cardiac event was less. That said, the prehospital ECG ( = ECG #1 in Figure-1) was clearly worrisome.
- As per Dr. Smith there are a number of worrisome findings in ECG #1 — including ST elevation in leads V1 and V2 + what looked to be reciprocal ST depression in the inferior and lateral chest leads. I initially thought that the T waves in leads V1 and V2 were hyperacute — because they clearly are disproportionately large and fat-at-their-peak with respect to the surprisingly small S waves in these leads.
- Side NOTE: I also initially thought the PR interval in ECG #1 looked short — but on closer review of this and subsequent tracings, I saw no delta waves. This is not WPW.
QUESTION: WHY do you think I added several RED arrows to ECG #1?
ANSWER: It appears that the QRS complex has been cut off in these 3 leads (and probably also in the lateral chest leads) in ECG #1. This is most evident in lead V2, as seen within the thin RED circle in this lead (Isn’t there a space between the descending and ascending limb of the S wave in lead V2?).
- That QRS amplitude has been “cut off” in multiple chest leads is extremely important to recognize — because IF anterior S waves are significantly deeper than they appear to be in ECG #1 — then the elevated ST-T waves in these leads might not be “disproportional” at all (ie, the T waves in leads V1 and V2 may not be “hyperacute” in ECG #1).
- My understanding is that on many prehospital ECG recording systems — QRS amplitudes are automatically truncated. NOTE: I am not well versed in the technicalities of such prehospital ECG recordings — so if ANYONE reading this post has expertise and insight on this subject — PLEASE write us a Comment!
My THOUGHTS on ECG #2: Assessment of the prehospital ECG ( = ECG #1) became much clearer after seeing the initial ECG done in the ED ( = ECG #2). Note a dramatic increase in QRS amplitude in all chest leads on this initial ED tracing!
- I believe this dramatic increase in QRS amplitude in ECG #2 (compared to the prehospital ECG #1) confirms my suspicion of truncated QRS amplitude on the prehospital tracing!
- Prominent ST-T waves are still seen in leads V1 and V2 in ECG #2 — but now that we see how deep the S waves in these leads really are (ie, 22 mm in V1 and 27 mm in V2!) — the ST-T waves in V1, V2 are perfectly “proportional” with respect to the deep S waves in leads V1 and V2 of ECG #2.
- Definite criteria for LVH are met in ECG #2 (ie, deepest S wave in V1,V2 + tallest R wave in V5,V6 here is >50 mm, which easily surpasses the 35 mm voltage criterion for LVH).
- Deep, symmetric T wave inversion is seen in each of the lateral chest leads (ie, leads V4, V5 and V6). This ST-T wave appearance in the lateral chest leads of ECG #2 is consistent with LV “Strain” vs ischemia. The complete lack of chest pain in the history in this patient who has longstanding hypertension strongly suggests that rather than ischemia, this symmetric T wave inversion reflects LV “strain” from marked LVH.
- The ST-T wave picture in lead V3 is interesting. Although there appears to be slight ST elevation with a coved ST segment appearance, that ends in terminal T wave inversion — this ST-T wave in lead V3 is unlikely to represent acute ischemia. Instead, it most likely is the result of being a “transition lead” that appears between the upright and slightly elevated ST-T waves in leads V1,V2 — and the deep, symmetric T wave inversion in lateral chest leads V4-V6.
QUESTION — HOW to distinguish between ST-T wave elevation in leads V1,V2 that is truly hyperacute (ie, from ACS = acute coronary syndrome) — vs ST-T wave elevation in leads V1,V2 that is almost certain to reflect LV “strain” from LVH?
ANSWER — I use the Mirror Test! I illustrate this concept in the bottom tracing in Figure-1. Here I’ve taken ECG #2 — and added an insert that has flipped leads V1 and V2 in ECG #2, so as to provide a mirror-image view of these 2 leads.
- DOESN’T the very tall positive wave in the insert, together with the mirror-image shape of these flipped ST-T waves look exactly as you’d expect lateral chest leads to look when there is LVH with “strain”? (PURPLE arrows in “flipped” leads V1 and V2 in this bottom tracing point to the LV “strain”-like appearance in these leads).
- WHY does this happen? ANSWER: We are most familiar with making the ECG diagnosis of LVH from the presence of tall lateral R waves that occur in association with ST-T wave changes of LV “strain” in lateral leads. However, some patients manifest ECG changes of LVH (and LV “strain”) prominently in anterior leads! Leads V1 and V2 are right-sided as well as anterior leads. When the LV (left ventricle) enlarges — right-sided leads may manifest deeper S waves (in response to increased left-sided forces). The ST-T waves in these right-sided leads V1 and V2 may also manifest an “opposite” (ie, mirror-image) picture of the ST-T wave depression that is seen in lateral chest leads with LV “strain”.
- NOTE: In the bottom tracing in Figure-1 — I show an actual mirror-image of the QRST complex in leads V1 and V2 in the insert. With a little practice — you can quickly recognize this pattern (ie, You can learn to mentally “flip over” the QRST complex in leads V1 and V2) — so as to quickly recognize what LVH with “strain” looks like in anterior leads.
- Finally — Some patients manifest ST-T wave changes of LV “strain” in inferior leads. This most often occurs when the frontal plane axis is relatively vertical — but despite a non-vertical axis in ECG #2 — I believe the ST-T wave depression that we see in the inferior leads is most likely to be a manifestation of LV “strain” rather than ischemia because: i) the shape of the ST-T waves in the inferior leads is asymmetric (ie, it descends slower than it rises) — and, this asymmetric shape is most commonly seen with LVH rather than acute ischemia; and, ii) Given that the ST elevation in leads V1 and V2 of ECG #2 is a reflection of LV “strain” in these anterior leads — there is no abnormal ST elevation in ECG #2 (therefore no localized area of the heart for this inferior ST-T wave depression to be “reciprocal” to — as one would expect if acute MI was ongoing).
BOTTOM Line: It’s worth remembering the ECG picture we see in ECG #2 — in which marked LVH with “strain” may produce ST elevation in anterior leads with diffuse ST-T wave depression elsewhere that is not due to an acute cardiac event.
- For another case in which marked ST elevation in leads V1 and V2 could easily be mistaken for a hyperacute change — See the Figure I drew in My Comment at the bottom of the December 27, 2018 post on Dr. Smith’s ECG Blog.
- For more on “My Take” regarding the ECG diagnosis of LVH — CLICK HERE.
- P.S. — It is also worth remembering the ECG picture we see in ECG #1 — in which failure to realize that QRS amplitude has been “cut short” in this prehospital ECG can easily lead to mistaking the ST-T waves in leads V1 and V2 as hyperacute.
Our THANKS to Dr. Smith for presenting this instructive case!
![]()