Submitted by Evan (Kuan-Yu) Lin, edits by Willy Frick
This ECG had been recorded in cardiology clinic:
What do you think?
Here is the case:
An 84-year-old male with hypertension, hyperlipidemia, lichenoid reaction to losartan presented to the ED with chest pain that awoke pt from sleep at 2:30AM. Patient stated he got up to use the bathroom and started feeling left-sided substernal chest pain radiating to the left and right as well as down towards the epigastric area with associated shortness of breath. The pain was unrelenting, characterized as 8/10 pressure-like, prompting his wife to drive him to the ED. Patient stated he has never had an episode like this before. The pain lasted till when he arrived at the hospital at around ~5 am. In the ED, presenting vital signs initially hypertensive 160/80. Patient stated his chest pain began to improve as he arrived to the ED and completely resolved after receiving nitroglycerin, ASA 325 mg, clopidogrel 600 mg and heparin gtt.
Patient is a never smoker. Per wife at bedside, patient takes his medication religiously but was recently switched off of losartan by outpatient dermatologist as they had determined the ARB was the main culprit of lichenoid reaction.
Lichenoid reaction: the pathogenesis involves a cytotoxic T-cell-mediated immune response targeting basal keratinocytes, often triggered by drugs, infections, or contact allergens.
For any patient who presents to the hospital with chest pain and shortness of breath ACS, PE, aortic dissection and pneumothorax are can’t miss diagnoses.
Patient’s CXR, CT PE and CT abdomen and pelvis had no acute findings. There was a penetrating aortic atherosclerotic ulcer at the level of the kidneys, bilateral aneurysmal common iliac arteries likely secondary to chronic hypertension and hyperlipidemia. First high sensitivity troponin T (hsTnT) at 0609 was 21 ng/L (normal). [URL is 14 ng/L for women and 22 ng/L for men)
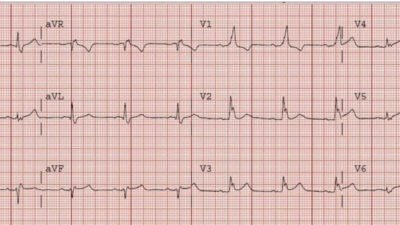
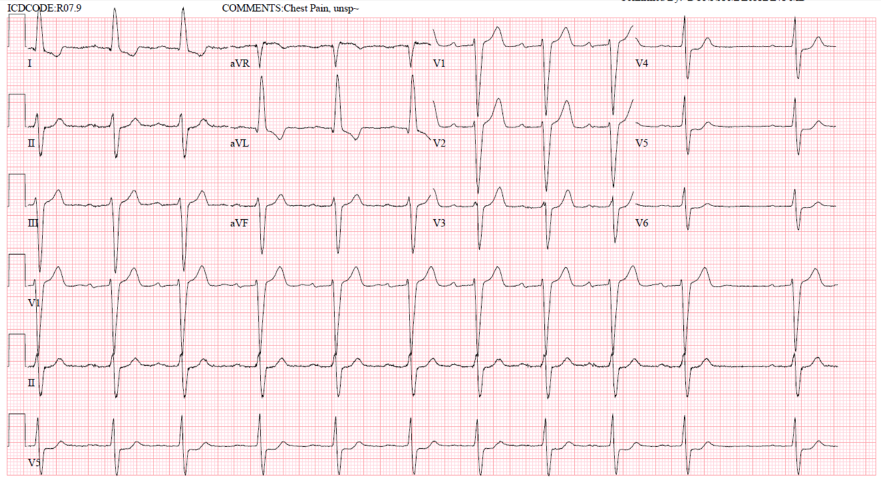
Presenting EKG 1 with improving chest pain at 5:18am
What do you think?
Smith (similar to Willy’s interpretation below): There is high voltage and an intraventricular conduction delay (IVCD). There is subtle ischemic ST depression in V3-V6, and it is also concordant to a deep wide S-wave in V3, and to a less deep, but still wide S-wave in V4-6. The ST depression in I and aVL is Non-ischemic appearing, typical of the repolarization abnormalities of LVH (or IVCD).
This ST depression in V3-6 is diagnostic of ischemia. Since there are no signs of OMI, we would classify this as subendocardial ischemia (SEI).
The Queen of Hearts is negative for OMI.
Smith: I ran it through our latest AI Model (unavailable to others) and the Queen of Hearts diagnoses SEI (model value = 0.599). If you compare to the ECG from clinic, there is clear pseudonormalizationof T-wavesin III and aVF.
Willy: In the context of high-risk chest pain, this is a concerning EKG. There are features of LVH (R wave in aVL), so it could be tempting to dismiss the lateral repolarization changes as strain. However, LVH strain pattern is typically characterized by ST depression and T wave inversion in inferolateral leads. This could explain I and aVL, but the STD in the lateral precordium here is associated with abnormally upright T-waves. Moreover, LVH “strain” pattern does not produce STD in V3; it is typically limited to the lateral precordium (Smith: and LVH STD is not concordant to the majority of the QRS).
Is all of this definitive for OMI? No, it could be subendocardial ischemia. But given that the patient’s chest pain was improving when this EKG was obtained, we are left wondering what the EKG would have shown 20 minutes prior to hospital arrival.
Regardless of the ECG, to the provider, this presentation was extremely concerning. Any sleep-awakening chest pain should be addressed with utmost vigilance, as pre-test probability is very high. It is also essential to recognize that acute coronary syndrome is a dynamic process—both anatomically at the coronary level and electrically. As such, a single EKG snapshot may appear deceptively ‘normal.’ As you will see, this case highlights the nuanced beauty of EKG interpretation, which often illuminates the evolution of acute coronary syndromes, and exemplifies why I developed such a deep passion for ECG and cardiology.
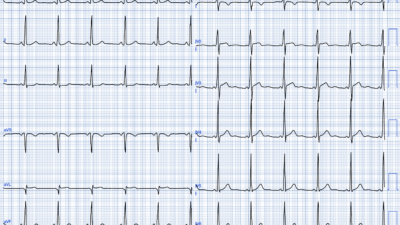
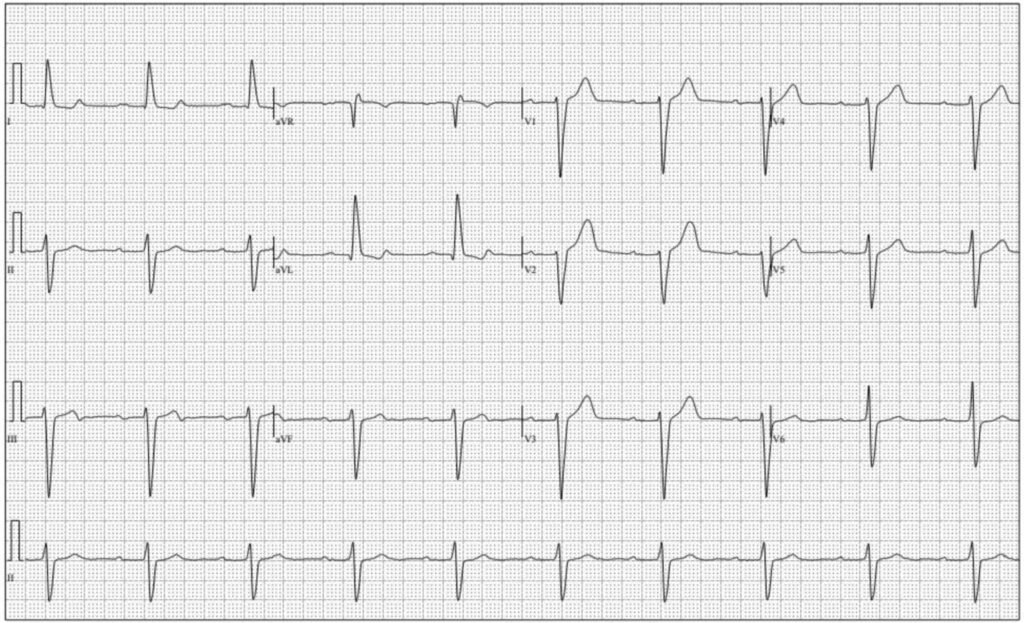
For reference, EKG 2 – baseline EKG just four days prior at the cardiology office. Patient was seen at office for follow up without any cardiovascular symptoms. There was no clear documentation whether patient had been experiencing chest pain; though interestingly, a nuclear stress test was ordered.
EKG 2, obtained four days prior (the one at the top of the post!)
Willy: In the context of the current presentation, this EKG is extremely suspicious bordering on diagnostic for reperfused inferoposterior occlusion MI. There is terminal T wave inversion in lead III with reciprocal down-up T waves in I and aVL. Additionally, the T waves in V1-2 are overly upright due to posterior reperfusion. This is likely an unstable lesion with recurrent occlusion and spontaneous reperfusion. And likely something in the patient’s clinic presentation led the cardiologist to order a stress test.
Case continues:
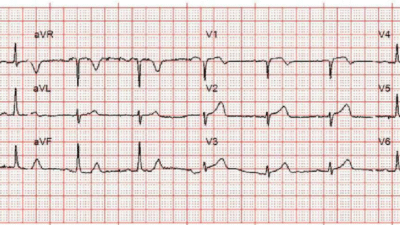
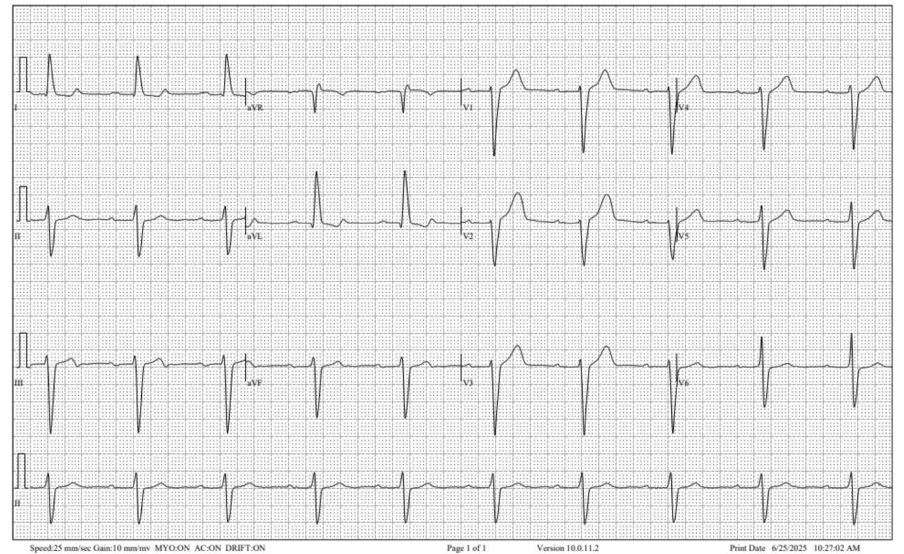
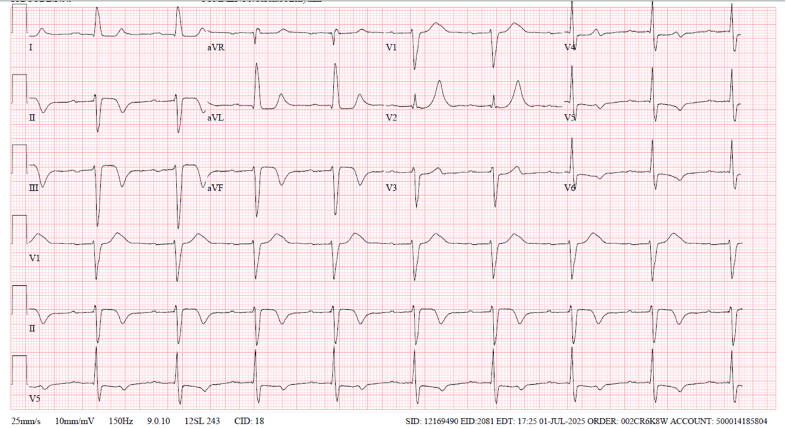
EKG 3 at 5:53am s/p nitroglycerin, DAPT, and heparin gtt
Evan: Arguably the most interesting EKG here. EKG 3 shows interesting biphasic reperfusion changes, inferiorly AND overly upright T wave in V2-V3. Admittedly, I did not know about the reciprocal reperfusion changes for V2-3.
This is the EKG that I had sent to Willy. Willy had provided so many pearls throughout my educational journey, and this is another example where he pointed out the voluminous looking T-wave in V2-3 are reciprocal reperfusion T-wave changes for a posterior injury. Although the presenting EKG was non-specific, the presenting history was concerning in itself. As stated above, OMI can often presently with ‘deceptively normal EKG’ (EKG 1), as we are not sure the chronicity of the ACS event. However, the dynamic reperfusion changes of biphasic T-wave inferiorly and the overly upright T-wave in V2-3 are diagnostic for a posterior inferior pattern, suggestive of RCA culprit.
Queen of Hearts correctly identifies this as a reperfusion pattern.
There is reperfusion of coronary artery via patient’s endogenous thrombolysis and the antiplatelet agents preventing further aggregation of platelets. HsTnT as below further reflected myocardial infarction:
0936: 77 ng/L
1445: 309 ng/L
1753: 532 ng/L
Following day 0111: 647 ng/L
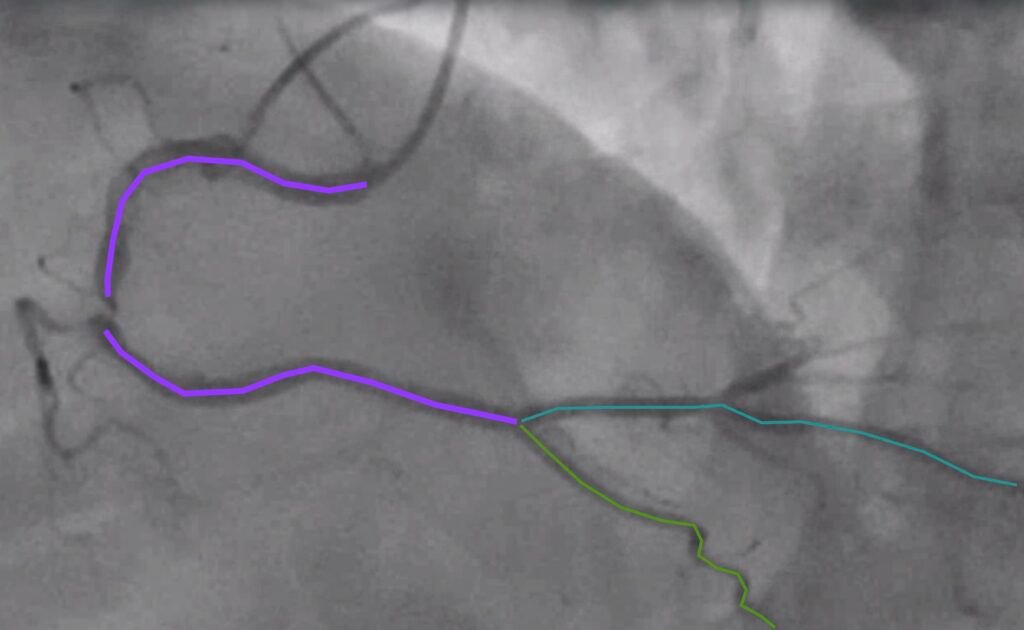
LAO cranial view of RCA
Annotated still image showing critical lesion (with TIMI 3 flow) consistent with our ECG showing reperfusion
Post PCI of RCA
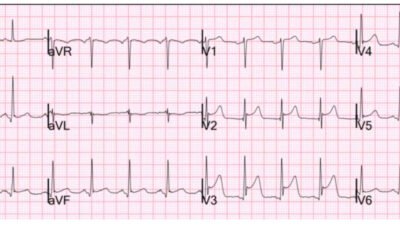
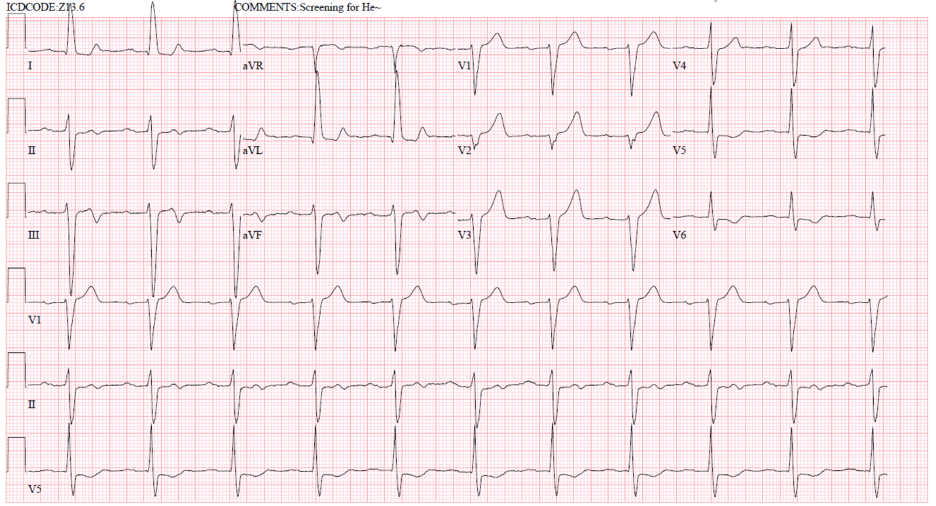
EKG 4 post-PCI
EKG 4: More reperfusion findings. The biphasic T wave now progressed to deeply inverted T wave.
Outcome:
Patient underwent successful PCI to RCA for a critical lesion with TIMI 3 flow, rest of the coronaries shows mild-moderate disease. Although there is spontaneous reperfusion of the culprit lesion, TTE showed inferior WMA with EF of 35-40%. Patient was discharged with BB, ACEi, DAPT, and rosuvastatin with plan for outpatient follow-up the next day.
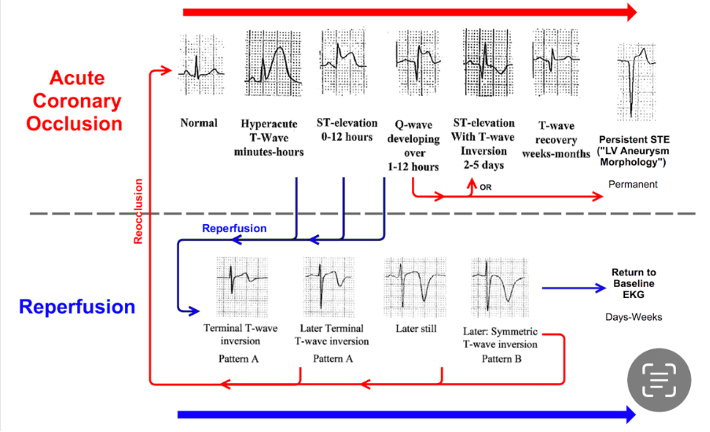
Here is a great cheat sheet of reperfusion progression:
Learning points:
- Pre-test probability can outweigh a “negative” test. Smith: true, even if this was not really a negative ECG (it showed SEI)
- OMI can present with very unimpressive EKG, or rarely even a normal EKG
- Initially troponin can be normal in ACS
- You must always obtain serial ECG along with serial troponin
- Recognize the dynamic nature of reperfusion findings
- Biphasic T waves become increasingly negative with reperfusion
- Overly upright T waves in V2-3 are reciprocal to posterior T wave inversion. Smith first described these and proved what they represent: Posterior reperfusion T-waves: Wellens’ syndrome of the posterior wall.
- Here are a couple more examples of posterior reperfusion T-waves: 2 Examples of Posterior Reperfusion T-waves
= = =
======================================
MY Comment, by KEN GRAUER, MD (1/9/2026):
Confession: I fully acknowledge that I did not initially see all of the ECG findings that I describe below in today’s initial ECG. It’s good to be humbled periodically — as I believe this serves as an excellent reminder to be ever diligent, not only with the details found on each ECG — but also as a reminder to retrospectively go back and review your interpretations after you learn what happened (and after you see how serial ECGs evolved).
- This is indeed a challenging and important case.
- My principal oversight = not paying enough attention to the history. at the time I assessed the initial ECG.
Regarding the History in today’s case:
- The patient is an older man (84 years old) — who was awakened from sleep by unrelenting CP (Chest Pain) that he rated 8/10 in severity — and, which he never had before.
- The patient’s wife drove him to the ED — with his CP improving on arrival in the ED. His CP was totally gone 35 minutes later (ie, at the time the repeat ECG was recorded).
KEY Point: I did appreciate that new-onset CP in an older man immediately places him in a higher-risk group for having a new acute event. But in my haste — I failed to fully take into account how spontaneous improvement in this patient’s symptoms before his arrival in the ED (and therefore before the initial ECG was recorded) — how this needs to alter our expectation as to what the initial ECG may show!
- Significant improvement in CP severity often heralds the onset of spontaneous reopening of the “culprit” vessel (ie, the onset of spontaneous reperfusion).
- As a result — ECG findings in the initial ECG may be modest. And, if the timing of the initial ECG just happens to correspond with the period in between acute ST elevation and T wave inversion from spontaneous reperfusion — then the initial ECG may look surprisingly unremarkable ( = the period of “pseudo-normalization”). Therefore — even minimal ST-T wave abnormalities may be important!
= = =
Today’s Initial ECG:
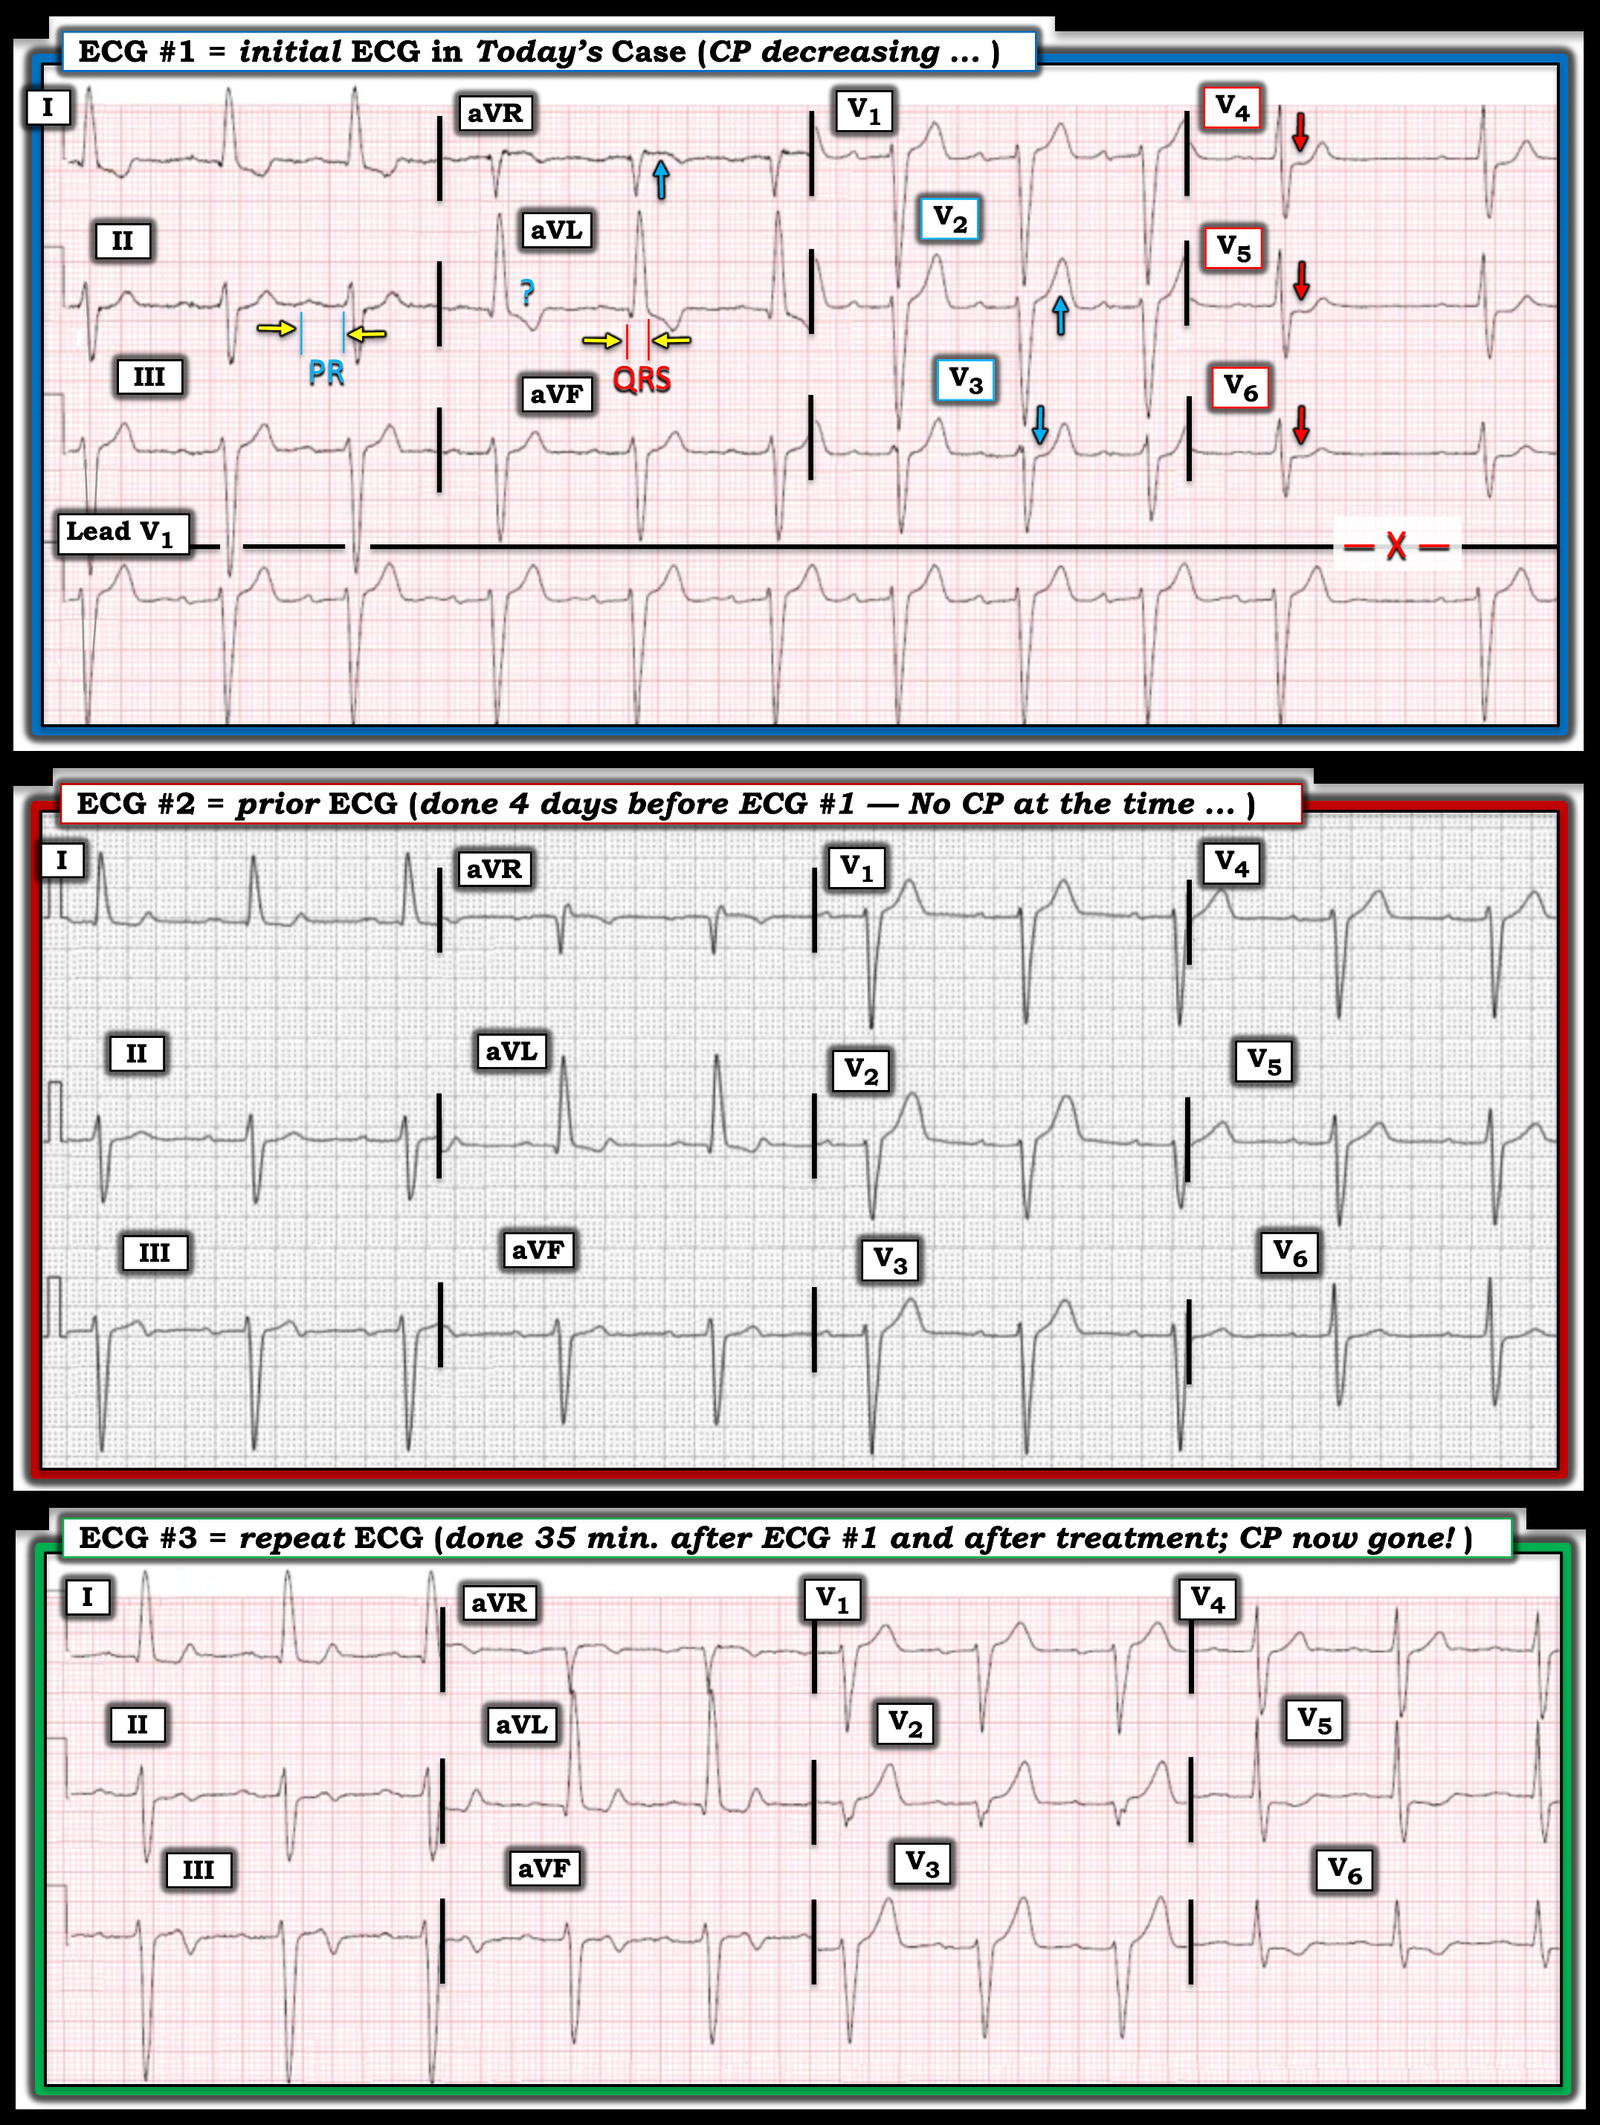
For clarity and ease of comparison in Figure-1 — I’ve put the first 3 ECGs in today’s case together. I’ve labeled ECG findings of note in the initial ECG.
- The mechanism of the rhythm (as seen in the long lead V1 rhythm strip at the bottom of ECG #1) — is sinus. That said — R-R intervals vary from one beat to the next, with abrupt slowing before the last beat (this longer-than-expected R-R interval is highlighted by the “X” at the end of the tracing). I’d interpret this as sinus arrhythmia — with no indication of AV block or a blocked PAC as the cause of sinus slowing. Instead — I thought the beat-to-beat variation in R-R intervals with surprising slowing at the end of the rhythm strip suggests increased vagal tone (which may be relevant in today’s case given the final diagnosis).
Regarding intervals (PR-QRS-QTc):
- The PR interval is prolonged (almost 1.5 large boxes in duration — or just under 0.30 second in duration). Thus, there is 1st-degree AV block (See my PR interval measurement in lead II of ECG #1).
- The QRS complex is wide ( = at least 0.13 second in duration — as per my QRS measurement in lead aVL of ECG #1). This is relevant to today’s case — as ECG assessment for acute ST-T wave changes is rendered more difficult with intraventricular conduction defects.
- The QTc looks normal.
- QRS morphology is consistent with LAHB (Left Anterior HemiBlock) — given the qR pattern in leads I,aVL and the rS pattern with predominant negativity in all inferior leads.
- The very tall R wave in lead aVL ≥12 mm (as well as the deep S waves in leads V1,V2) suggest LVH. That said, even with both LAHB and LVH — we would not usually expect QRS widening to the extent seen in ECG #1 (Usually LAHB and LVH increase QRS duration by no more than 0.015 second). This suggests that some form of IVCD is probably present, here with a leftward axis (ie, with IVCD rendering interpretation of acute ST-T wave changes to be more challenging).
Regarding ST-T wave changes:
- My “eye” was drawn to the ST segment flattening and slight-but-real ST depression that is subtle but unmistakeable in leads V4,V5,V6 (RED arrows in these leads). In an older adult with new-onset severe CP — there is no way that this finding in these lateral chest leads is “normal”.
- In the context of what we see in leads V4,V5,V6 — neighboring lead V3 is also abnormal (the BLUE arrow in this lead highlighting loss of the normal slight ST elevation that is usually seen in lead V3).
- Although admittedly hard to define “proportionality” for the T wave in neighboring lead V2 given QRS widening and the deep S waves in leads V1,V2 — the T wave in lead V2 still looks larger than I would expect.
- I was less sure about whether the depressed ST-T wave in lead aVL was overly “bulky” (ergo my BLUE question mark in this lead).
- The BLUE arrow in lead aVR highlights ST elevation in this lead. Given abnormal ST depression in 4 of the chest leads — this may represent subendocardial ischemia in a patient likely to have multivessel disease.
My Impression of ECG #1: I initially interpreted the above ECG findings as suspicious but non-diagnostic. Given the history of sudden and severe new-onset CP in this 84-year old man — but with reduced CP by the time ECG #1 was recorded — I’d amend my initial impression as much more concerning for an acute event than I initially thought.
= = =
Figure-1: Comparison of the first 3 ECGs in today’s case.
= = =
2 Ways to Confirm the Diagnosis:
The “good news” in today’s case — is that there are 2 ways to confirm the diagnosis of an ongoing acute OMI (and the need for timely cardiac catheterization): — i) Find a prior ECG on this patient that you can compare with today’s initial ECG; — and/or — ii) Get a repeat ECG! (that given the changing severity of CP since arriving in the ED — should ideally be obtained within 15-20 minutes after ECG #1 was recorded).
= = =
The ECG done 4 Days Earlier ( = ECG #2 ):
As per Dr. Frick — ECG #2 was obtained 4 days earlier in the office, with the patient reportedly without any symptoms at that time. That said — the fact that an ECG was done in the office and that a nuclear stress test was ordered — makes me suspect that this patient had not been truly “asymptomatic” at the time of this office visit 4 days before ECG #1 was recorded.
- Lead-by-lead comparison in Figure-1 between ECG #1 and ECG #2 reveals differences in multiple leads. The rhythm in ECG #2 is sinus at ~60/minute, still with 1st-degree AV block — but with complete regularity of the rhythm, and without any pause (which I thought is consistent with the probability that increased vagal tone was operative in ECG #1).
- As per Dr. Frick — high-lateral lead ST depression in ECG #2 is not nearly as marked as it is in ECG #1.
- T wave amplitude in the inferior leads is much less in ECG #2 — with terminal T wave negativity in lead III (which is matched by the mirror-image opposite picture of terminal T wave positivity in lead aVL, as well as in lead I). These look like T wave reperfusion changes.
- There is no ST depression at all in leads V3-thru-V6 of ECG #2 (as well as no significant ST elevation in lead aVR).
- That said — the most “eye-catching” finding to me — is the distinctly “fatter” T wave peaking in lead V2 in ECG #2.
- My Impression: I suspect this patient already had an acute event 4 days earlier at the time ECG #2 was recorded (now showing some T wave reperfusion changes). But at the very least — there have been diagnostic interval ST-T wave changes that are now seen in today’s initial ECG compared to the ECG done 4 days earlier at this patient’s office visit.
= = =
The Repeat ECG ( = ECG #3 ):
It’s remarkable how much has changed during the 35 minutes that passed between the recording of today’s initial ECG — and the repeat ECG:
- The limb leads in ECG #3 clearly show reperfusion T waves, consistent with inferior OMI (terminal T wave inversion now seen in leads II,III,aVF — and marked terminal T wave positivity in high-lateral leads I,aVL).
- Anterior lead T waves in ECG #3 are disproportionately larger than they were in ECG #1, consistent with posterior wall reperfusion.
- Reperfusion T wave inversion is now also seen in lateral chest leads V5,V6 of ECG #3 — consistent with lateral OMI.
- My Impression: The “dynamic“ ST-T wave changes that have occurred during the 35 minute period between the recording of ECG #1 and ECG #3, in association with complete resolution of CP during this time period — is diagnostic of infero-postero-lateral OMI, now with reopening of the “culprit” RCA artery in this patient who is now pain-free.
- The fact that similar (albeit less marked) reperfusion T wave changes were seen 4 days earlier (on ECG #2) — but were no longer present on today’s initial ECG — yet returned on today’s repeat ECG done 35 minutes after ECG #1 — strongly suggests this patient had ongoing infarction with a “stuttering” course in which the “culprit” RCA has occluded and reopened a number of times. Cardiac cath with definitive PCI is indicated to stabilize and preserve reperfusion.
= = =
= = =