An elderly woman with h/o stroke and aphasia seemed different to her daughter, and was pointing all over her body as if in pain.
They called 911.
She had a history of PCI to the circumflex and also of severe mitral regurgitation, status post bioprosthetic valve replacement. Also a h/o LV aneurysm with thrombus, on anticoagulation, as well as a dual chamber pacemaker.
On arrival, the BP was 60/30.
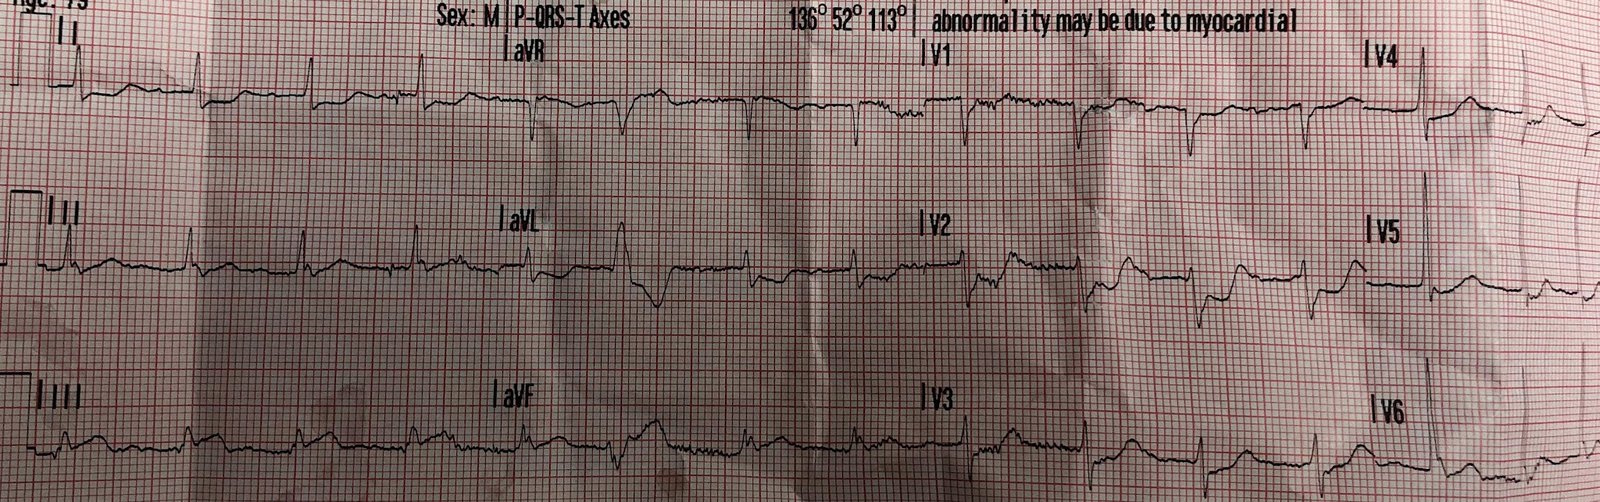
Here is the initial ECG:
 |
| There is atrial pacing and Right Bundle Branch Block (RBBB) There is STE in I and aVL, V5, V6, with reciprocal STD in II, III, aVF There is appropriately discordant ST depression in V1-V3 (appropriate to RBBB)
|
The cath lab was activated.
Here is the bedside echo (POCUS): Short Axis
Extremely poor LV function and massive wall motion abnormality
Long Axis
Extremely poor LV function and massive wall motion abnormality
Dr. Dick Asinger and Gopal Punjabi (@spectralCT) also points this out:
The parasternal long axis isn’t tough–there is a pseudo aneurysm of the inferior wall with thrombus–likely from old circ infarct.
See the outpouching at the bottom of the image.
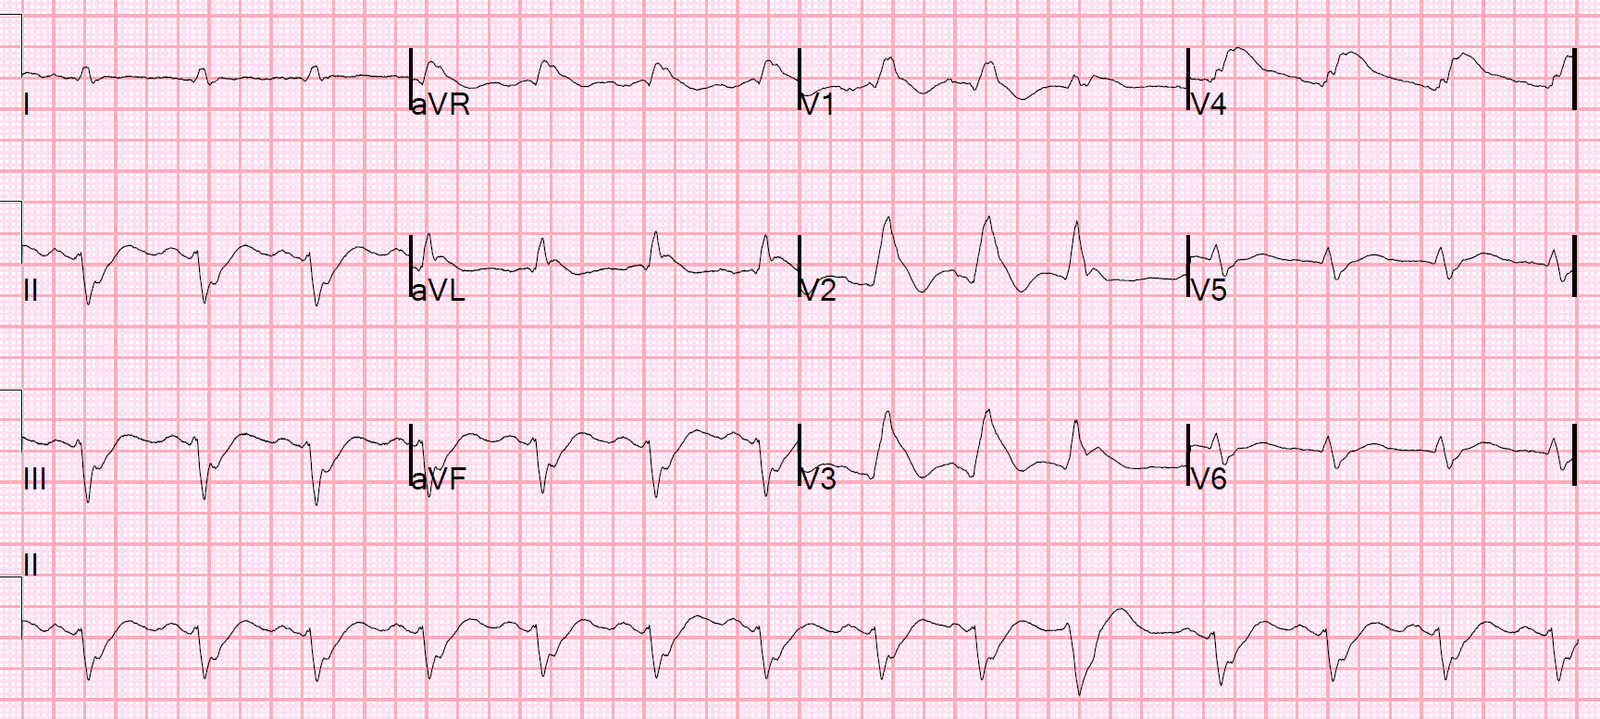
At 20 minutes, just before cath, another ECG was recorded:
 |
| More (worsening) STE |
Her initial troponin I returned at 0.341 ng/mL (URL = 0.030 ng/mL) (not per L, not high sensitivity)
Lactate was 3.7 mEq/L
Her BP with pressors came up to 80, then 100.
Angiogram showed a 99% left main thrombotic occlusion with TIMI-1 flow (this is considered “occlusion” even though there is some flow. It was opened and stented with resulting TIMI-3 (normal) flow.
The stent to LCX is patent. OM1 is occluded and OM2 has 60% stenosis. Her RCA is a medium caliber vessel with tandem, at least moderate stenosis in the mid segment.
A balloon pump was placed.
Post cath echo:
left ventricular wall thickness and severely reduced systolic function.
The estimated left ventricular ejection fraction is less than 10 %.
Regional wall motion abnormality-anterior, anterolateral and inferolateral, akinetic/dyskinetic.
Aneurysm of the mid-portion of the lateral and inferolateral wall. No evidence for LV thrombus, probable.
Previous EF had already been low at 15%
Troponin profile:
 |
| This is in ng/mL (NOT ng/L !!!). This is equivalent to over 2 million ng/L. The highest troponin I that I had ever seen prior to this was 500 ng/mL. This is more than 4x as high! A Huge Infarct |
Left Main occlusion can have many different ECG patterns. Here are many other examples:
How does acute left main occlusion present on the ECG? (Many example ECGs of true left main occlusion)
ST Elevation in Lead aVR, with diffuse ST depression, does not represent left main occlusion
ST-Elevation in aVR with diffuse ST-Depression: An ECG pattern that you must know and understand! (not left main occlusion
![]()
===================================
MY Comment by KEN GRAUER, MD (1/16/2020):
===================================
I did not correctly identify the “culprit artery” in this case. When I didn’t — I went back to the August 9, 2019 Post that Dr. Smith references in his comments above. It makes for impressive reading.
- It will not be often that emergency providers encounter patients with acute LMain occlusion — simply because survival of most of these patients is so limited. Because time until treatment is so critical — it is worth reviewing lessons learned regarding the ECG presentation of patients with acute LMain occlusion.
I have summarized the major points from Dr. Smith’s 8/9/2019 post in Figure-1. The KEY Take Home Points are as follows:
- There is no “single” ECG presentation for patients with acute LMain occlusion. Quite literally — You can see almost anything!
- The reason for this highly variable ECG presentation, is that multiple territories may be involved to varying degrees — making it impossible to predict how much ST elevation you will see — and how much opposing (reciprocal) ST depression will attenuate (if not completely cancel out) these initial ST segment vector forces.
- The ST-T wave appearance in lead aVR can be anything when there is acute LMain occlusion.
 |
| Figure-1: Reasons for the varied ECG presentation of acute LMain occlusion — excerpted from Dr. Smith’s 8/9/2019 post (See text). |
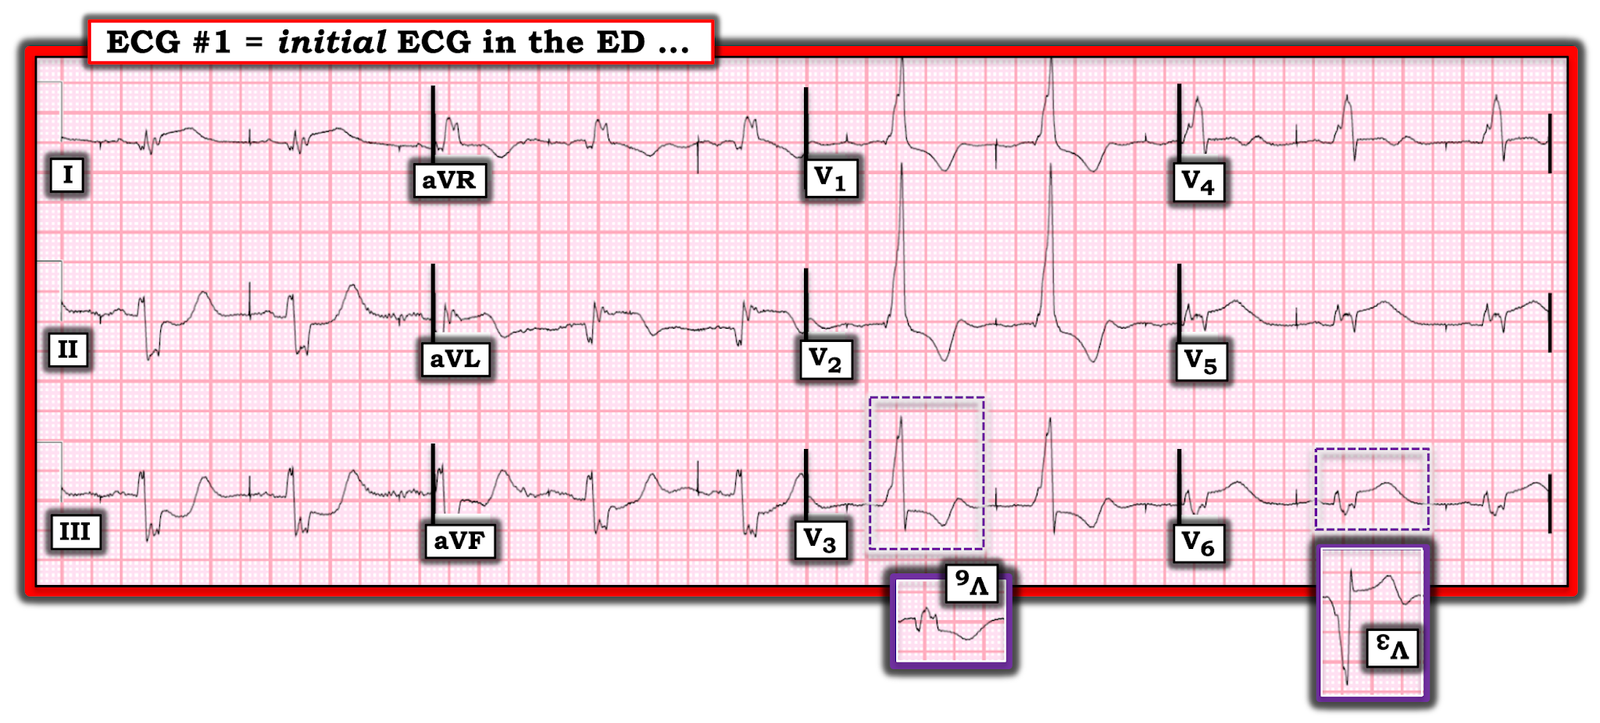 |
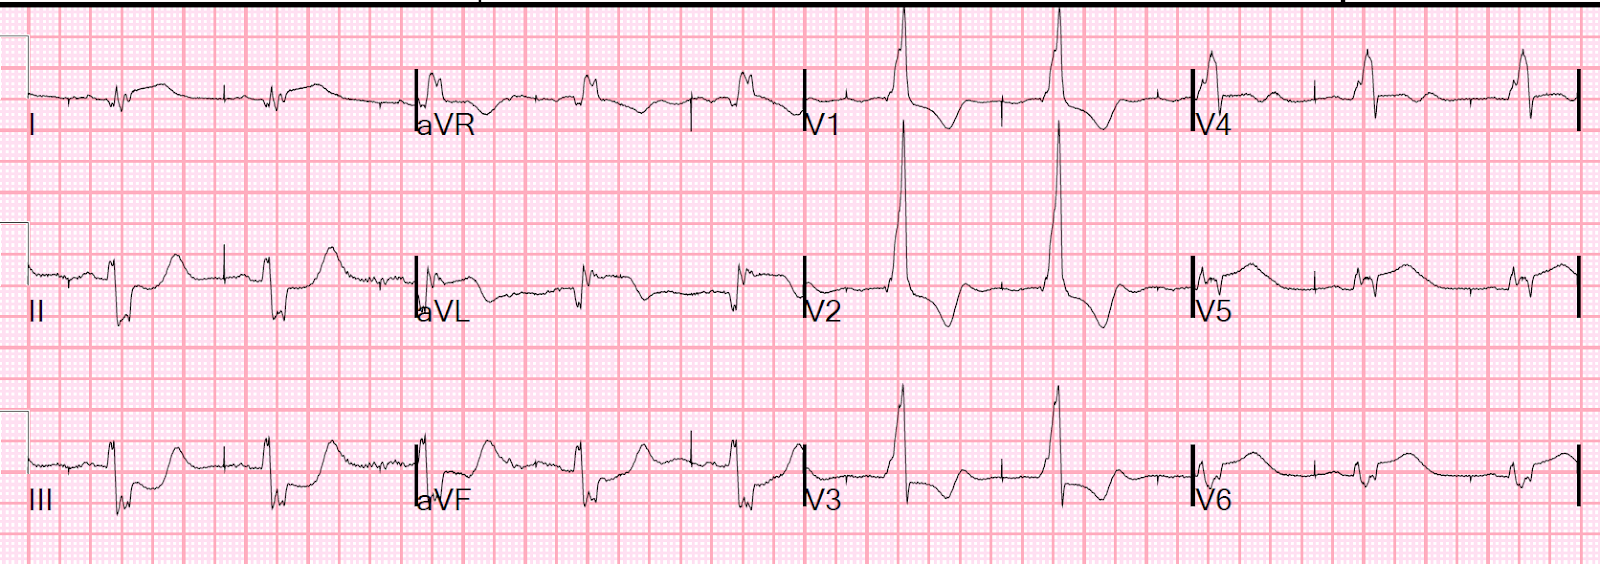
| Figure-2: The initial ECG in this case (See text). |
I then took another look at the initial ECG in this case ( = ECG #1 in Figure-2). I noted the following:
- As per Dr. Smith — there is atrial pacing, with conduction of paced P waves in the form of RBBB. There is also LAHB (predominant negativity of the QRS in each of the inferior leads).
- The QRS complex is markedly prolonged (to over 0.16 second) — with marked and unusual fragmentation. This amount of QRS prolongation + fragmentation defines the presence of severe underlying heart disease — which is not at all surprising given the patient’s advanced age + history of coronary disease, valvular heart disease, history of LV aneurysm + permanent pacing.
- In addition to the fragmentation — there is evidence of prior infarction in the form of deep and wide Q waves in high lateral leads I and aVL (consistent with prior PCI to the LCx).
- There is suggestion of small initial q waves in leads V1 and V2 — consistent with likely prior septal infarction.
With all of this evidence of severe preexisting heart disease — it can be very challenging to look at an initial ECG (when no prior tracing is available) to determine, What is New vs Old? I was impressed by several observations I made in Figure-1:
- The shape of the ST-T wave in each of the inferior leads of ECG #1 clearly looks acute! The “scooping” we see toward the end of the depressed ST segment (especially in leads II and III) — then rising to a terminally peaked and enlarged T wave is simply not a longstanding finding.
- The nearly mirror-image opposite ST-T wave picture in lead aVL (compared to lead III) + the ~2mm of J-point ST elevation with ST segment straightening in the other lateral leads (ie, leads I, V5, V6) — suggested LCx (Left Circumflex) occlusion — but WHY so much inferior reciprocal change?
- As per Dr. Smith — the ST-T wave depression seen in leads V1 and V2 is perfectly consistent with appropriate discordance from the RBBB. BUT — WHY then is there more J-point ST depression in lead V3 (within the dotted PURPLE rectangle) than there is in leads V1 and V2 that typically show the most marked appropriate discordance with simple RBBB?
- I was struck by the shape of the depressed ST-T wave in lead V3. Isn’t the shape of this depressed ST-T wave in lead V3 (within the dotted PURPLE rectangle) a virtual mirror–image opposite of the shape of the ST-T wave elevation that we see in lateral chest leads V5 and V6? (Compare mirror-image views of these ST-T waves in leads V3 and V6 within the inserts outlined in PURPLE).
Putting It All Together: I fully acknowledge that I did not predict acute LMain occlusion as the “culprit artery” in this case. That said — considering the relationships summarized by Dr. Smith in Figure-1 — what we are seeing in ECG #1 could be consistent with a number of ECG findings of acute LMain occlusion:
- New bifascicular block (RBBB/LAHB).
- Marked acute STEMI changes in no less than 4 lateral leads.
- Disproportionately marked reciprocal ST-T wave changes in all inferior leads.
- Probable cancellation of oppositely-directed forces in anterior leads V1 and V2. I wouldn’t expect J-point ST depression to be more in lead V3 than in V1 and V2 (nor would I expect the mirror-image opposite ST-T wave picture in lead V3, compared to leads V5 and V6) — unless some of the anterior ST elevation from acute LMain occlusion was being cancelled out by acute posterior involvement.
![]()