K. Wang, MD
Clinical Professor of Medicine
Cardiology Division
University of Minnesota
med.umn.edu/cardiology/faculty/wang/home.html
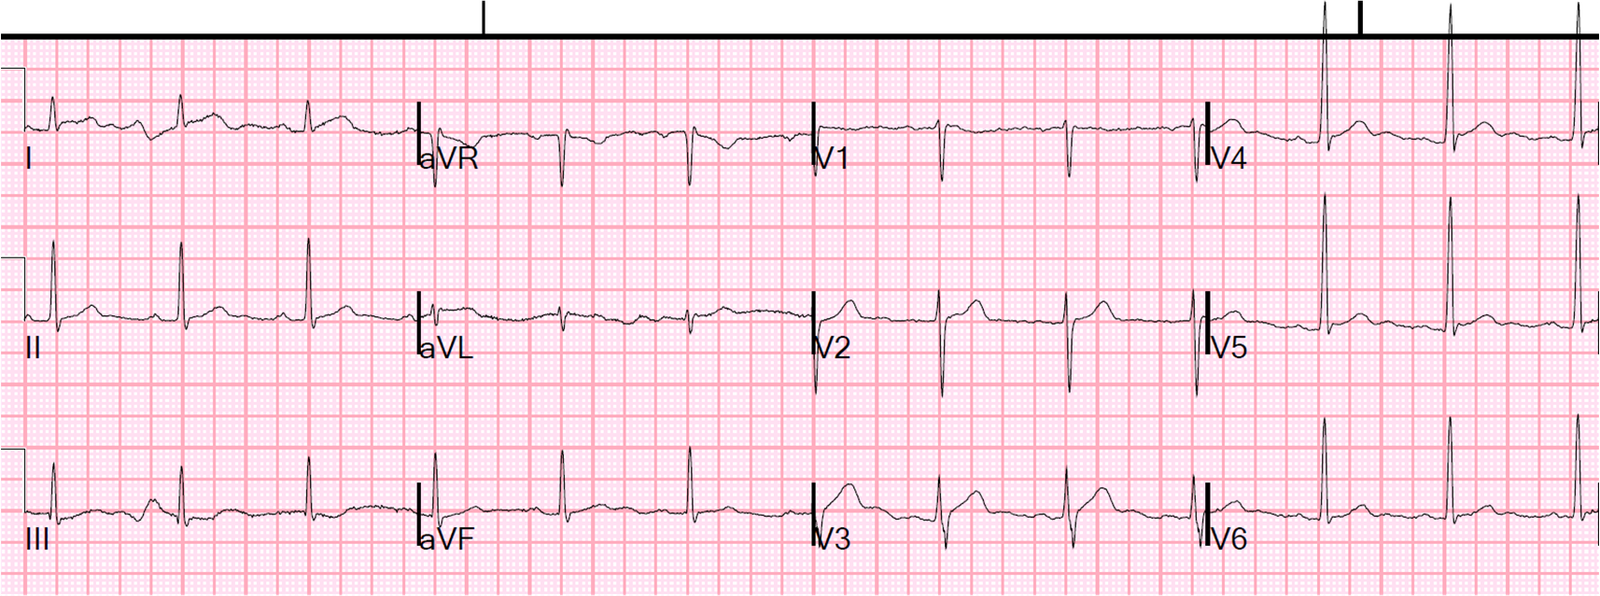
Here is the main tracing in high resolution:

Associate Editors:
— Pendell Meyers & Ken Grauer (2018)
— Jesse McLaren & Emre Aslanger (2022)
— Willy Frick (2024) — Sam Ghali (2025)

K. Wang, MD
Clinical Professor of Medicine
Cardiology Division
University of Minnesota
med.umn.edu/cardiology/faculty/wang/home.html
Here is the main tracing in high resolution: