For couple very interesting related posts, click here.
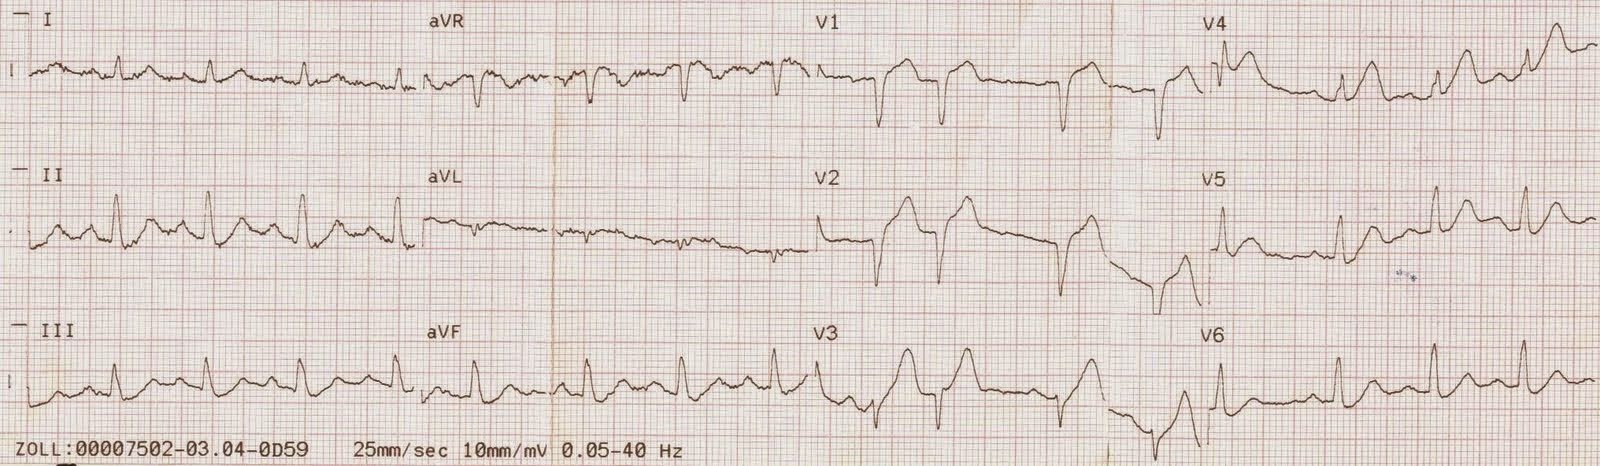
A 76 year old male presented with chest pain. Here is the initial ECG:
 |
|
|
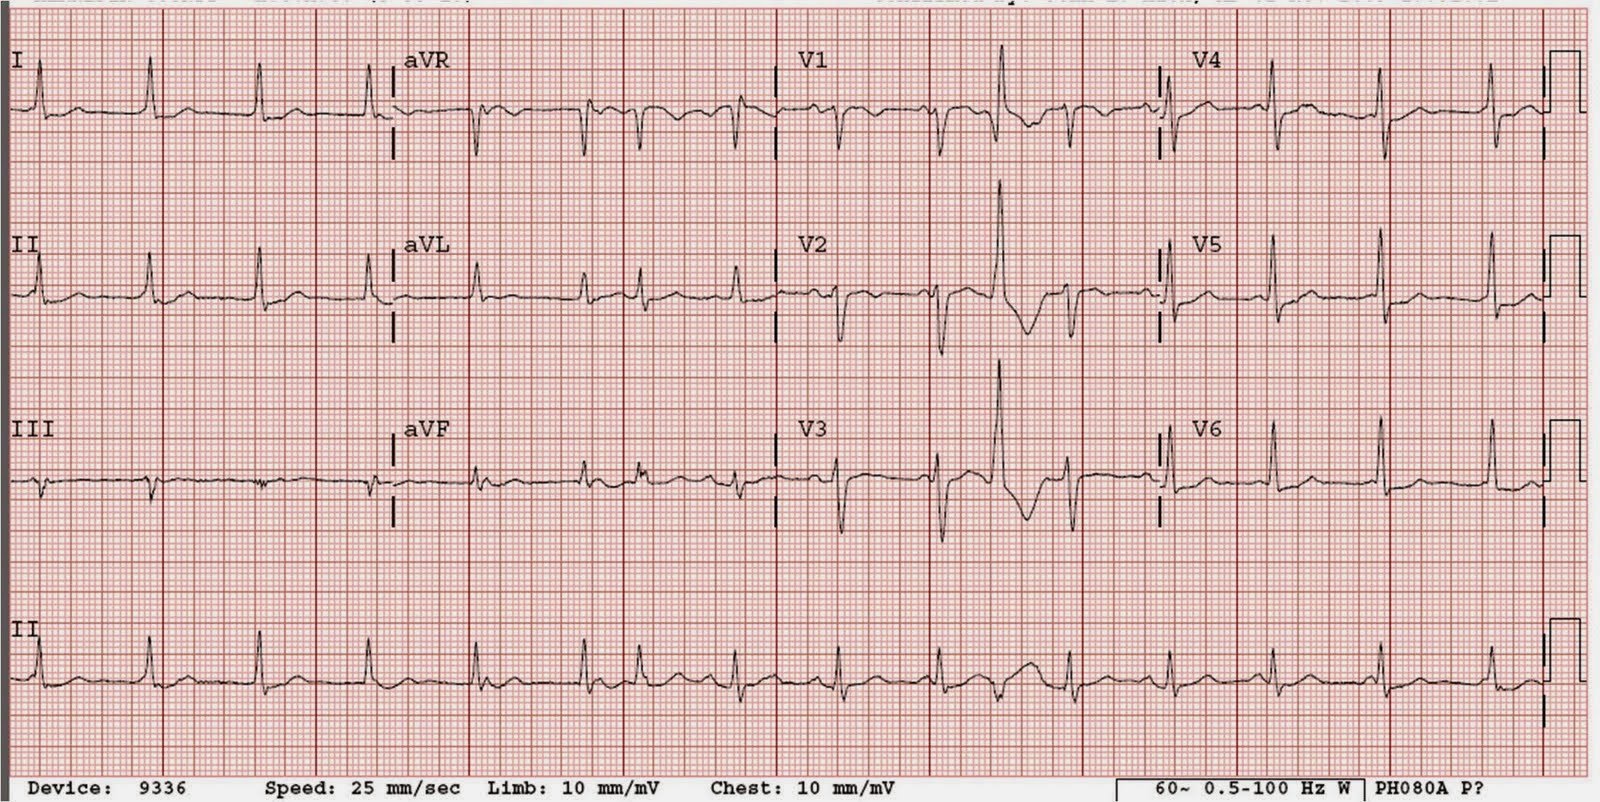
Here the p-waves are highlighted by arrows:

Answer to artery:
First, the patient was hypotensive, which should clue you in to Right ventricular infarction. The ECG diagnosis of RV MI is made by ST elevation in lead V1. Indeed, at angio, there was a proximal RCA occlusion.
Answer to rhythm:
Notice the p-waves are inverted! Thus, they are retrograde. (or there is a low atrial pacemaker and 3rd degree block, and sinus brady, and junctional escape). Look closely: p-waves are progressively later after each QRS. Thus, the R-P interval is increasing. This is junctional rhythm with retrograde Wenckebach (RP interval steadily increasing). Unfortunately we do not have a long enough rhythm strip; if we did, it would eventually show a dropped p-wave!!
For a comprehensive explanation, I have copied below (with permission) from Kyuhyun Wang’s great Atlas of Electrocardiography. Here he explains it in the context of an “echo beat”. First, he explains the echo beat, then he shows a case of retrograde Wenckebach with an echo beat.