The formula for differentiating early repol and anterior STEMI requires one measurement which many have found difficult to understand.
Here is the paper we published on the topic.
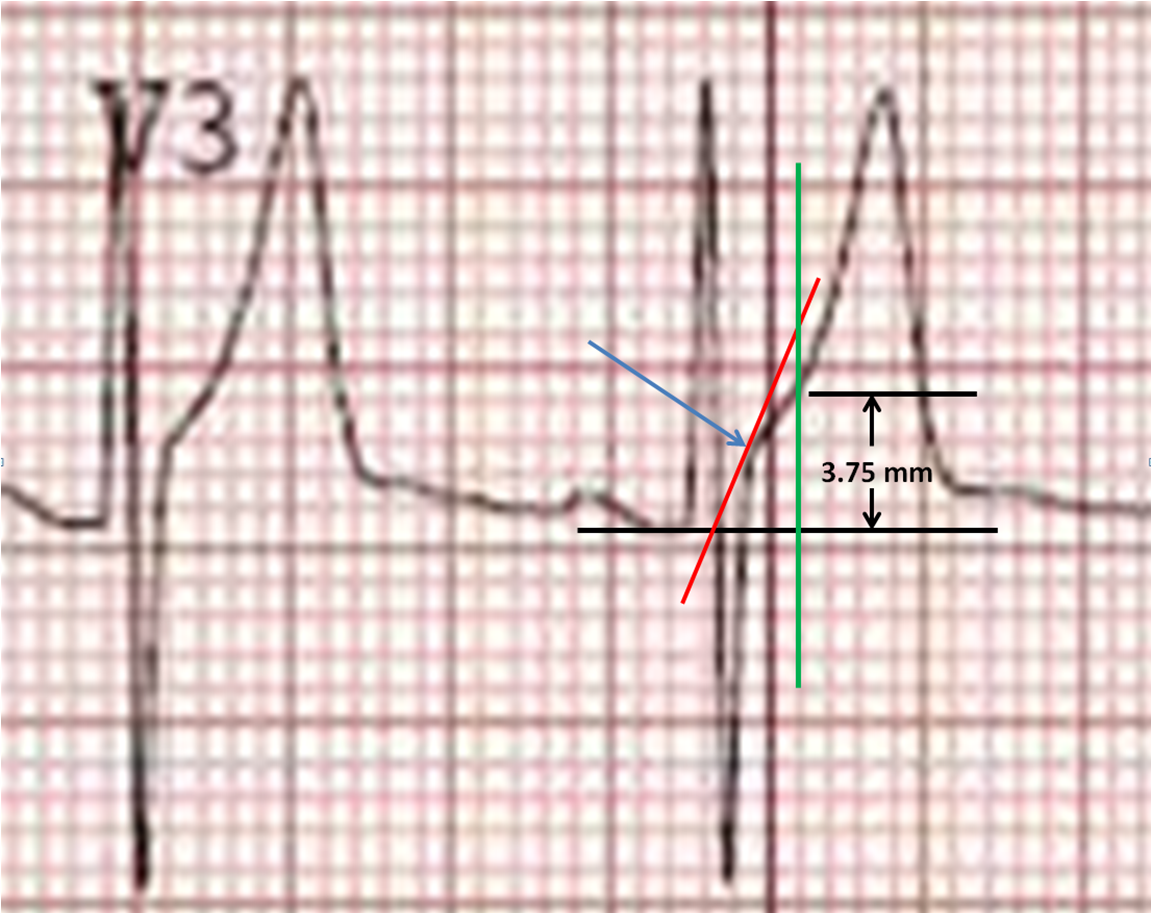
Here is a diagram to demonstrate the measurement:
 |
|
| Lower black line: PR segment. Red line: tangent to the tracing, where the angle on either side of the tangent is equal; this is the J-point (end of the QRS and beginning of the ST segment). Blue arrow: points to the J-point. Green line is 1.5 little boxes, or 60 milliseconds, after the J-point. Upper black line intersects the tracing where the green line demonstrates 60 ms after the J-point. Measure voltage difference (black arrows) (1 mm = 0.1 mV, but we measure in mm) between black lines. So the STE at 60 ms after the J-point in lead V3 = 3.75 mm here. It is usually not possible to be more accurate than 0.5 mm, but here it is so enlarged that one can do it. FYI: ST elevation at the J-point in this diagram is about 2.5 mm. |