Written by Pendell Meyers
A male in his 40s experienced off and on chest pain at rest several times in the past 48 hours. The pain returned and was persistent for several hours when EMS arrived and recorded this ECG:
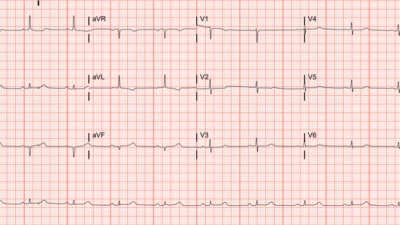
Time zero (prehospital):

Overall, I think this ECG itself would be suggestive of OMI in leads V3-V4, and inferior leads, but to me would not be diagnostic yet. There was no baseline available for comparison, and there is a question of whether the S wave voltage in V3 is being truncated at 10 mm. Queen of Hearts also does not see signs of OMI on this ECG. Is V3 T-wave hyperacute? Very possible, but I would also like to be sure that I am seeing the full S wave in order to assess the ST segment and T wave, which are always proportional to the QRS.
Time 16 minutes (still prehospital):

And only 16 minutes, later, its very obviously anterior OMI. Signs of active OMI and reperfused OMI are coexisting in this ECG at the moment, and only symptoms and ECG progression can say whether the artery is in the process of slightly opening or closing at this moment in time, but overall the patient obviously has LAD OMI that needs emergent reperfusion. QOH was obviously positive for this ECG and all below.
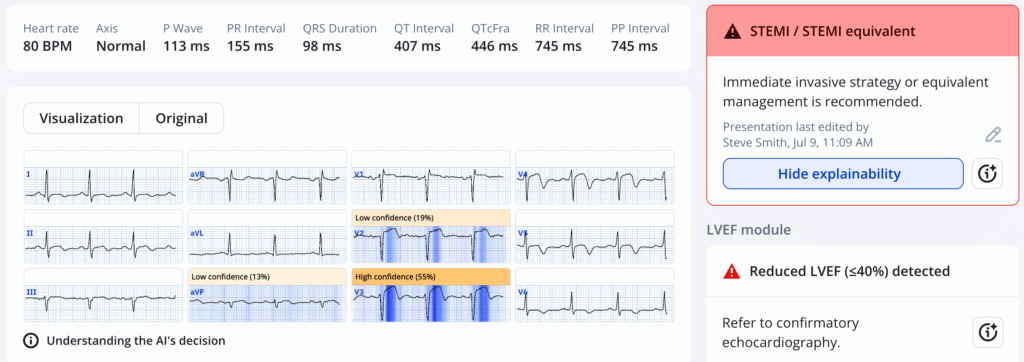
Get the app and try for yourself! See details below.
New PMcardio for Individuals App 3.0 now includes the latest Queen of Hearts model and AI explainability (blue heatmaps)! Download now for iOS or Android. https://www.powerfulmedical.com/pmcardio-individuals/ (Drs. Smith and Meyers trained the AI Model and are shareholders in Powerful Medical.)
Time 20 minutes (last prehospital):

Compared to the ECG above, it seems that there has been some progress along the reperfusion sequence, with lower STE and progression of reperfusion T wave inversion. Hopefully the patients symptoms are resolving, but either way it would be best to proceed to emergent angiography to secure this highly volatile ruptured culprit lesion, because the thrombus could aggregate another 5 platelets at any moment and become fully occlusive again!
Speaking of that, here is the ECG at arrival to the ED with active symptoms:

Compared to the most recent prior ECG above, this suggests some relative reocclusion, as some of the T-wave inversion in reversing.
He was taken to the cath lab soon after arrival, where a prox to mid LAD culprit lesion was identified, 99% stenosis, TIMI 3 flow, thrombotic. PCI was performed without complications.
Next morning ECG:
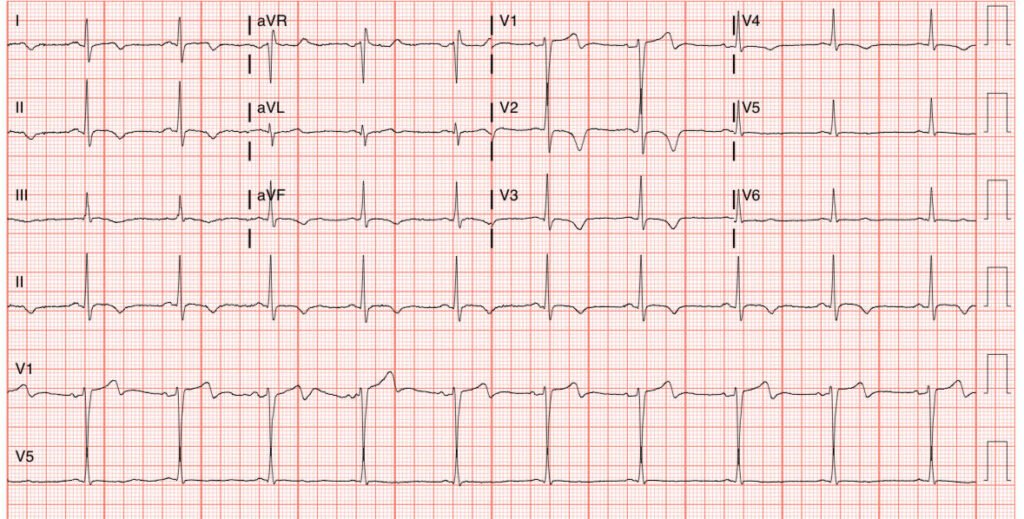
Our Queen of Hearts (QOH) reperfusion model is positive on this ECG of course.
Here is the simplified OMI progression image I made from Dr. Smiths wonderful ECG book many years ago:
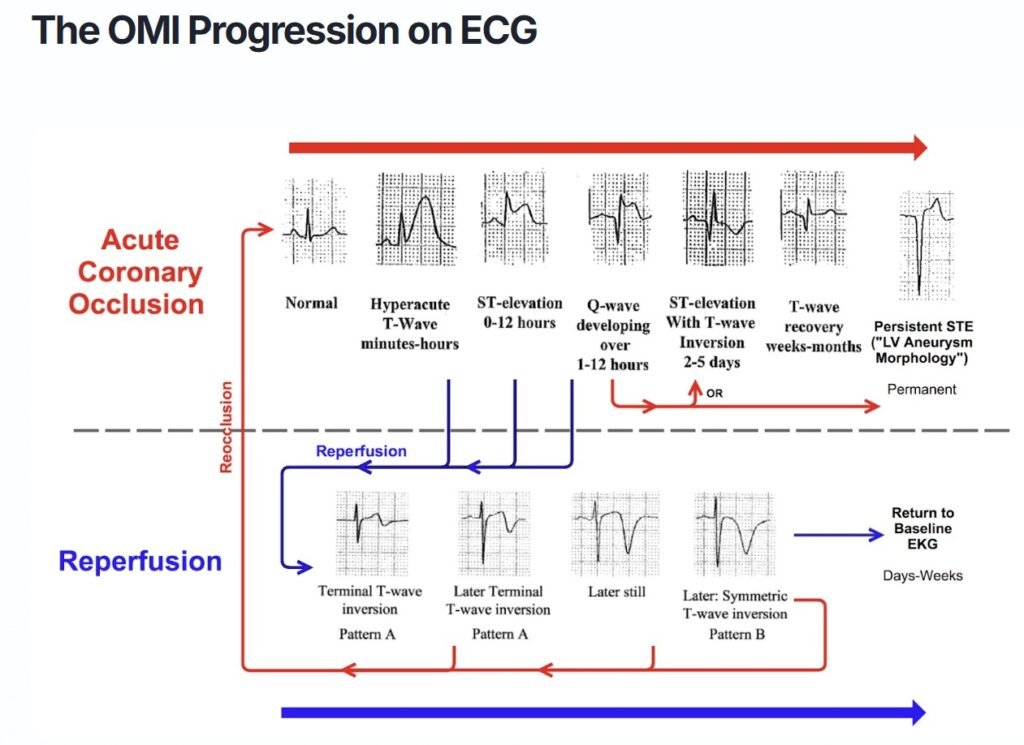
If you understand how OMI works on the ECG, then you can trace each case from beginning to end, on its circuitous path through the diagram.
======================================
MY Comment, by KEN GRAUER, MD (7/9/2025):
The “good news” regarding today’s case — is that within 16 minutes of recording the initial EMS ECG — the ECG diagnosis of an acute OMI was definitively made when the repeat ECG showed obvious reperfusion changes.
- I focus My Comment on the question as to how likely this acute OMI diagnosis was from the appearance of this initial EMS ECG?
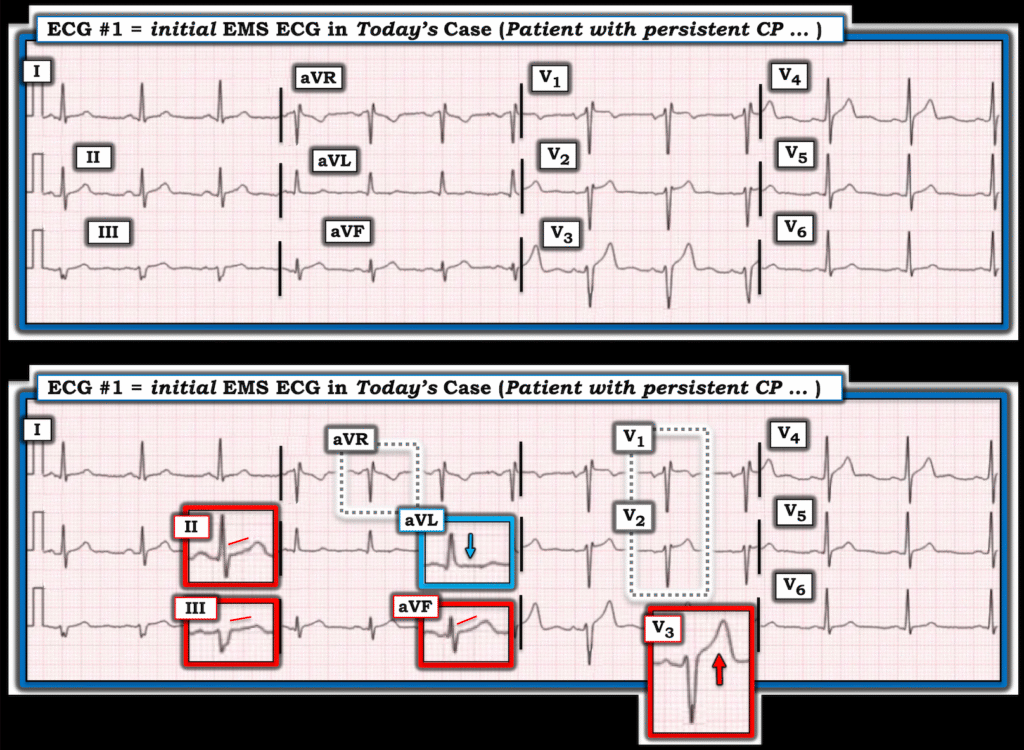
For clarity in Figure-1 — I’ve reproduced this initial ECG. In my opinion, the “goal” for today’s case — is to recognize within seconds that ECG #1 is highly suspicious of acute proximal LAD occlusion, which should be assumed until proven otherwise.
- The history is worrisome (ie, a middle-aged man with Chest Pain over the previous 48 hours, that has now become severe and persistent). This history immediately places this patient in a higher-risk group for having an acute cardiac event.
- My “eye” was immediately drawn to the QRST complex in lead V3 — which in a patient with new, severe CP, has to be assumed as manifesting a hyperacute T wave (this ST-T wave in being disproportionaly “bulky” — considering modest depth of the S wave in this V3 lead).
- KEY Point: Since the only chest lead in ECG #1 that clearly shows hyperacute changes is lead V3 — it becomes especially important to obtain a valid assessment of ST-T wave appearance in leads V1,V2. However, it is almost certain that leads V1,V2 have been placed too high on the chest — which essentially invalidates our ability to assess these critical V1,V2 leads for LAD OMI (ie, Both leads show an rSr’ complex — with lead V1 manifesting a fairly deep negative component to the P wave, with QRST morphology that closely resembles that seen in lead aVR — See My Comment in the November 4, 2018 post, among many others for how to quickly recognize V1,V2 misplacement).
The above said, despite lead V3 being the only chest lead to show hyperacute changes (The T wave in lead V4 being suspicious — but not disproportionate enough to be diagnostic) — the limb leads in ECG #1 show subtle-but-real abnormalities that do support our concern about hyperacute changes in lead V3.
- There is subtle straightening of the ST segment takeoff in each of the inferior leads. That this most likely represents a “real” ST-T wave change — is supported by the overly large T wave with wider-than-expected base in lead aVF, that is disproportionately increased considering very small amplitude of the R wave in this aVF lead.
- Equally subtle, but nevertheless supportive of the above noted findings — is the ST segment straightening with slight ST depression that is present in lead aVL ( = a reciprocal change).
BOTTOM Line: The above noted ST-T wave changes are indeed subtle. But in this patient with new, persistent and severe CP — the finding of a clearly hyperacute T wave in lead V3 — in association with subtle-but-real ST-T wave abnormalities in 4 limb leads (and with invalidation of misplaced leads V1,V2) — my impression on seeing ECG #1 was the need to assume acute LAD OMI until proven otherwise. The repeat ECG done 16 minutes later confirms that impression.
=================================
P.S.: Dr. Meyers raises the excellent point that EMS tracings (at least in the U.S.) — are often truncated, such that larger R wave or S wave amplitudes (usually those that exceed 10 mm) are not recorded once the R wave or S wave attains the 10 mm “cut-off”.
- Of the 3 QRS complexes that we see in lead V3 of the initial EMS tracing — the first 2 look like they could have been “truncated”. I thought the 3rd complex in this lead looked like it was “complete” and less than the 10 mm cut-off. But it is easy to get fooled — so always a good idea (as emphasized by Dr. Meyers) to recheck with an additional ECG that displays full voltage (See My Comment in the February 6, 2020 post — which illustrates this potentially confusing phenomenon).
- In today’s case — the repeat ECG on arrival in the ED confirmed that S wave amplitude in lead V3 was modest (not cut off on the EMS tracings) — thereby supporting our assumption of a “tell-tale” hyperacute ST-T wave in lead V3 of the prehospital tracings.


