
I was sent this ECG by a former colleague without clinical context and asked for an interpretation. Interpreting ECGs without clinical context should be avoided when it comes to actual clinical desicion making but it can be a fun exercise and a good way to learn pattern recognition.
Without the benefit of clinical information how would you describe this ECG? If any, what are the features that concerns you?
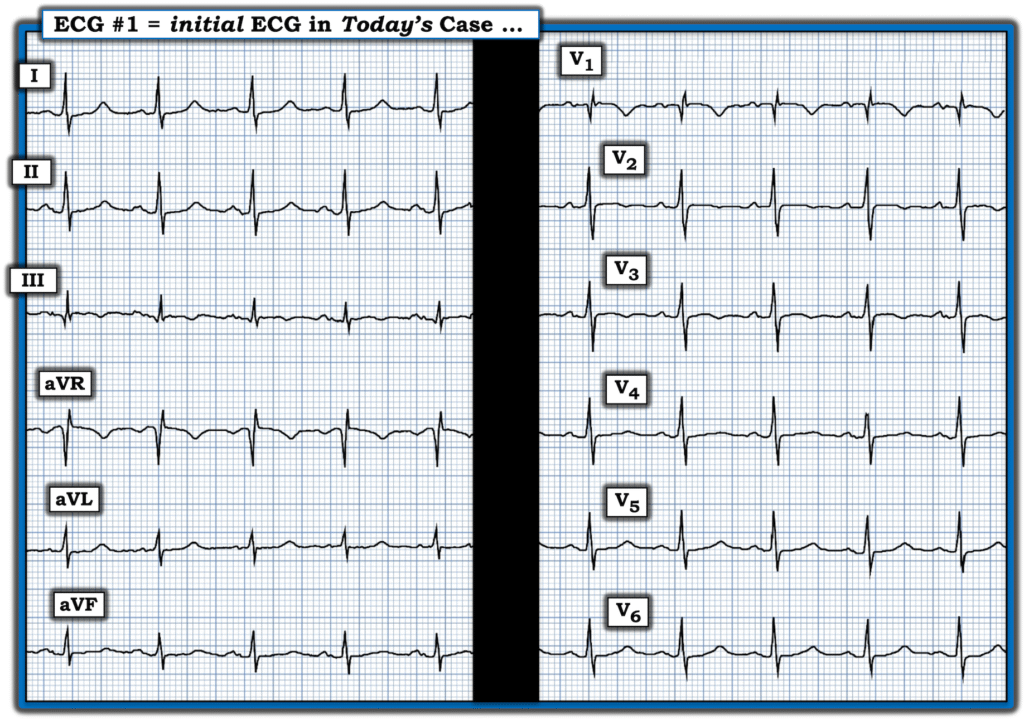
ECG #1

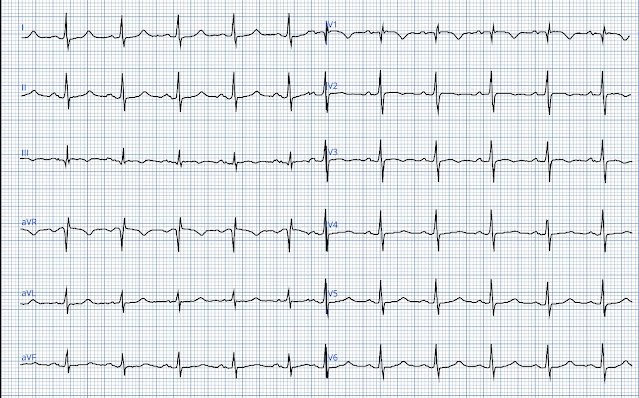
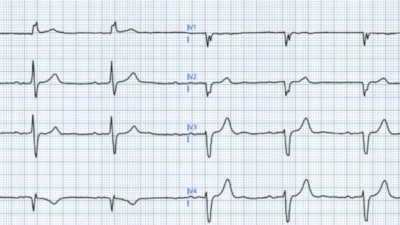
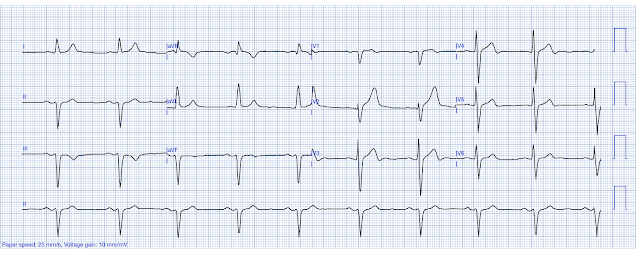
The ECG shows sinus rhythm at just above 90 beats per minute. The QRS is narrow. Of note are T wave inversions in leads V1-V3. QRS voltage is on the low side. Lead III in addition to miniscule q waves also has T wave inversions.
Smith: There is T-wave inversion in V1-V3, and T-wave inversion in lead III (and S1Q3T3). When the differential is ACS vs. PE, and there is T-wave inversion in precordial leads, the presence of T-wave inversion in lead III has an EXTREMELY high Likelihood ratio for PE.
My response was:
“Perhaps not diagnostic, but need to rule out right heart strain.”
Here is some clinical correlation; The patient is a 75-year-old overweight female who had experienced subacute shortness of breath for the past two weeks. On the day of presentation, her breathing difficulties worsened, accompanied by lightheadedness during exertion, prompting her to seek medical care.
Her symptoms, along with findings on the ECG, led to further evaluation with a pulmonary artery CT scan. This imaging revealed bilateral pulmonary emboli with significant right heart strain. In the accompanying image, the ventricles are labeled, clearly showing how the right ventricle is markedly enlarged compared to the left ventricle.
CT pulmonary angiogram
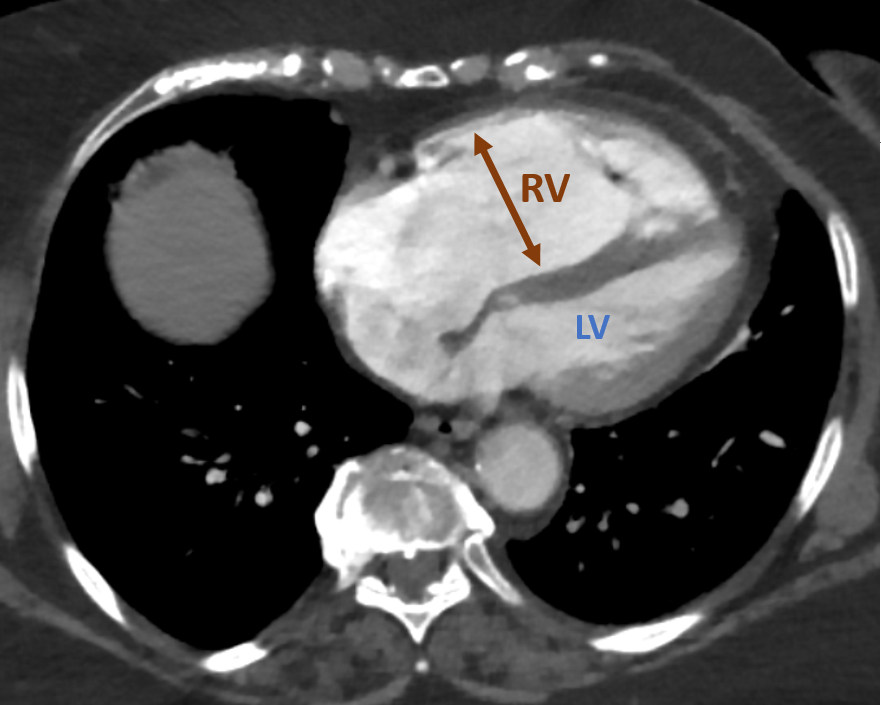
RV = Right ventricle. LV = Left ventricle.
This patient had a large PE. Submassive pulmonary embolism accounts for about 40% of all PE cases and is associated with a mortality rate up to 25%. Patients with submassive PE remain normotensive but are usually tachycardic and show signs of myocardial injury or dysfunction. They show signs of RV strain on either ECG or imaging modalities such as CT or ultrasound and often have elevated troponins and BNP levels.
Table 1
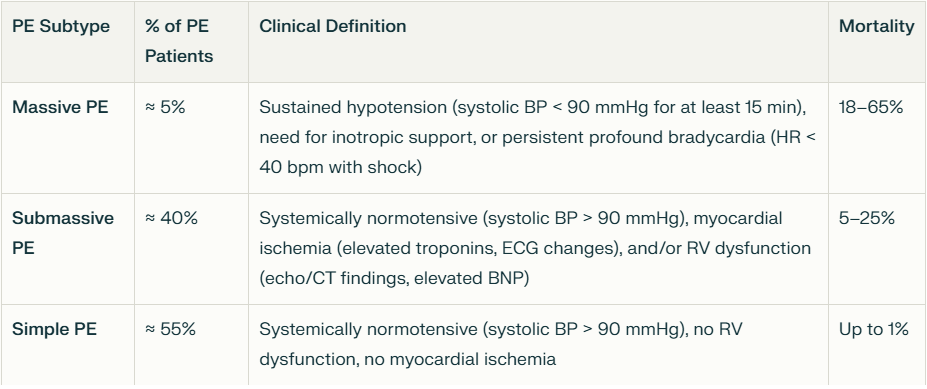
Table 1 shows a summary of characteristics and mortality for the different subgroups of pulmonary embolism. Modified from (1)
On presentation our patient was hypoxemic and had an elevated hs-troponin I at 1348ng/L and NT-proBNP of 4555pg/mL. She was normotensive with a heart rate in the 90s. She was treated with a heparin drip and then later switched to OAC. The distinction between submassive and massive PE is not straight foreward and often times it can be difficult to decide who are «sick enough» to be treated with thrombolytics and/or thrombectomy.
This case illustrates that life-threatening pulmonary embolism even when causing severe right heart strain may be very difficult to identify solely off of the ECG and often clinical suspicion and imaging studies are needed to make the diagnosis. The most sensitive ECG finding in PE is sinus tachycardia, but this is very unspecific for PE.
What hemodynamic change occurs in acute severe PE?
The right ventricle is thin-walled and compliant, and therefore it is ill-equipped for acute increases in afterload compared to the muscular thick-walled noncompliant left ventricle. In case of sudden afterload increase the RV typically, due to its thin wall and compliant structure dilates.
Stroke volume as a function of afterload.
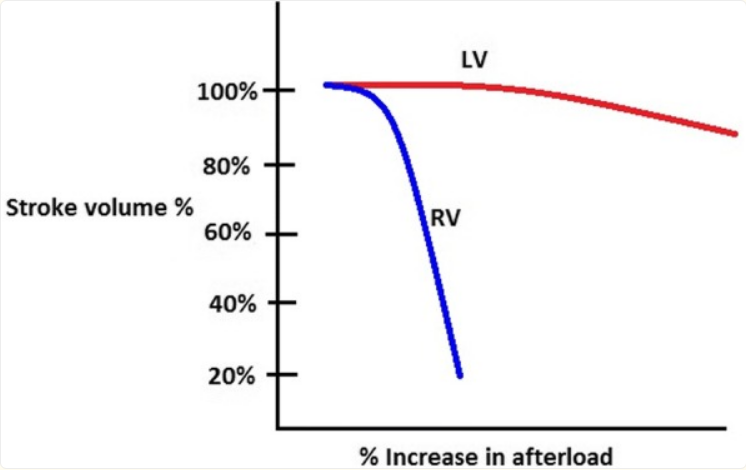
Red line Left ventricle. Blue line Right ventricle. Reproduced from (1)
As the RV stroke volume falls, blood accumulates in the right ventricle leading to dilation of this chamber. If the right ventricle becomes very dilated, it will interfere with left ventricular filling as the heart is contained within the fibrous pericardium. This leads to reduced left ventricular stroke volume and cardiac output.
In contrast to the LV, the RV is supplied with blood throughout the cardiac cycle, both during systole and diastole. This is because the right ventricular systolic pressure is typically lower than the systemic diastolic pressure, so coronary blood flow to the right ventricle is not interrupted when the RV contracts. In severe PE, the LV stroke volume and cardiac output may not generate sufficient diastolic blood pressure to perfuse the RV throughout the cardiac cycle resulting in RV ischemia.
These hemodynamic changes may result in syncope, shock or cardiac arrest.
LEARNING POINTS:
- Even large PE may show little if anything on an ECG
- The RV is compliant and will dilate in respons to acute afterload increase
- RV dilatation in severe acute PE leads to LV underfilling and decreaed CO.
- The RV receives blood supply throughout the caridac cycle
Reference:
- Bryce, Y. C., Perez-Johnston, R., Bryce, E. B., Homayoon, B., & Santos-Martin, E. G. (2019). Pathophysiology of right ventricular failure in acute pulmonary embolism and chronic thromboembolic pulmonary hypertension: a pictorial essay for the interventional radiologist. Insights Into Imaging, 10(1). https://doi.org/10.1186/s13244-019-0695-9
The ECG in Pulmonary Embolism:
The ECG is not sensitive for PE, but when there are findings such as S1Q3T3 or anterior T-wave inversions, or new RBBB, or sinus tachycardia, then they have a (+) likelihood ratio. S1Q3T3, or even just the T3, may help to differentiate Wellens’ from PE.
What is an S1Q3T3? Very few studies define S1Q3T3. It was described way back in 1935 and both S1 and Q3 were defined as 1.5 mm (0.15 mV). In the Marchik article, (assuming they defined it the same way, and the methods do not specify this), among patients with suspicion for PE, S1Q3T3 was found in 8.5% of patients with PE and 3.3% of patients without PE.
When there is a positive troponin, then the findings are related to myocardial injury, and then PE and MI are at the top of the differential, and Kosuge’s article (see below) applies.
Kosuge et al. showed that, when T-waves are inverted in precordial leads, if they are also inverted in lead III and V1, then pulmonary embolism is far more likely than ACS. In this study, (quote) “negative T waves in leads III and V1 were observed in only 1% of patients with ACS compared with 88% of patients with APE (p less than 0.001). The sensitivity, specificity, positive predictive value, and negative predictive value of this finding for the diagnosis of PE were 88%, 99%, 97%, and 95%, respectively. In conclusion, the presence of negative T waves in both leads III and V1 allows PE to be differentiated simply but accurately from ACS in patients with negative T waves in the precordial leads.”
Witting et al. looked at consecutive patients with PE, ACS, or neither. They found that only 11% of PE had 1 mm T-wave inversions in both lead III and lead V1, vs. 4.6% of controls.
This does not contradict the conclusions of Kosuge et al., who studied a select population of patients who were known to have either PE or ACS — that is, all were indeed ill. Of those select patients, the ones who also had T-wave inversions in the right precordial leads were studied. Of these, T-wave inversion in lead III was very specific for PE. In my experience, this is true, but needs validation in a study of similar methodology. Supporting Kosuge, Ferrari found that anterior T-wave inversions were the most common ECG finding in massive PE.
Finally, Stein et al. found normal ECGs in only 3 of 50 patients with massive PE, and 9 of 40 with PE that is not massive. Today, however, that number would be lower because we diagnose more of the smaller PEs that have minimal symptoms.
This is a paper worth reading: Marchik et al. studied ECG findings of PE in 6049 patients, 354 of whom had PE.
Just to be clear: these are all patients being evaluated for PE, whereas Kosuge studied those with only ACS and PE left on the differential. We should apply Kosuge’s data to our case here because of the positive troponin.
They found the following positive likelihood ratios for PE:
1. S1Q3T3 = 3.7
2. Inverted T-waves in V1 and V2, = 1.8
3. Inverted T-waves in V1-V3, = 2.6
4. Inverted T-waves in V1-V4, = 3.7
5. Incomplete RBBB = 1.7
6. Tachycardia, = 1.8.
Finally, they found these independent predictors of PE:
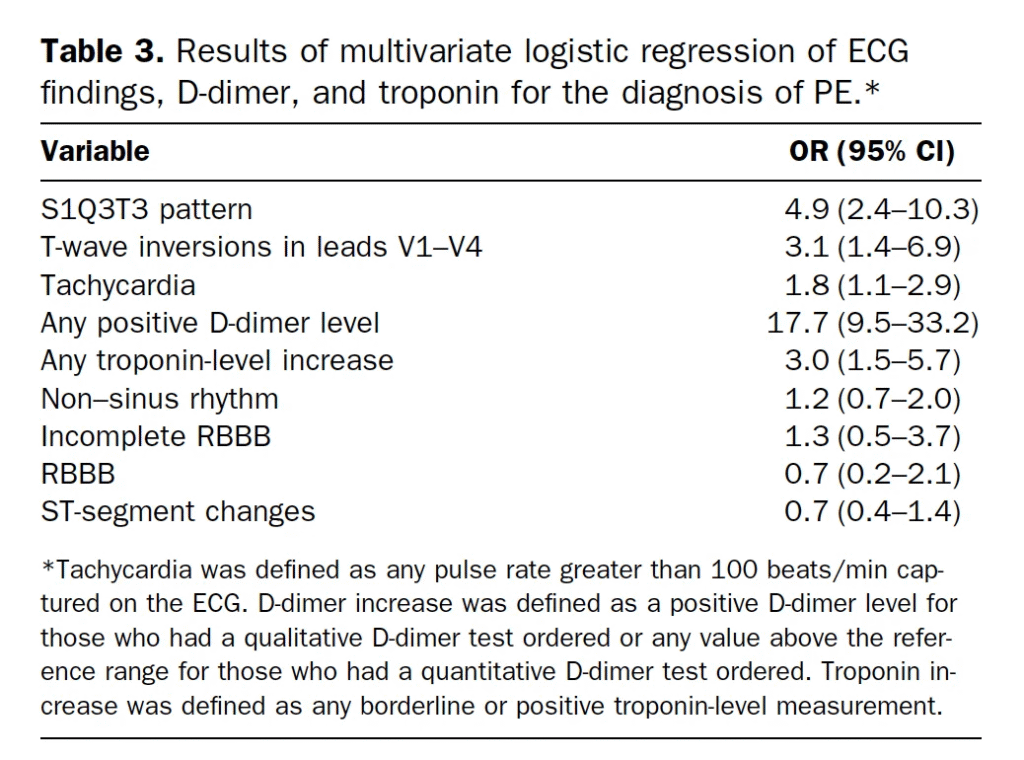
======================================
MY Comment, by KEN GRAUER, MD (7/28/2025):
I found today’s case presentation by Dr. Nossen highly challenging and insightful for multiple reasons.
- As per Dr. Nossen — “This case illustrates that life-threatening PE (Pulmonary Embolism) even when causing severe physiologic RV ‘strain’ — may be very difficult to identify solely by ECG”.
- This case emphasizes the importance of the History — which is truly essential for optimal clinical ECG interpretation.
- Finally — Today’s case highlights a series of subtle ECG signs of significant pulmonary disease, that taken together in the context of the clinical History — does correlate with the severe clinical picture that this patient was experiencing.
The Importance of History:
I did not suspect today’s patient was in the midst of a submassive PE. Given the predominance of ischemia-related cases on most ECG forums — I instead contemplated various degrees of subendocardial ischemia and/or recent inferior — right ventricular — or anteroseptal OMI, now potentially in any of the various stages of “pseudo-normalization” and/or reperfusion.
- This highlights yet another “Take-Home Message” from today’s case — namely that optimal clinical ECG interpretation entails a sequential systematic approach. By this I mean that regardless of whether the interpreter does (or does not) know the clinical history at the time they are presented with an ECG — the same sequential systematic approach is followed.
- To Emphasize: Expert, experienced interpreters are automatically (and instantly) systematic — such that being systematic does not slow you down. But it does prevent overlooking potentially important findings that are easy to miss if one jumps to premature conclusions.
ECG Findings in Today’s Tracing:
For clarity in Figure-1 — I’ve reproduced today’s ECG. My thoughts on seeing this tracing without the benefit of any history, were the following:
- The rhythm is sinus — albeit the heart rate is relatively rapid (with an R-R interval just over 3 large boxes in duration = a rate of ~90/minute).
- Regarding intervals — both the PR interval and QRS duration are normal. The QTc appears to be of borderline duration, albeit difficult to assess given the fairly rapid rate.
- The frontal plane axis is normal (about +60 degrees).
- No chamber enlargement.
Regarding Q–R–S–T Wave Changes:
- Q waves — A small q wave appears to be present in lead III (albeit, as often occurs in lead III — there is some respiratory variation in QRS morphology).
- R wave progression — There is early transition (ie, The R wave becomes predominant already in lead V2 — whereas normally this does not occur until leads V3-to-V4, or later).
- A qR complex is seen in lead V1 — which could represent either IRBBB (Incomplete RBBB) or simply terminal RV outflow track depolarization.
- There are lots of S waves (being seen in leads I,II,III; aVL,aVF: and in leads V2-thru-V6).
- There are lots of subtle ST-T wave abnormalities of uncertain significance. This includes straightening of the ST segment in multiple leads, often with a hint of ST depression.
- There is subtle ST segment coving in multiple leads (leads III,aVR; V1,V2,V3) — with a hint of slight ST elevation in leads III, aVR and V1.
- There is shallow T wave inversion in leads III, V1,V2,V3.
MY Impression of ECG #1: I was left with really wanting to know the history. On the one hand — most (all) of the above findings might be nonspecific and without clinical significance. But then again I thought that Dr. Nossen would not have presented this case if there wasn’t some form of pathology!
- I thought this ECG could be the result of ichemic heart disease. If the missing History in today’s case was that this patient had new CP (Chest Pain) — but that this CP had significantly decreased (or resolved) at the time ECG #1 was recorded — then the diffuse ST segment straightening with a hint of ST elevation in lead aVR could represent some degree of DSI (Diffuse Subendocardial Ischemia).
- The subte ST segment coving with elevation in lead III — with more marked ST coving and deeper T wave inversion in lead V1 might represent recent inferior and/or RV infarction — now with some pseudo-normalization from spontaneous reperfusion ST-T wave changes. Or perhaps the localization of recent OMI was the result of LAD occlusion, followed by resolution of ST elevation on the way to developing reperfusion T waves, given the ST coving in leads V1,V2,V3?
- Then again — there are a number of ECG findings potentially consistent with pulmonary disease, that might be recent.
================================
Figure-1: I’ve reproduced today’s ECG. No history provided.
================================
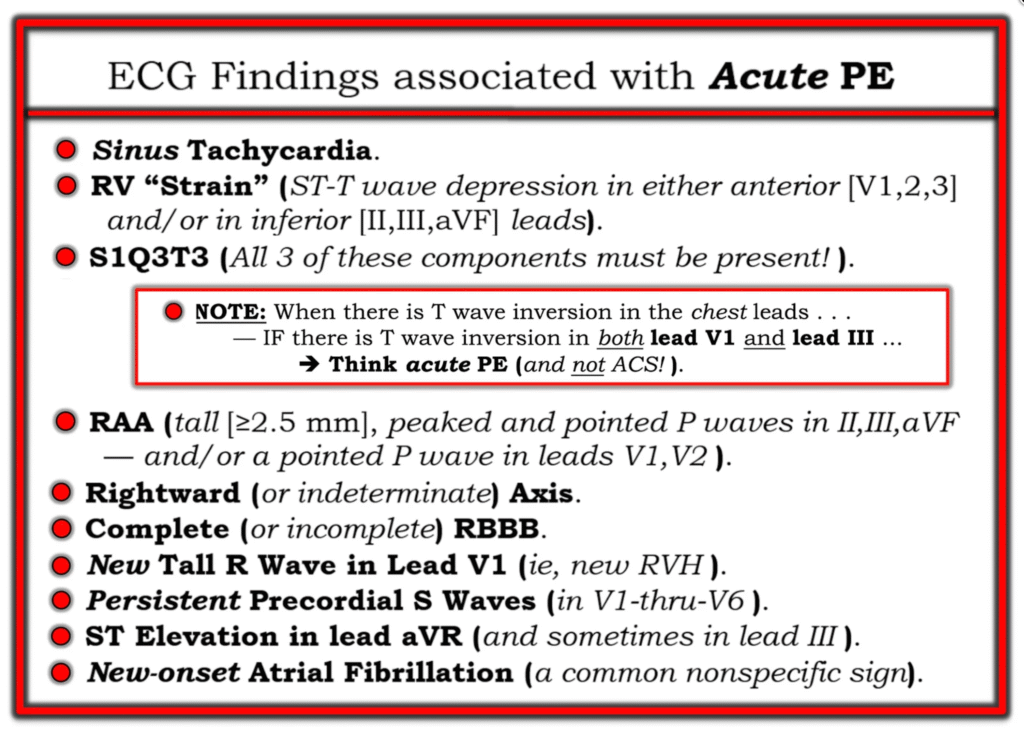
ECG Findings of Acute PE:
Over the years — we’ve covered many cases illustrating potential ECG fidings of acute PE (See My Comment at the bottom of the page in the June 17, 2024 post, among many others). It is from this June 17, 2024 post — that I’ve reproduced in Figure-2 a list of ECG Findings associated with Acute PE. As we’ll see momentarily — suggestion of many of these findings is put forth by the ECG in Figure-1:
- To Emphasize: The ECG findings that I’ll point out momentarily in today’s tracing are extremely subtle — which is why, without knowing the history in today’s case, I did not suspect the patient was experiencing submassive PE. But the moment I learned that this older woman presented with progressively increasing dyspnea over a 2-week period — all of the subtle ECG findings in today’s tracing began to make sense!
- PEARL: We are told that today’s patient was “overweight” How overweight she was (which would of course be instantly obvious the moment we saw the patient) — might have a significant impact on why many of today’s ECG findings are subtle (ie, IF this patient was significantly overweight — that might account for the relatively modest overall QRS voltage, as well as for nonspecific ST-T wave flattening that may have been even more marked on this patient’s baseline ECG).
- P.S.: One relevant ECG finding that I did not include in my Figure-2 Table — is the presence of a qR pattern in lead V1. As I highlight in My Comment at the bottom of the page in the February 12, 2023 post — in the right clinical setting (ie, in a patient in whom we are considering acute PE) — the ECG finding of a qR pattern in lead V1 often correlates with significant pulmonary hypertension (this ECG finding reflecting marked RV dilatation from increased RV pressure).
Challenge Yourself!
- Take Another LOOK at the ECG in Figure-1. How many of the findings in Figure-2 can you identify?
================================
Figure-2: ECG findings associated with Acute PE (from My Comment in the June 17, 2024 post).
================================
Taking Another Look at ECG #1:
As emphasized by Dr. Nossen — today’s case illustrates how even potentially life-threatening PE may be difficult to recognize from a single ECG. That said, knowing about this older woman’s 2-week history of progressively increasing dyspnea — many of the ECG findings in Figure-2 can be recognized.
- No — sinus tachycardia is not present, since the heart rate does not exceed 100/minute. But this patient’s heart rate of ~90/minute is faster than the usual resting heart rate.
- Although T wave inversion in ECG #1 is not deep — the T wave is inverted in the anterior leads, as well as in lead III (BLUE arrows in Figure-3) — which is consistent with RV “strain”.
- An S1Q3T3 pattern is present! Once again — the size of the S wave in lead I — and the Q wave and depth of T wave inversion in lead III is not great, but it is present! In association with all of the other suggestive ECG findings — the presence of an S1Q3T3 pattern increases the likelihood of a significant PE.
- NOTE: As highlighted within the RED rectangle in Figure-2 — When there is T wave inversion in the chest leads — and both leads III and V1 manifest T wave inversion — acute PE becomes much more likely to be the cause than ischemic heart disease!
- RAA and right axis deviation are not present in Figure-3.
- A qR pattern is present in lead V1! This may reflect incomplete RBBB (clearly possible given associated terminal s waves in left-sided leads I and V6) — and/or — this qR pattern may reflect pulmonary hypertension (as per the P.S. that I wrote above) — or most probably both entities.
- The ECG diagnosis of RVH is often challenging — because the normal LV is so much thicker and larger than the normal RV. But in view of the small amplitude S wave in lead V1 — the R wave in this lead looks disproportionately tall, therefore potentially a manifestation of RVH.
- Two findings of pulmonary disease are: i) Persistent Precordial S waves; — and, ii) S waves in leads I,II,III (the BLUE “S’s” in Figure-3).
- Doesn’t the ST segment in lead aVR “look” elevated? (even though the amount of any ST elevation in this lead is modest).
In Summary: It is only after I learned that today’s patient had a 2-week history of progressively increasing dyspnea — that I expanded on the potential clinical significance of the above subtle findings. But in this clinical context — all of the above ECG findings are completely consistent with the clinical and CT pulmonary angiogram findings that are diagnostic of acute submassive PE in today’s patient.
================================
Figure-3: I’ve labeled today’s ECG — highlighting acute PE findings.
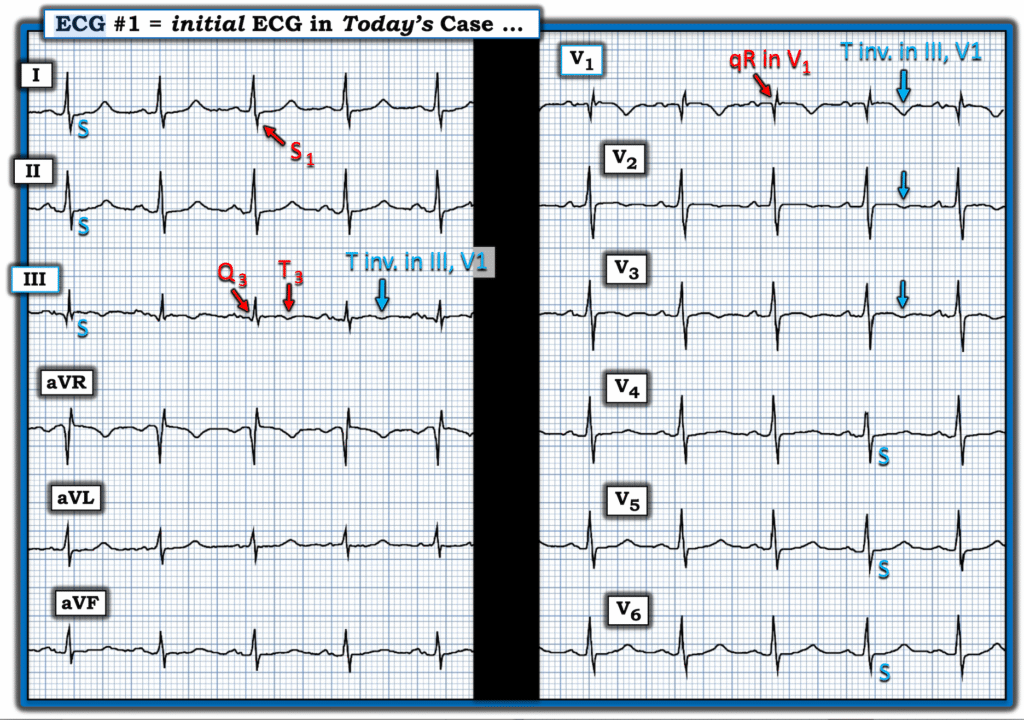
================================
