This patient was admitted after experiencing syncope while seated. What is the primary abnormality on this ECG, and what additional, more subtle ECG feature may predict future events?
ECG #1
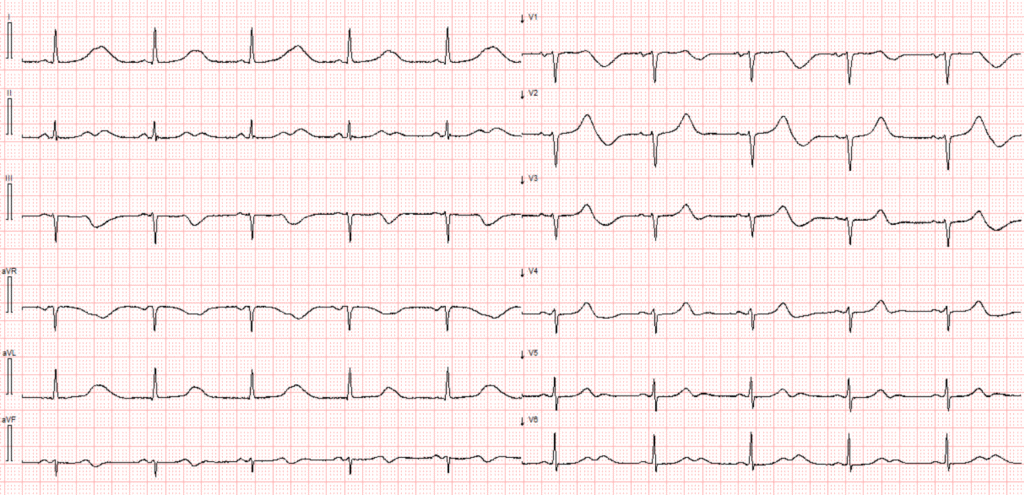
Paper speed 25mm/s. Standard ECG layout.
This ECG shows sinus rhythm with a heart rate of 55 bpm. The PR interval is normal, the QRS complexes are narrow, and the QRS axis in the frontal plane is within normal limits. The T waves appear unusually prominent relative to the preceding R waves, particularly in leads I and aVL. At first glance, these might be mistaken for hyperacute T waves.
However, this is not the case. The QT interval is markedly prolonged, and it’s important to recognize that T waves can appear “hyperacute” or exaggerated when the QTc is significantly extended. This is especially true for Long QT syndrome type 1 (LQTS1) in which the T waves are broad based. Furthermore, the clinical scenario — syncope without any report of chest pain — does not support the diagnosis of hyperacute T waves due to myocardial ischemia.
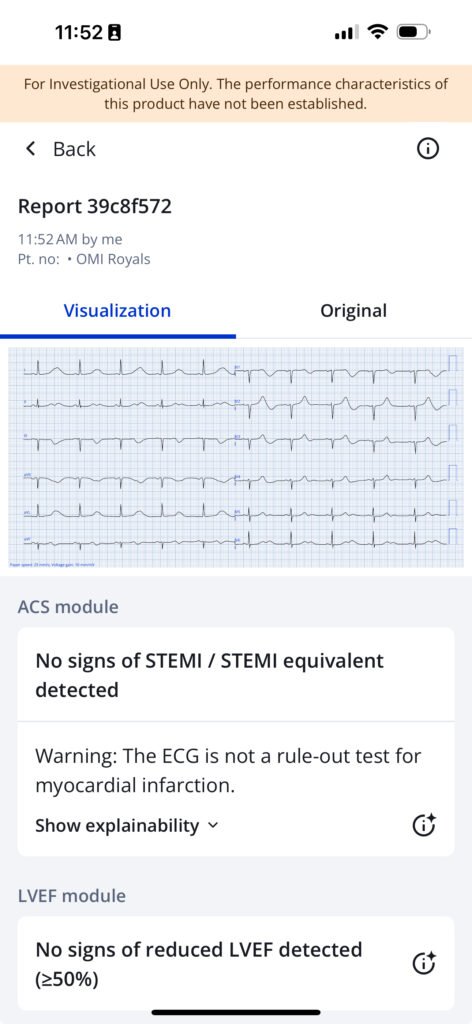
The Queen of Hearts knows that these are not hyperacute T-waves:
Measuring the QT interval can sometimes be difficult, especially if T waves are of low amplitude or if U waves are present and merged with the T wave forming a QTU interval. Large U waves merging with the T waves should be included in the QT(U) interval (1).
Conventional ECG algorithms are not always reliable when it comes to QT/QTc assessment. However, in this case, the computer identified the long QT. My manual measurement revealed a QTc interval of about 630ms by the Bazett Correction (other methods are: Hodges, Fridericia, Framingham, and Rautaharju).

Smith comment:
Computer QT/QTc calculation
Since the heart rate is almost exactly 60 (55), every QT correction method will result in a QTc that is very close to the raw QT. However, it is probably not a good idea to correct for the QT interval when the rate is below 60. This is because a slow rate puts the patient at higher risk of torsades. Thus, for heart rates below 60, it is good to use the QT Nomogram (especially for acquired QT prolongation). Any QT interval above the line is long.
Here it is:
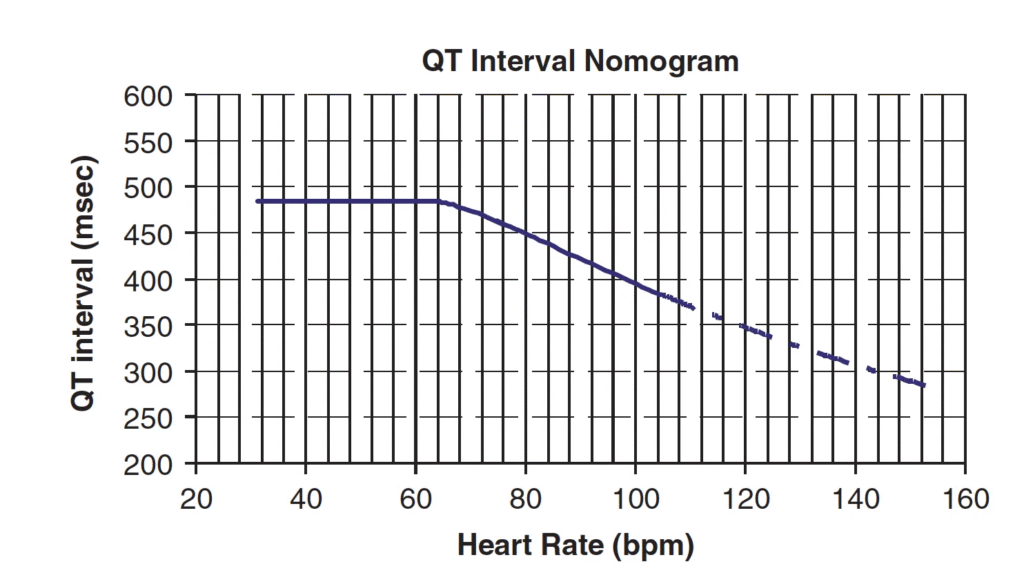
Everything you want to know about QT correction methods here: QT Correction Formulas Compared to The Rule of Thumb (“Half the RR”)
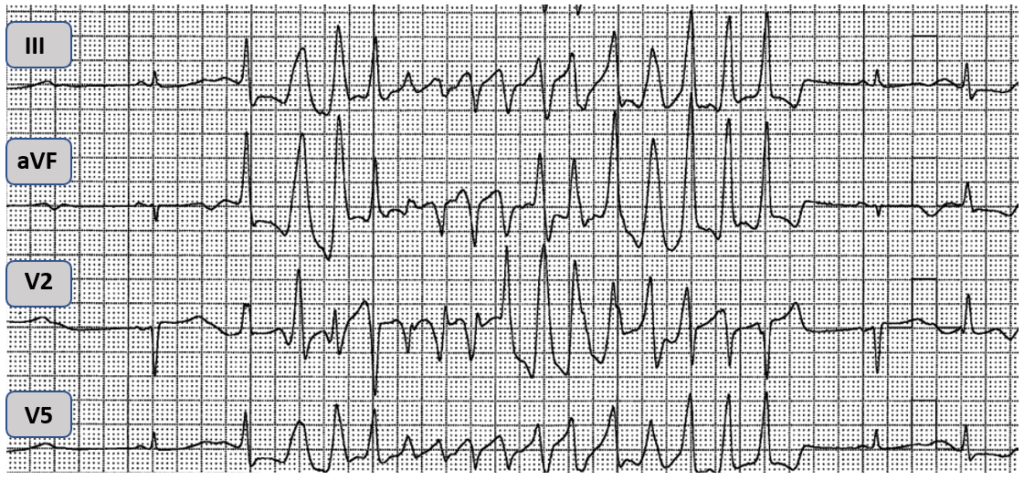
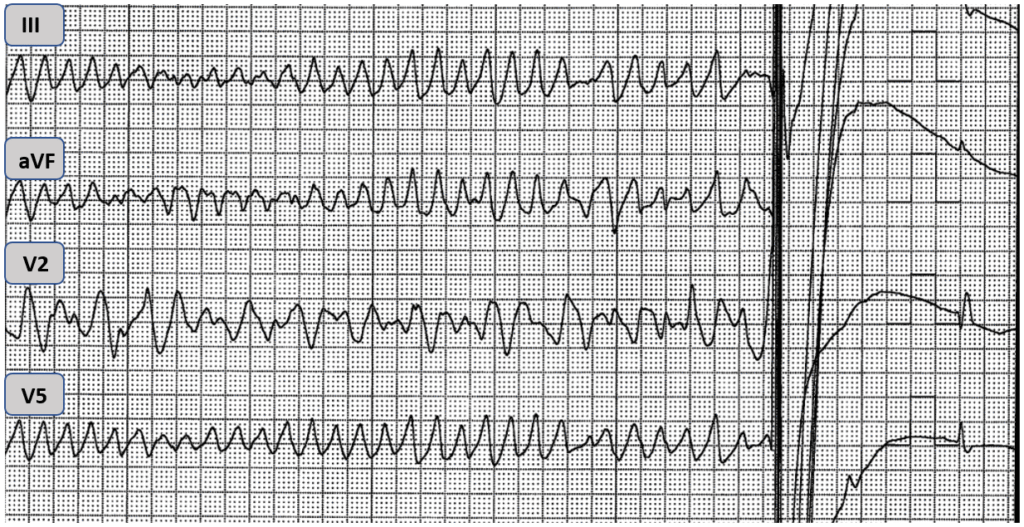
During her hospitalization, the patient had several episodes of Torsades de Pointes (TdP) and ventricular fibrillation. Some of the arrhythmia episodes self-terminated, while others required defibrillation to restore normal rhythm. The telemetry tracings below show some of the episodes of ventricular arrhythmia
Case Continued:
A run of TdP
VF being defibrillated
The patient described in today’s case had no prior history of syncope. Her daughter however, had suffered a cardiac arrest and was subsequently diagnosed with long QT syndrome (LQTS). As part of a family work up, the patient underwent genetic testing and was found to carry a mutation in the KCNQ1 gene, which is associated with LQTS type 1.
The question arises as to why she presented with arrhythmic storm in her 8th decade of life?
For many patients with long QT syndrome, the QT interval most of the time is normal or only slightly prolonged. Arrhythmias are rare and usually occurs after exposure to a trigger that increases the QT interval. Also, certain clinical situations may trigger arrhythmia in the different types of LQTS.
The most common triggers are certain medications — including antiarrhythmics (such as sotalol, dofetilide, quinidine), some antibiotics (like macrolides and fluoroquinolones), antipsychotics, antidepressants, antihistamines, and antiemetics — as well as electrolyte disturbances. The most frequent electrolyte abnormalities that can prolong the QT interval are hypokalemia, and hypomagnesemia.
Our patient was not on any QT prolonging medications. Table 1 below shows blood test on admission and repeat blood draw.
Table 1
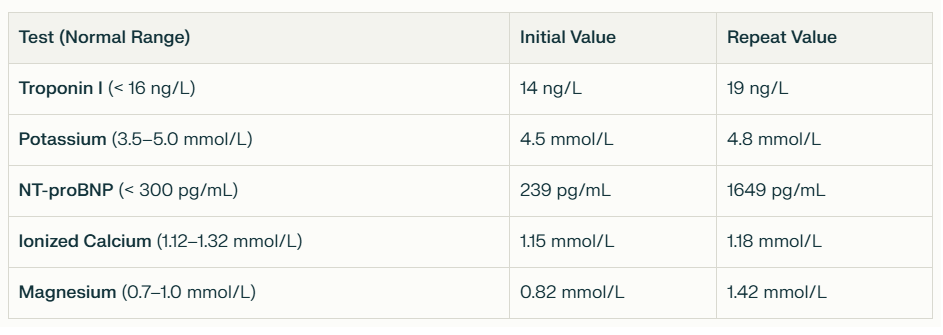
Initial and repeat blood tests. Note increase in magnesium after iv bolus
Electrolytes were normal. The patient continued to have runs of TdP despite treatment with iv magnesium. A combination of antiarrhytmics were tried, which included metoprolol infusion, and lidocaine infusion. Neither drug was effective. Eventually a temporary pacemaker was implanted and overdrive pacing was commenced. This drastically reduced arrhythmic events.
The majority of TdP episodes in patients with LQTS (approximately 75%) are triggered by pauses(2). Following an increase in the RR interval, the QTc prolongs. This pause-dependent QT prolongation is a recognized risk factor for arrhythmia. For our patient, the TdP episodes were generally not triggered by pauses.
In addition to pauses, bradycadia is a risk factor for arrhytmia when the QTc is prolonged. Implantation of a temporary pacemaker can effectively prevent pauses and bradycardia, thereby reducing the risk of arrhythmic events. If temporary pacing is not feasible, isoproterenol infusion may be considered as an alternative.
Initially during the hospital stay, the patient was confused and drowsy. This was perceived as secondary to reccurent arrhythmia and iv benzodiazepines. However, her drowsiness persisted beyond what would be expected from the arrhythmia and sedation alone. It also became apparent the patient exhibited signs of visual neglect, and a subsequent CT scan revealed a cerebral infarct.
==================================
Discussion
This patient experienced a sudden arrhythmic storm in her seventies due to intermittent severe QT prolongation. There were no inciting medications or electrolyte abnormalities. Echocardiography was normal, and there was no suspicion of stress-induced cardiomyopathy (which may produce QT prolongation).
In the absence of these common causes of QT prolongation, it is likely that the cerebral infarct seen on CT caused a stress-related repolarization abnormality leading to a dangerously prolonged QT interval in this patient with LQTS type 1.
Is it also possible that the long QT was always there, but the stroke only induced bradycardia, putting her at risk of Torsades?
This hypothesis was refuted by discovery of another previous ECG with a long QT at 480 ms. So the stroke probably exacerbated an already long QT that was not (yet) dangerously prolonged and possibly added bradycardia to result in TdP.
As eluded to in the first paragraph of today’s case, besides the extremely long QT interval — the initial ECG shows another interesting and rare finding. Below leads V1 and V2 have been magnified for your convenience.
QUESTION: What is the finding that predicts high likelihood of cardiac arrest in our patient?
Excerpt of ECG #1
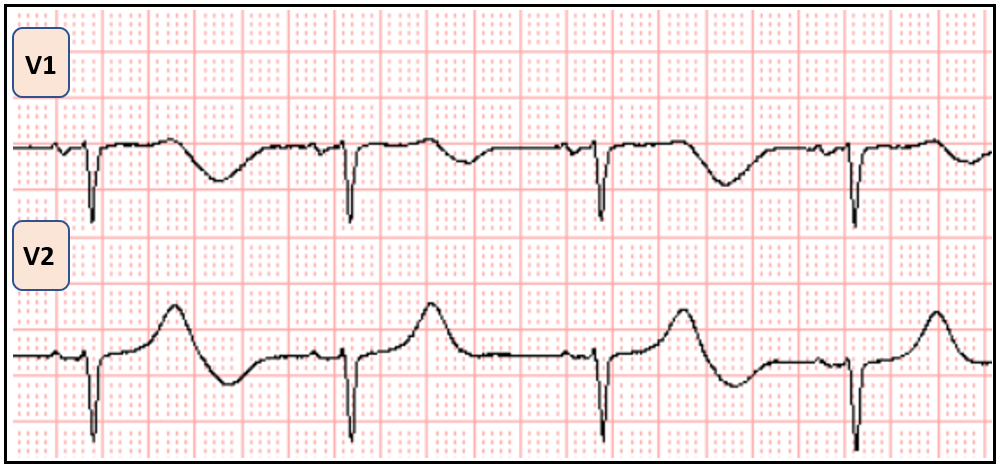
ANSWER: In addition to the markedly prolonged QTc, the initial ECG reveals another notable feature: T-wave alternans. Careful inspection of the T waves across all leads, and particularly the magnified view of leads V1 and V2, shows a beat-to-beat alternation in the amplitude and/or shape of the T waves. That is, every other T wave appears different in height or morphology compared to its neighbor.
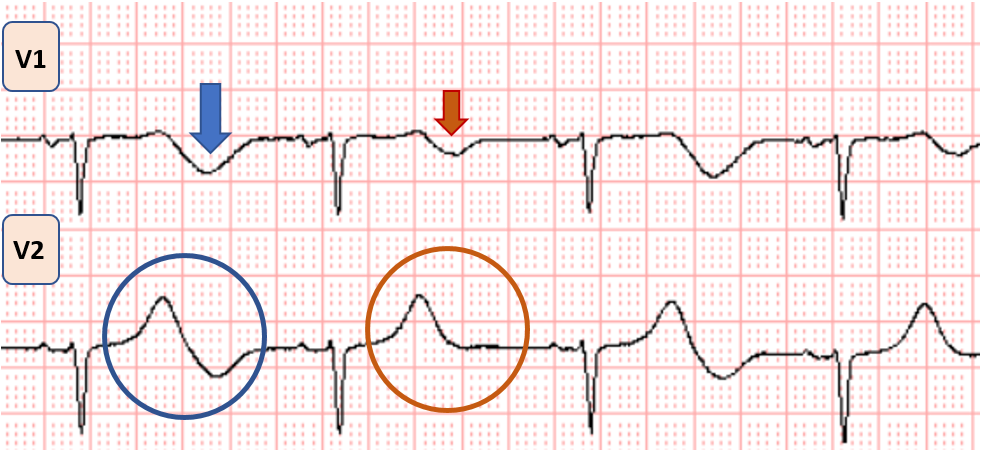
Above: The blue circle and blue arrow show a larger negative terminal component to the T wave, as opposed to the red circle and red arrow. The pattern is bigeminal, changing every other beat.
This phenomenon, known as T-wave alternans — is visually apparent here, and is recognized as a marker of electrical instability and increased risk for ventricular arrhythmias, especially in the context of long QT syndrome.
There are many types of LQTS with LQTS 1-3 making up the majority of cases. LQTS1 is the most common variant and accounts for approximately 30-35% of all cases. As shown in the Table below — each of the types of LQTS have distinguishing features electrocardiographically, genetically, and with regards to clinical situations leading to cardiac arrest.
Key differences between LQTS subtypes
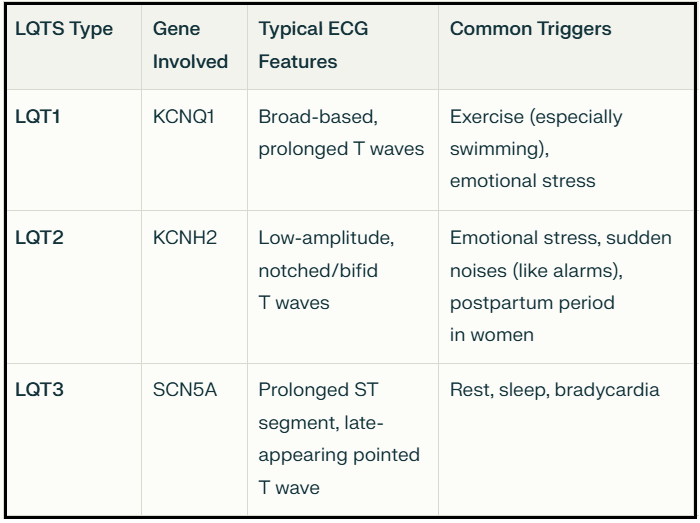
In LQTS, type 1 (the type this patient has) — the T waves are broad based, and may give the impression of being hyperacute. LQTS types 2 and 3 generally have lower amplitude T waves. In LQTS type 3, the ST segment is prolonged with a late-appearing and pointed T wave.
Morphologic types of LQTS
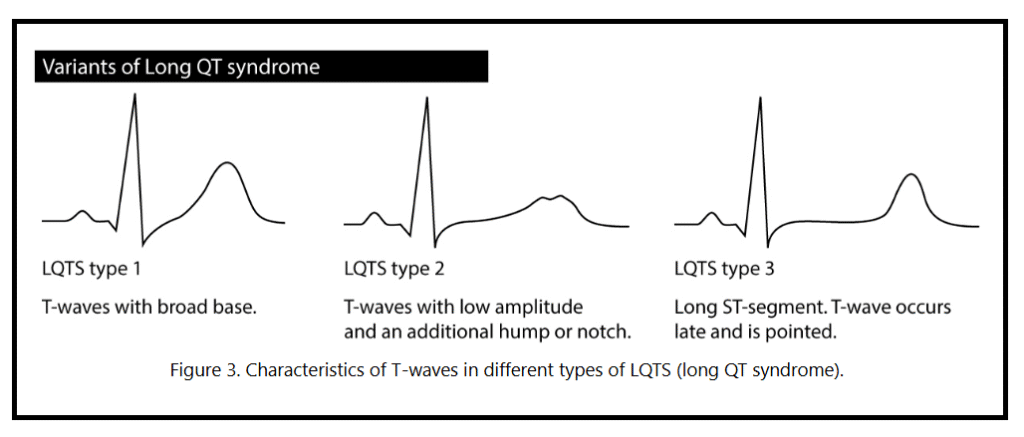
Image reproduced from ECGwaves.com
Outcome
The patient in today’s case eventually did well. An ICD was implanted because of her LQTS with associated arrhythmic storm. Following her stroke the QTc gradually shortened to 476ms.
Answers to Questions in the Title: 1) It took until she was 70 to have a stroke, which prolonged the QT and also possibly led to bradycardia 2) Markers of risk are: A) very long QT B) T-wave alternans C) Bradycardia.
Learing points
- Long QT syndrome — especially type 1, may give the false impression of hyperacute T waves.
- T wave alternans is a worrisome predictor of ventricular arrhythmia.
- Overdrive pacing is often useful for arrhythmia suppresion in patients with prolonged QTc, especially if TdP episodes are pause dependent.
References
- Rawshani, A., MD PhD, & Rawshani, A., MD PhD. (2025, January 11). Long QT (QTc) interval, long QT syndrome (LQTS) & torsades de pointes. The Cardiovascular. https://ecgwaves.com/topic/longt-qt-syndrome-interval-lqts-torsades-de-pointes/
- Viskin, S. (2000). Arrhythmias in the congenital long QT syndrome: how often is torsade de pointes pause dependent? Heart, 83(6), 661–666. https://doi.org/10.1136/heart.83.6.661
===============================
======================================
MY Comment, by KEN GRAUER, MD (7/12/2025):
Fascinating case by Dr. Nossen — of a “congenital” ECG abnormality that did not present for medical attention until today’s patient was in her 70s!
- I focus My Comment on a number of additional points to those brought out in Dr. Nossen’s excellent discussion above.
- For clarity in Figure-1 — I’ve labeled the KEY areas in today’s initial ECG that left me uncertain about what I was seeing.
How Long is the QTc in Today’s ECG?
Reminder: Accurate determination of the QTc ( = the QT interval corrected for heart rate) is essential for optimal management of a number of important clinical conditions. This is especially true for today’s case, in which the patient developed arrhythmic storm, with episodes of Torsades de Pointes ( = a condition that depends on accurate determination of the QTc to distinguish it from polymorphic VT, in which the QTc is normal).
- To facilitate QTc determination at various heart rates — We’ve added a QTc Calculator that is readily accessible from the Menu found at the TOP of every page in Dr. Smith’s ECG Blog.
- Go to Tools & Guides in the TOP Menu. From the pull-down menu, click on QT Calculator. This will take you to THIS PAGE —
===============================
Dr. Nossen estimates the QTc in today’s initial ECG at ~630 msec.
- Dr. Nossen may be correct.
- My Thought — I do not know what the QTc is for today’s initial ECG (which for clarity, I’ve reproduced in Figure-1).
- The reason I do not know what the QTc is in ECG #1 — is that a form of electrical alternans is present, in which either the T wave or the U wave is changing in size and shape every-other-beat.
- I simply am not sure in Figure-1 — where the T wave ends (and where the U wave begins). Without being able to determine this — it’s not possible to be certain about the QTc interval.
===========================
Figure-1: I’ve labeled the initial ECG in today’s case. Where does the T wave end and the U wave begin? (Is there T wave or U wave alternans?).

Looking Closer at Today’s Initial ECG:
Why is it so difficult to assess the QTc interval in ECG #1? Does this make a difference in our management of today’s patient?
- The 1st challenge in assessing today’s tracing — is that we only have 5 beats to look at in Figure-1 (ie, The same 5 beats that are seen in the chest leads — are also seen in the limb leads). In addition — the R-R interval is not completely regular. Thus, we only have 5 beats in this sinus arrhythmia from which to determine the QTc.
- Next — some form of T wave or U wave alternans is present (See My Comment at the bottom of the page in the October 23, 2023 post in Dr. Smith’s ECG Blog for review about the various forms and clinical significance of Electrical Alternans). As per the above discussion by Dr. Nossen (and as was brought out in the above-cited October 23, 2023 case) — the presence of T wave (and presumably also U wave) alternans should serve to alert providers of a significantly increased the risk of Torsades — unless precipitating factors are promptly corrected, and especially serum electrolytes are normalized (often assisted by administration of supplemental IV Magnesium).
For example — Take Another LOOK at Figure-1:
- Note the alternating size and morphology that occurs after every-other QRS complex (Best seen in leads I,II — and in leads V1,V2).
- Doesn’t it look in leads I and V1 — that the T wave is dramatically changing (becoming much larger for the T wave of beats #1,3,5?).
- But what about leads II and V2? Doesn’t it look like it is the U wave (and not the T wave) that gets much larger with alternate beats? (with a giant negative U wave now seen in lead V2 for beats #1,3,5?).
- Or perhaps, rather than either the T wave or the U wave — fusion of these 2 ECG waves is responsible for the unusual change in morphology seen after alternate QRS complexes?
- NOTE: Most of the time — it is not difficult to distinguish between the end of the T wave and the beginning of the U wave. But today’s case illustrates one occasion in which I can not be confident doing so.
- Guidelines have been been cited for measuring the QT interval in cases in which prominent U waves are present (See below). But as for Panel D in my Figure-2 below — including a large U wave that looks to be fused with the preceding T wave in determination of the QT — risks overestimation of the QTc level when uncertainty prevails as to where the T wave ends.
- Riera et al (Cardiol J 15(5):408-421, 2008) suggests use of the term, “Q(T + U) interval” — when there is marked prolongation of this interval, in which an apparent huge U wave masks the T wave end point.
- Riera also cites the recommendation when debating the difference between a 2-peaked T wave vs a T wave and U wave — to measure the distance between the 2 peaks that are seen (as I schematically show in lead V5 of Figure-2). If the distance between these 2 peaks is <150 msec. ==> then Assume this is a dual-peaked T wave. But if the distance between peaks is >150 msec. ==> Assume there is both a T wave and a U wave. (ie, In Figure-2 — the distance between peaks = 1 large box on ECG paper = 200 msec., which if the above recommendation is accurate suggests that we are seeing a T wave and a U wave in Figure-2). However, given the discrepancy I cited earlier between what we see in leads I,II and V1,V2 in Figure-2 — I find it difficult to accept the between-peak distance recommendation.
===============================
BOTTOM Line:
I still have no idea as to where the T wave ends in Figure-1 (ie, at the point where the light BLUE vertical line crosses the baseline — or where the RED vertical line crosses the baseline?).
- Clinically — This distinction does not matter. Although my estimate of the QTc interval for ECG #1 in today’s case is less than the 630 msec. estimated by Dr. Nossen — both of us agree that the QTc is significantly prolonged!
- Both of us also agree that the unusual alternate beat morphology change (regardless of whether this is a change in T wave vs U wave vs some indiscernible fusion of the two) — indicates either T wave or U wave alternans, which serves as a high-risk warning for development of Torsades unless metabolic conditions (and especially serum K+ and Mg++ levels) are quickly optimized.
- Along the way — The cause of U waves on ECG remains uncertain. Among the hypotheses for the generation of U waves include repolarization of Purkinje fibers — delayed repolarization of papillary muscles — afterpotentials caused by mechanical forces in the ventricular wall — prolonged repolarization of mid-myocardial “M-cells”. But — No one really knows …
- PEARL #1: Regardless of its T wave or U wave etiology — the marked degree of apparent T-U wave merging seen in today’s initial ECG is typical of the LQTS, Type 1 that today’s patient was found to have.
- PEARL #2: I long ago developed the easy-to-remember but surprisingly useful LIST of 3 Causes to consider whenever you encounter a long QTc in a patient who does not have a wide QRS. Think of the following! — i) Drugs (as noted above in Dr. Nossen’s discussion); — ii) Lytes (especially low serum K+ and Mg++ — but also low Ca++); and, iii) CNS disturbances (ie, Stroke [as for the patient in today’s case] — CNS Bleed — Brain Tumor — Coma — Seizure — Head Trauma — as some of the most abnormal ECGs are seen in patients with some form of CNS emergency).
- In 2025 — I’ll amend the above LIST by adding, under the right clinical circumstances — iv) Takotsubo (Stress) Cardiomyopathy (with an unusual anatomic distribution of ST-T wave abnormalites on ECG, that occurs in association with a surprisingly long QTc interval — suggesting this entity in a patient with new CP, heart failure, severe stress, etc.).
===============================
How to Measure the QTc when U Waves are Present:
In Figure-2 — I’ve adapted the figure published by Rawshani in the first reference cited above by Dr. Nossen (Rawshani — Cardiovasc Med, 2025). I’ve consolidated below several helpful tips put forth by Rawshani:
- For optimal accuracy — Measure the QT manually, ideally using a series of consecutive beats — taken from more than a single lead — selecting the longest QT interval for which you can clearly see the onset and offset landmarks of the QT.
- The QT interval should be measured from the onset of QRS complex until the end of the T wave (ie, If no Q wave is present — begin measuring from the R wave).
- Leads with large U waves are ideally avoided. While recommended to include large U waves that are fused with the preceding T wave in your measurement — Realize that doing so may result in overestimation of the QT interval (with this being a significant problem in today’s case! ).
- Be sure to adjust the QT interval for heart rate! (See My Reminder above, near the beginning of My Comment).
===============================
Figure-2: How to measure the QTc when U waves are present (Figure adapted from Rawshani — Cardiovasc Med, 2025).

========================================

