These ECGs were texted to me by one of our former ultrasound fellows, Will Smoot
A Middle-aged male presented with acute chest pain.
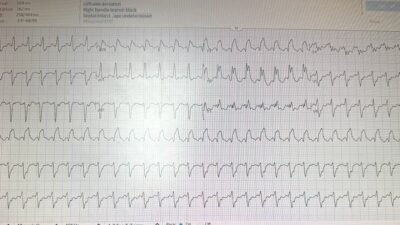
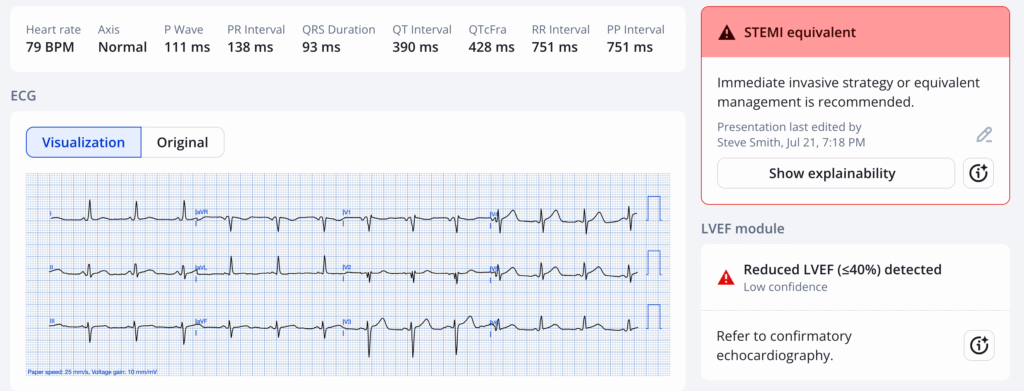
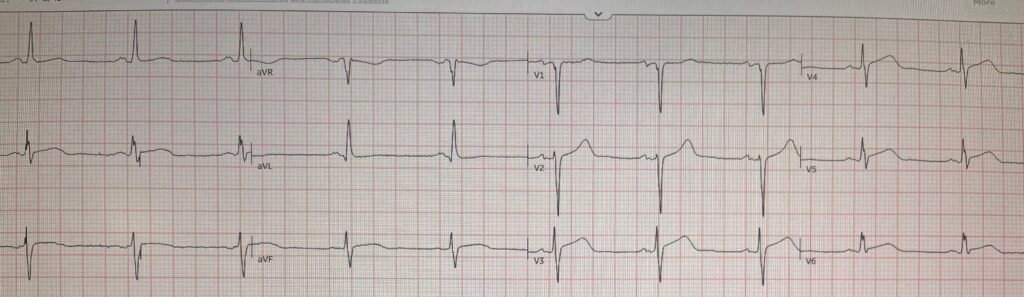
This initial ECG was recorded:
Smith: there are definite hyperacute T-waves in V4-5. So this is diagnostic of LAD Occlusion.
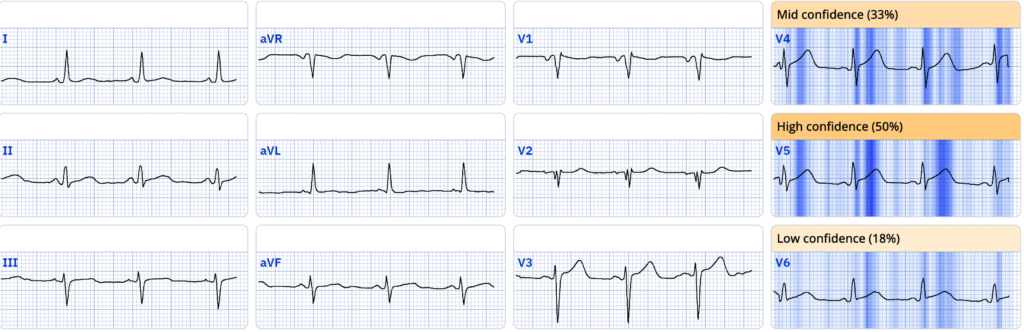
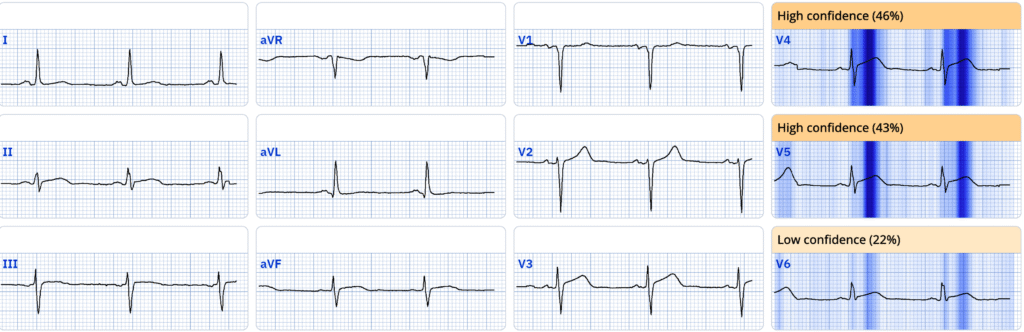
Queen of Hearts:
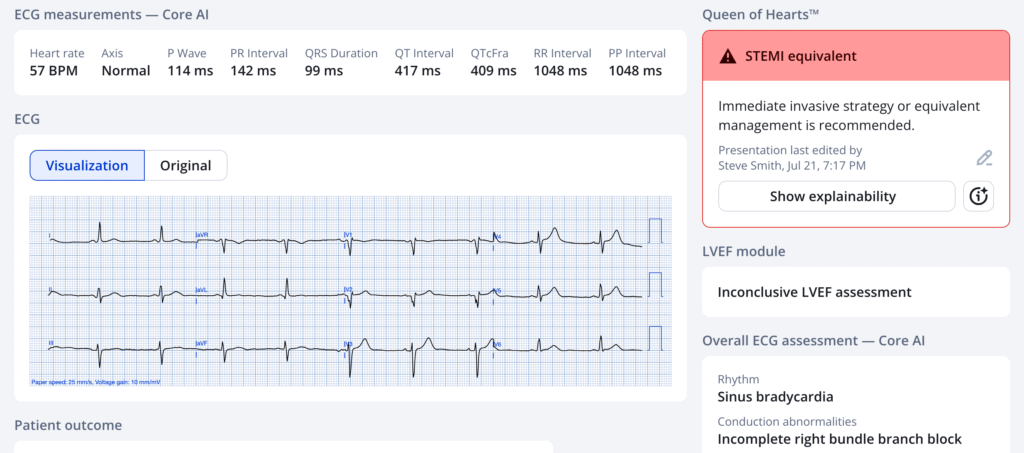
Here she explains:
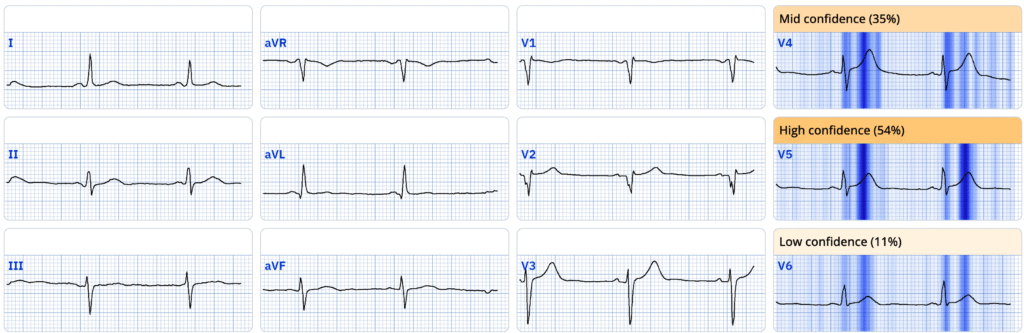
Is she correct?
New PMcardio for Individuals App 3.0 now includes the latest Queen of Hearts model and AI explainability (blue heatmaps)! Download now for iOS or Android. https://www.powerfulmedical.com/pmcardio-individuals/ (Drs. Smith and Meyers trained the AI Model and are shareholders in Powerful Medical).
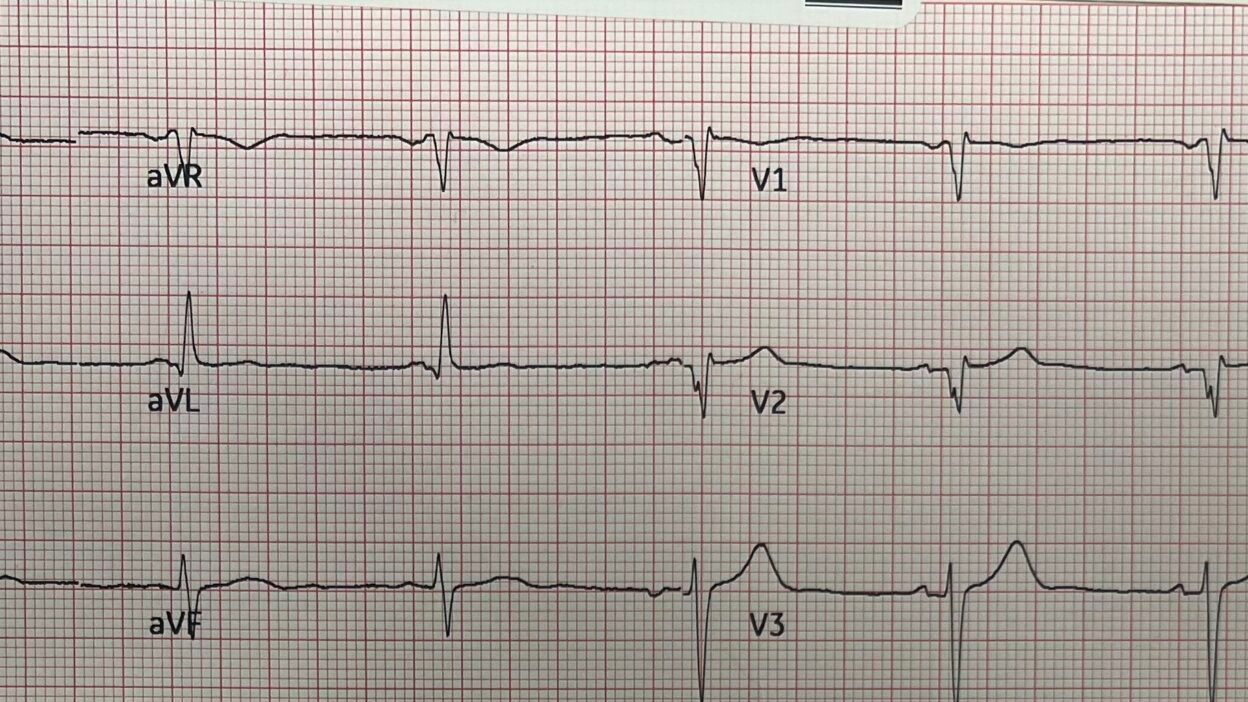
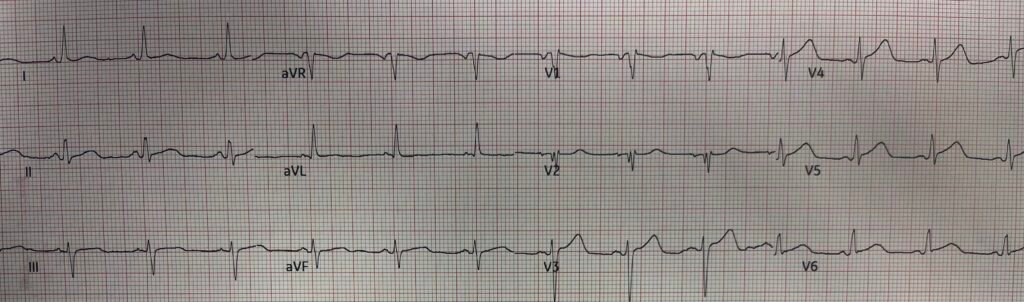
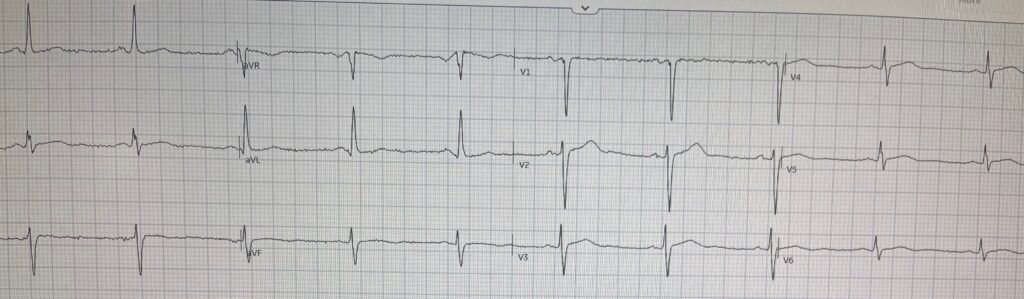
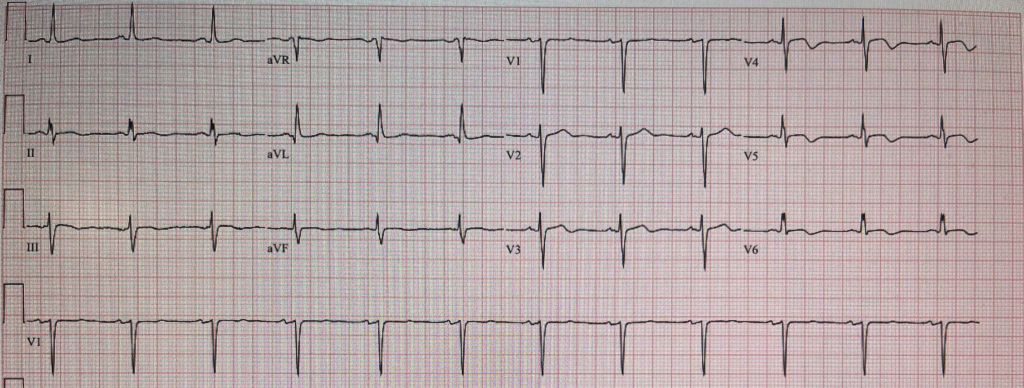
Previous from 9 months prior
It sure looks like the T-waves on the top ECG are now hyperacute compared to this prior ECG.
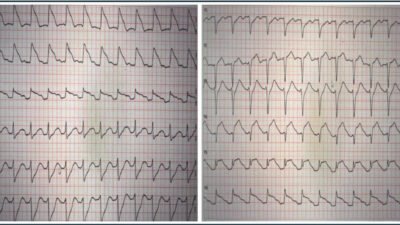
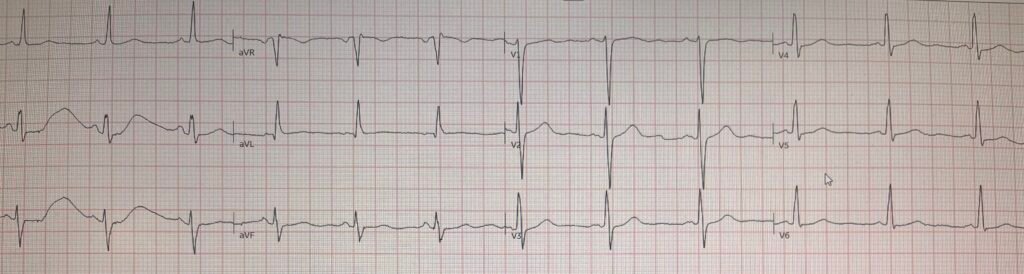
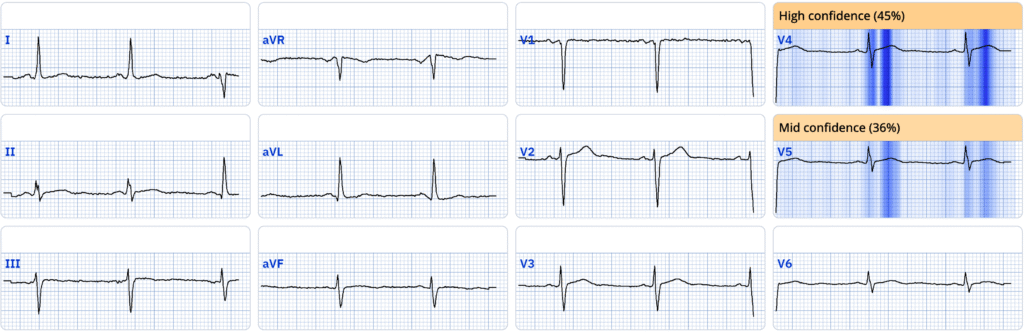
A repeat ECG was recorded:
Now the T-waves look bulkier and fatter. This is unequivocally diagnostic of LAD Occlusion (OMI)
The physician activated the cath lab, which required transfer to another hospital far away.
It is great that he did not wait for a troponin!
Shortly after, the initial troponin returned undetectable.
Now he was worried that it was a false activation. The angiogram had not shown an unequivocal OMI. It showed an 80% LAD “stenosis” (a “stenosis” does not necessarily mean a culprit — stenosis can be a chronic condtion) and appeared to be an acute culprit (“unstable appearing plaque”), but he was still skeptical that this was OMI, mostly because of the undetectable troponin.
He called me and I assured him that an initial undetectable troponin is not unusual in acute OMI.
He said, “Yes, but the patient had had pain for 6 hours.”
Later a 2nd troponin I returned at 4461 ng/L. No further troponins were measured.
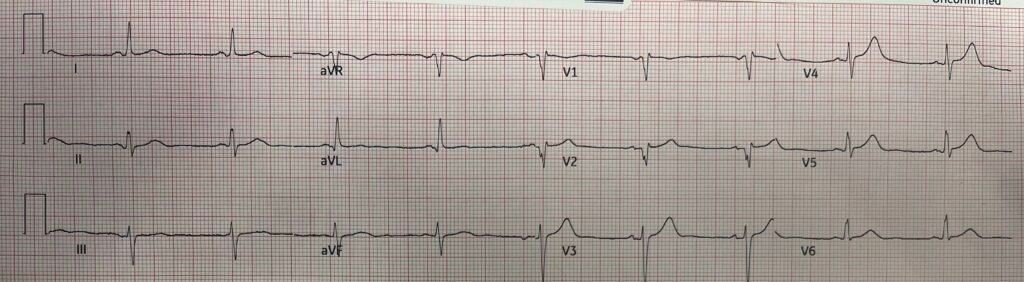
A post-PCI ECG was recorded:
There are residual hyperacute T-waves. The Queen sees them:
And another 3 hours later:
Smith: This one actually looks like it could represent re-occlusion (there are again hyperacute T-waves and new ST Elevation in V4-6 that meets criteria!), but I have no more information on that.
The Queen agrees:
Did the LAD Re-occlude? Not sure, but it did ultimately reperfuse:
Shows T-wave inversion in the affected leads (reperfusion T-waves)
Peak troponin I was 10,220 ng/L (typical of a STEMI).
Echo showed good EF of 60-65% with mild hypokinesis of the septal wall.
Learning Point:
- When you have an ECG diagnostic of OMI, do NOT wait for troponin because:
- A) myocardium dies while you wait
- B) It might come back negative and make you wait even longer for the next one.
- 6 hours of pain does NOT necessarily mean 6 hours of infarction. There may be on and off ischemia not resulting in infarction. Often it is only after the pain becomes unrelenting that the patients seeks care. At that point, the duration of ischemia may not be sufficient to result in an elevated troponin.
- An undetectable initial troponin only has a very high negative predictive value in the setting of a normal or non-diagnostic ECG. In the setting of a diagnostic ECG, it is nearly worthless
We studied the sensitivity and NPV of undetectable troponin (below the Limit of Detection – “LoD”) in these 2 studies:
Sandoval Y, Smith SW, Love SA, Sexter A, Schulz K, Apple FS. Single High-Sensitivity Cardiac Troponin I to Rule Out Acute Myocardial Infarction. Am J Med [Internet] 2017;130(9):1076-1083.e1. Available from: http://dx.doi.org/10.1016/j.amjmed.2017.02.032
Sandoval Y, Smith SW, Shah ASV, et al. Rapid Rule-Out of Acute Myocardial Injury Using a Single High-Sensitivity Cardiac Troponin I Measurement. Clin Chem [Internet] 2017;63(1):369–76. Available from: http://dx.doi.org/10.1373/clinchem.2016.264523
Rule-Out Using the LoD (limit of detection) Alone, and in Combination with a Normal ECG:
“In patients with hs-cTnI<LoD at presentation (27% of patients), independent of ECG findings, the NPV and sensitivity for acute myocardial infarction were 99.6% (95% CI, 98.9%-100%) and 98.8% (95% CI, 97.2%-100%), respectively (Table 2). Using hs-cTnI<LoD alone, 2 of 170 patients with acute myocardial infarction were missed, corresponding to a miss rate of 1.2% (or 2 of 444 patients with an hs-cTnI<LoD, 0.5%).”
“In comparison with hscTnI<LoD alone, the addition of a normal ECG (16% of patients) offered a NPV of 99.6% (95% CI, 98.9%-100%) and sensitivity of 99.4% (95% CI, 98.3%-100%) for acute myocardial infarction. Using hs-cTnI<LoD with a normal ECG, only 1 of 170 patients with acute myocardial
infarction was missed, corresponding to a miss rate of 0.6% (or 1 of 254 patients with an hs-cTnI<LoD and a normal ECG, 0.4%).”
“In the validation cohort, 22% had hs-cTnI LoD, with an NPV and diagnostic sensitivity for acute myocardial injury of 98.8% (97.9–99.7) and 99.3% (98.7–99.8) and an NPV for AMI or cardiac death at 30 days of 99.1% (98.2–99.8).”
In the setting of an ECG diagnostic of OMI, that sensitivity and NPV are far lower!
= = =
======================================
MY Comment, by KEN GRAUER, MD (8/5/2025):
The question I asked more than any other during my years on faculty was, “Will the results of the test(s) that you order change your management?” Today’s case provides an optimal example of why I so often asked this question.
- The treating physician in today’s case questioned his decision to activate the cath lab because the initial Troponin came back negative. But as emphasized in Dr. Smith’s Learning Points — the results of the initial Troponin in today’s case should not in the least alter management.
- This is because today’s patient presented with new CP (Chest Pain) — and, in this context the initial ECG that I’ve reproduced in Figure-1 indicates the need to activate the cath lab regardless of what the initial Troponin value is (because up to 25% of STEMI+ infarctions fail to satisfy ‘rule-in’ values on the initial Troponin — Wereski et al — JAMA Cardiology, 2020).
= = =
Why is today’s Initial ECG Diagnostic of an Acute OMI?
I focus my comment on today’s initial ECG — as well as on how the 2nd and 3rd tracings shown above in Dr. Smith’s discussion solidify our impression of that 1st tracing.
- In a patient with new CP (such as the middle-aged man in today’s case) — my “eye” was immediately drawn to lead V4 (within the RED rectangle in ECG #1). Given modest size of the QRS complex in this lead — the overly tall and “bulky” T wave in V4 (that is large enough, with a “fat” enough peak and wide enough base to “swallow” the diminutive R wave) is clearly hyperacute.
- In the context of knowing that lead V4 is hyperacute until proven otherwise — neighboring leads V3 and V5 also both manifest disproportionately large T waves (albeit lead V3 is harder to assess given our inability to know how deep the S wave in this lead truly is).
- KEY Point: The lead V1 and V2 electrodes were almost certainly placed too high on the chest because: i) Both of these leads manifest a terminal r’ (which is uncommon in V1 and highly unusual in lead V2); — ii) The P wave in lead V1 is all negative; — and, iii) QRS morphology of both leads V1 and V2 resemble the QRS appearance in lead aVR (See our page on Technical Misadventures for numerous examples of leads V1,V2 misplacement).
- The reason recognition of lead V1,V2 misplacement is so relevant in today’s case is our finding of hyperacute T waves for leads V3,V4,V5. Since the limb leads in ECG #1 are non-diagnostic — correct placement of the V1,V2 electrodes would add support to our strong suspicion of acute LAD OMI.
- BOTTOM Line: Given the history of new CP and the hyperacute T waves in leads V3,V4,V5 — even without the ability to assess leads V1,V2 — the need for prompt cath is already established.
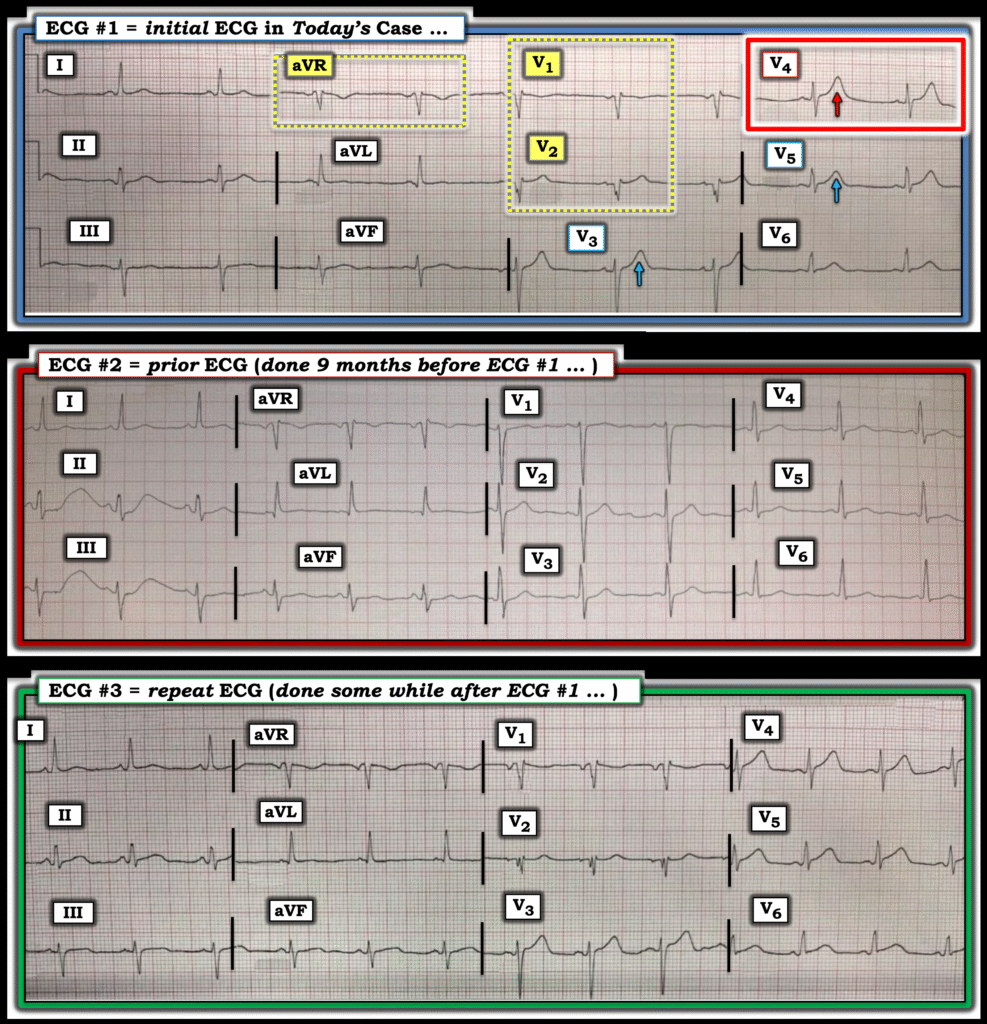
Figure-1: Comparison of the first 3 ECGs in today’s case.
What about ECG #2?
Access to a previous ECG will not always be readily available at the time that you need it. But it was available in today’s case.
- As per Dr. Smith — lead-by-lead comparison between ECG #1 and ECG #2 (done 9 months earlier) confirms beyond doubt the acuity of ST-T waves findings in leads V3,V4,V5 of the initial ECG.
Also of note in ECG #2 are the following findings:
- ECG #2 tells us that not only are the T waves in leads V3,V4,V5 of ECG #1 hyperacute — but the T wave in lead V6 of ECG #1 is also much more voluminous (therefore also hyperacute) than it was in the prior tracing.
- The limb leads in ECG #1 were indeed non-diagnostic (albeit there is impressive artifact distorting the ST-T waves for the first 2 complexes in leads II and III of ECG #2).
- Note how leads V1 and V2 in the prior ECG displayed normal upright P waves — a normal initial r wave in lead V1, and a relatively tall R wave in lead V2 (vs Q waves in leads V1,V2 of ECG #1) — and an upright T wave in lead V1 of the prior tracing. This confirms my suspicion of too high V1,V2 electrode placement in ECG #1.
What about ECG #3?
PEARL: Be sure that when you review serial ECGs — that you do so by going lead-by-lead (as is easy to do in Figure-1, in which I’ve put these 3 tracings together). Failure to compare lead-by-lead the 2 tracings you are reviewing makes it all too easy to overlook subtle findings.
- Once again — the lead V1,V2 electrodes have been placed too high on the chest in ECG #3 (Remember that ECG #3 was still done in the ED a bit after ECG #1 — therefore probably recorded by the same technician. In contrast — ECG #2 was done 9 months earlier, so clearly recorded by a different technician who correctly placed the V1,V2 electrodes on the chest).
- KEY Point: As per Dr. Smith — a number of leads in ECG #3 look more acute than they did in ECG #1 (There is now subtle-but-real increased ST segment coving in all 3 inferior leads in ECG #2 compared to ECG #1 — as well as an increase in ST segment “volume” with ST segment straightening in leads V4,V5,V6).