A woman in her 80s presented for hypotension. She had been feeling generally unwell for 3 days. Caregivers report that she has some mildly altered mental status. BP was 70s/40s on arrival.
The initial impression of the patient was sepsis.
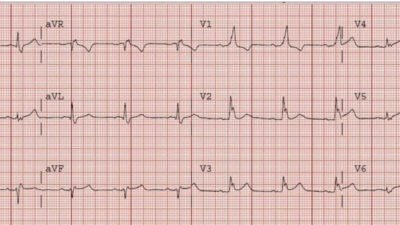
On arrival, she had this ECG recorded:
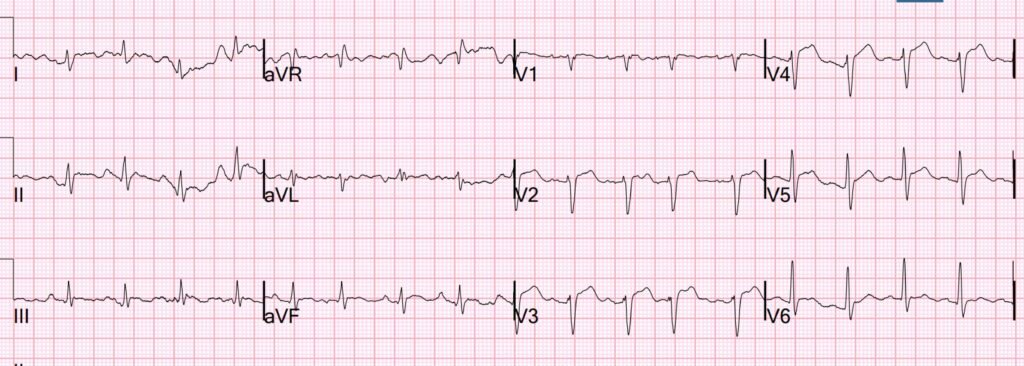
What do you think?
There appear to be hyperacute T-waves in V3-4. But on questioning the patient, she did not have any symptoms suggestive of ACS.
The Queen agrees:
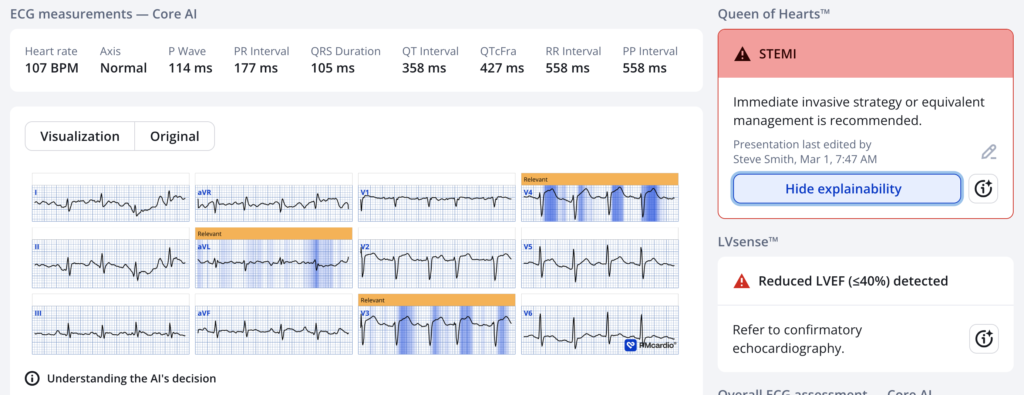
New PMcardio for Individuals App 3.0 now includes the latest Queen of Hearts model and AI explainability (blue heatmaps)! Download now for iOS or Android. https://www.powerfulmedical.com/pmcardio-individuals/ (Drs. Smith and Meyers trained the AI Model and are shareholders in Powerful Medical). As a member of our community, you can use the code DRSMITH20 to get an exclusive 20% off your first year of the annual subscription. Disclaimer: Certain AI ECG Modules are CE-marked medical devices under EU MDR and are certified for marketing only in the European Union and the United Kingdom. PMcardio technology has not yet been cleared by the US Food and Drug Administration (FDA) for clinical use in the USA.
A bedside echo was recorded as part of the workup for hypotension:
Again, the MDs taking care of her thought that she had sepsis and possible cholecystitis based on an ultrasound and CT of the abdomen.
Then, the first high sensitivity troponin I returned at 9000 ng/L.
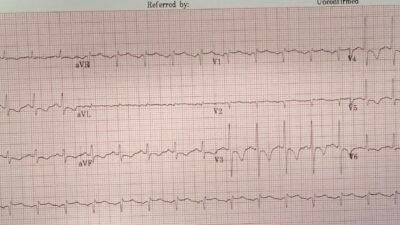
So another ECG was recorded:
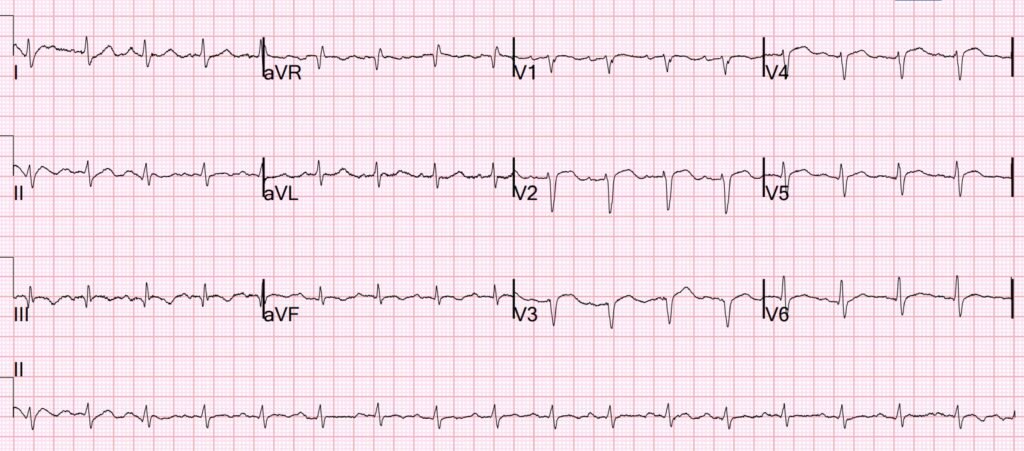
The T-waves are no longer hyperacute.
Above is the video taken at the start of the case. Here is a still image from that video. What do you see?
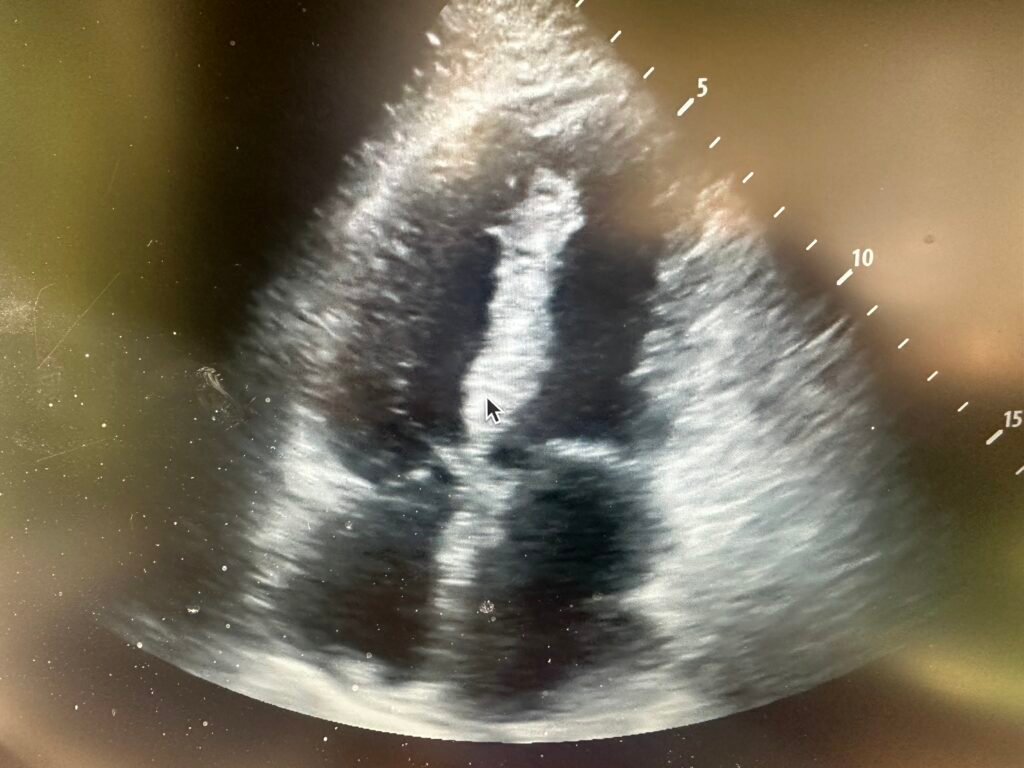
Here is a still image which shows the finding. Do you see it?
Here I point it out with an arrow:
There is a large ventricular septal rupture. I could hardly believe my eyes because the patient was comfortable without dyspnea or chest pain, and after fluids had a normal blood pressure.
Because of this, I was not at all certain that I was interpreting the ultrasound correctly.
I consulted cardiology a formal echo was done:
–Normal LV size and systolic function with an estimated EF of 58%.
–Regional wall motion abnormality–apical anterior, apical septal, apical
inferior, and apical lateral hypokinesis.
–Apical ventricular septal defect, left to right shunt.
After much discussion with the family, it was decided to go ahead with surgery if possible. The patient did deteriorate over some hours and needed intubation prior to the angiogram.
Angiogram confirmed significant coronary disease but open arteries:
LAD: Large caliber vessel. There is patent stent in proximal to mid LAD with
moderate instent restenosis. after the stent there is 90% stenosis over a
short segment. Distal and apical LAD have mild diffuse disease without
significant stenosis. There is large bifurcating diagonal with severe
stenosis in the inferior branch.
The second troponin was slightly lower.
Further history revealed that the patient had had some chest discomfort 3 days prior.
Later, the family decided to NOT go ahead with surgery, and the patient died.
As for the ECG:
The usual finding of the ECG in a case of infarct-related septal rupture is one of SUBACUTE infarct, without hyperacute T-waves. So this is unusual in that:
1) the patient was not deathly ill and in pulmonary edema (the usual presentation of acute septal rupture) and
2) the ECG did not show subacute infarct, but findings of ACUTE infarct.
Magnus writes correctly: “I would suspect this patient had MI three days prior then reperfused. The ECGs shown would fit with reocclusion with pseudonomalization (with hyperacute T waves) and then another episode of reperfusion with deflating HATW.
= = =
======================================
MY Comment, by KEN GRAUER, MD (3/1/2026):
QUESTION:
- What did YOU think about the 2 ECGs in today’s case when you first looked at them?
= = =
CONFESSION:
- My 1st impression was faulty — because I failed to practice what I preach ….
- The LESSON I learned: — Unless we routinely assess serial ECGs by placing both tracings next to each other — we will miss subtle-but-potentially-important changes between serial tracings that sometimes convey the important “dynamic” ST-T wave changes that indicate a need for prompt cath that was not evident (or perhaps, which was evident — but not enough to convince a doubting interventionist) about the need for prompt cath!
= = =
My CHALLENGE to Our READERS:
- If you have not already done so — Please GO BACK to the 2 tracings posted above in Dr. Smith’s discussion.
- Are there any potentially important differences (changes) between these 2 ECGs?
- = = =
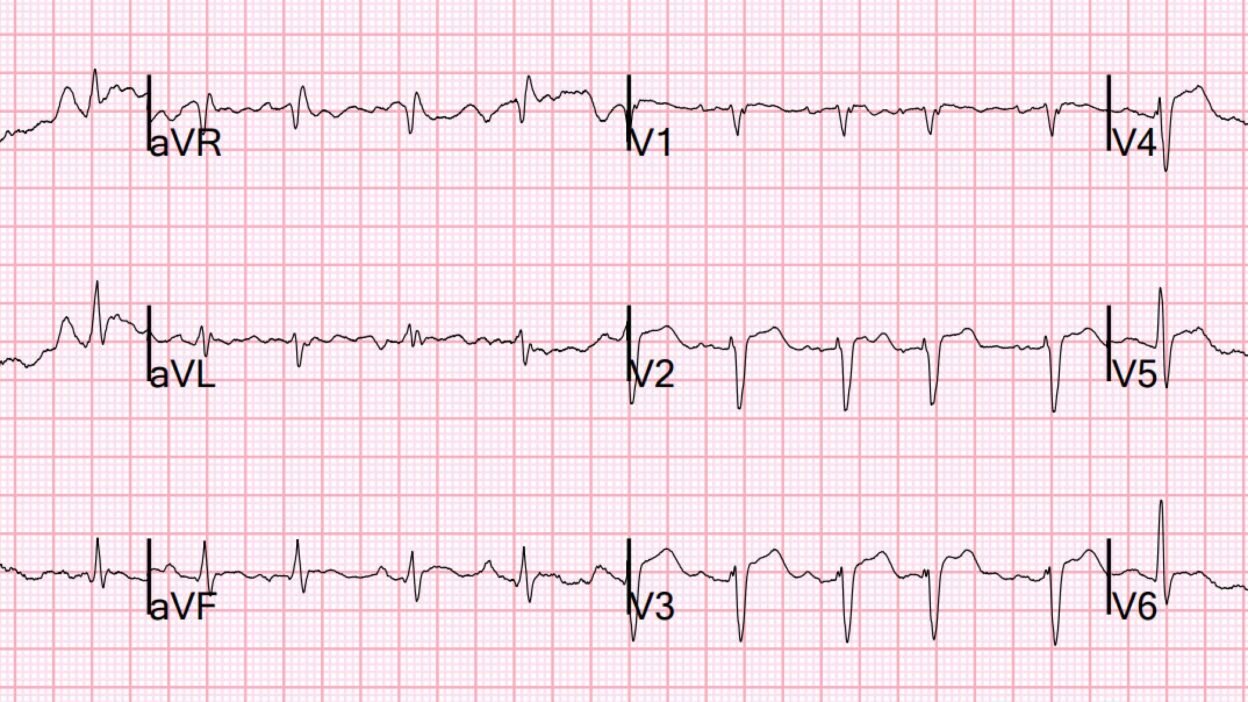
- After you have done the above — Please take one more LOOK at these two tracings in Figure-1, in which I’ve put them together to facilitate lead-by-lead comparison). Would you now in any way change what your initial impression had been?
= = =
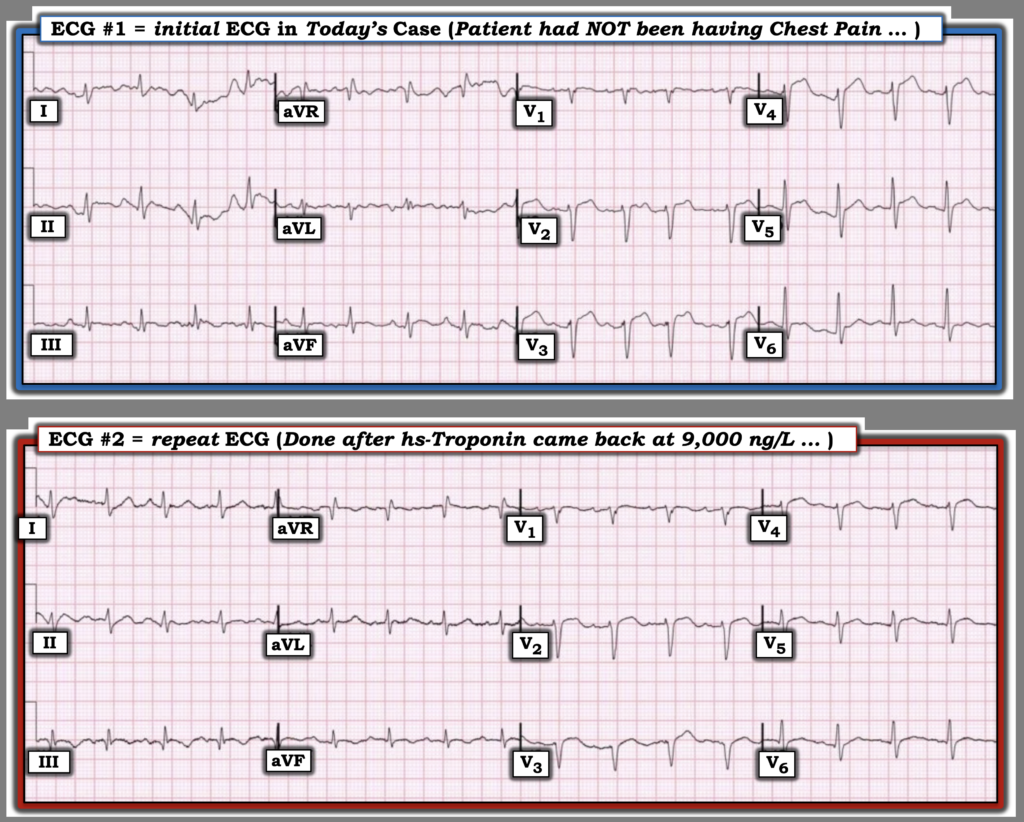
Figure-1: To facilitate lead-by-lead comparison — I’ve placed the 2 ECGs in today’s case together. What is the difference (if any) between these 2 tracings?
= = =
What I Now See in Figure-1:
Now that I’ve put both tracings together — Isn’t it much easier (and faster) to compare these 2 ECGs?
- The rhythm in both tracings is sinus tachycardia at a rate of ~110/minute. There is a bit more artifact in ECG #1, making it a bit more challenging to detect “real” differences in ST-T wave morphology between the 2 tracings.
- The frontal plane axis in both tracings is virtually the same. The same is true for R wave progression and QRS morphology between the true tracings — which means that our lead-by-lead comparison between these 2 tracings will be valid! (something that would not necessarily be true if either the frontal plane axis or chest lead QRS morphology was significantly different!).
- It’s hard to tell IF a Q wave was previously present in lead III — but a definite Q wave now is present in lead III in ECG #2. (NOTE — There now is a definite S1Q3T3 pattern in ECG #2. In the absence of other ECG findings — this does not imply there is acute PE — but it would be EASY to overlook this finding if I was not systematic).
- Of more relevance to today’s case — I now in ECG #2 defintely see ST segment coving with T wave inversion in leads III and aVF — whereas this finding was not consistently present in all beats in ECG #1.
- As per Dr. Smith — The ST-T waves in leads V3,V4 in ECG #1 look hyperacute (ie, The ST segment takeoff in both of these leads in ECG #1 is clearly straightened — and there is subtle-but-real J-point ST segment elevation in both of these leads).
- In addition — neighboring leads V2 and V5 in ECG #1 appear to manifest ST segment straightening, suggesting a wider extent of potentially hyperacuity in this initial tracing!
- In comparison in ECG #2 — the J-point ST elevation has deflated, and the T waves in leads V2-thru-V5 now clearly look less hyperacute!
- My Impression of Figure-1: Now that I am viewing ECGs #1 and #2 side-by-side — I’d interpret these serial tracings as showing hyperacute ST-T wave changes consistent with an evolving LAD event in ECG #1 — and the presence of “dynamic” ST-T wave changes in ECG #2, that pending clinical correlation, could be consistent with some degree of reperfusion.
= = =
My Lesson from Today’s CASE:
- It’s good to be humbled from time to time when I fail to practice what I preach.
- The simple act of always assessing serial tracings by looking at both tracings together and then going lead-by-lead is the BEST way not to overlook potentially important changes between the 2 ECGs.
= = =
= = =